Augmented Reality Automotive Display Market Analysis:
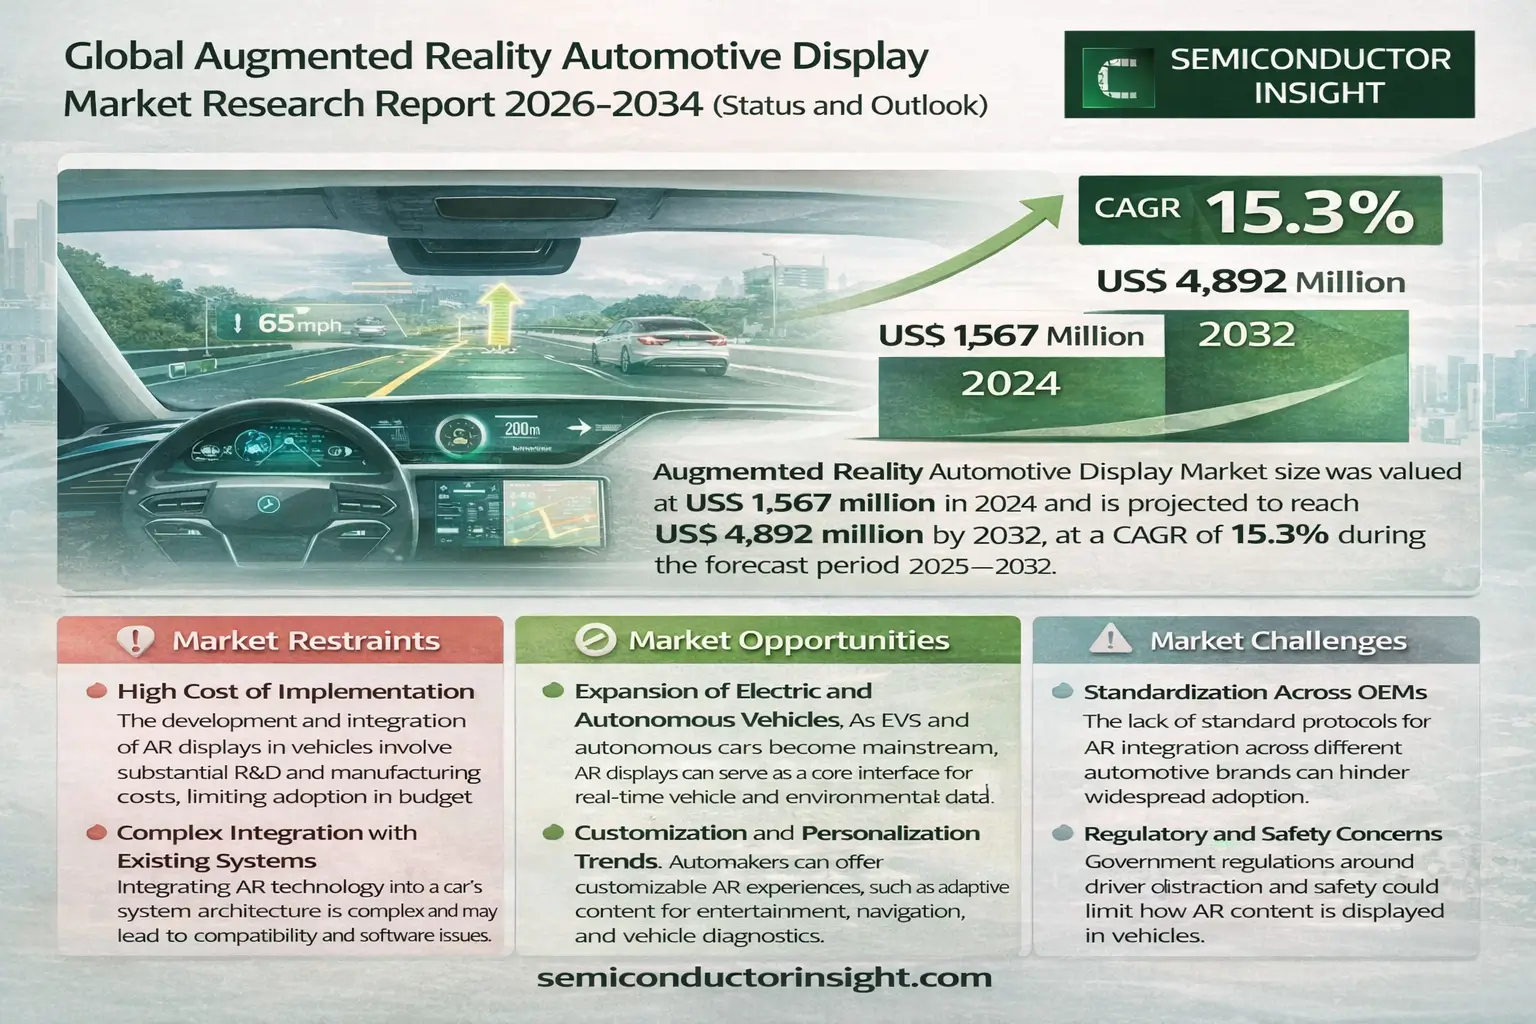
Global Augmented Reality Automotive Display Market size was valued at USD 1,567 million in 2024 and is projected to reach USD 4,892 million by 2032, at a CAGR of 15.3% during the forecast period 2025-2032
Augmented Reality Automotive Display Market Overview
This report provides a deep insight into the global Augmented Reality Automotive Display Market covering all its essential aspects. This ranges from a macro overview of the market to micro details of the market size, competitive landscape, development trend, niche market, key market drivers and challenges, SWOT analysis, value chain analysis, etc.
The analysis helps the reader to shape the competition within the industries and strategies for the competitive environment to enhance the potential profit. Furthermore, it provides a simple framework for evaluating and accessing the position of the business organization. The report structure also focuses on the competitive landscape of the Global Augmented Reality Automotive Display Market, this report introduces in detail the market share, market performance, product situation, operation situation, etc. of the main players, which helps the readers in the industry to identify the main competitors and deeply understand the competition pattern of the market.
In a word, this report is a must-read for industry players, investors, researchers, consultants, business strategists, and all those who have any kind of stake or are planning to foray into the Augmented Reality Automotive Display Market in any manner.
Augmented Reality Automotive Display Key Market Trends :
-
Rise of AR Head-Up Displays (HUDs)
Automakers are increasingly integrating AR HUDs into vehicles to enhance driver safety and experience through real-time navigation, hazard alerts, and speed display. -
Integration with ADAS Systems
AR displays are being synchronized with advanced driver-assistance systems (ADAS) to provide contextual alerts and intuitive driver feedback. -
Growing Demand for Luxury Vehicles
The premium car segment is driving AR adoption, as luxury carmakers adopt immersive tech to differentiate their models. -
Automotive OEMs Partnering with Tech Giants
Collaborations between car manufacturers and companies like Google, Apple, and Qualcomm are accelerating the commercialization of AR display technologies. -
Expansion in Emerging Markets
Countries in Asia-Pacific and South America are showing increased adoption due to rising vehicle ownership and tech-forward consumer behavior.
Augmented Reality Automotive Display Market Regional Analysis :
- North America:Strong demand driven by EVs, 5G infrastructure, and renewable energy, with the U.S. leading the market.
- Europe:Growth fueled by automotive electrification, renewable energy, and strong regulatory support, with Germany as a key player.
- Asia-Pacific:Dominates the market due to large-scale manufacturing in China and Japan, with growing demand from EVs, 5G, and semiconductors.
- South America:Emerging market, driven by renewable energy and EV adoption, with Brazil leading growth.
- Middle East & Africa:Gradual growth, mainly due to investments in renewable energy and EV infrastructure, with Saudi Arabia and UAE as key contributors.
Augmented Reality Automotive Display Market Segmentation :
The research report includes specific segments by region (country), manufacturers, Type, and Application. Market segmentation creates subsets of a market based on product type, end-user or application, Geographic, and other factors. By understanding the market segments, the decision-maker can leverage this targeting in the product, sales, and marketing strategies. Market segments can power your product development cycles by informing how you create product offerings for different segments.
Key Company
- Qualcomm
- Continental AG
- Apple
Market Segmentation (by Type)
- Less Than 5 Inches
- 5 Inches to 10 Inches
- Greater Than 10 Inches
Market Segmentation (by Application)
- Military
- Entertainment
- Others
Market Drivers
-
Enhanced Driver Safety and Experience
AR displays improve real-time awareness by projecting vital information directly onto the windshield, reducing distractions and improving road safety. -
Rising Consumer Demand for Connected Cars
The shift toward connected and intelligent vehicles is fueling the demand for AR displays that offer a more immersive driving experience. -
Technological Advancements in Display Technology
Innovations in OLED and microLED displays are making AR automotive systems more energy-efficient, compact, and visually clear.
Market Restraints
-
High Cost of Implementation
The development and integration of AR displays in vehicles involve substantial R&D and manufacturing costs, limiting adoption in budget segments. -
Complex Integration with Existing Systems
Integrating AR technology into a car’s system architecture is complex and may lead to compatibility and software issues. -
Limited Awareness in Developing Countries
Consumers in some developing regions remain unaware of AR’s benefits in automobiles, slowing down market penetration.
Market Opportunities
-
Expansion of Electric and Autonomous Vehicles
As EVs and autonomous cars become mainstream, AR displays can serve as a core interface for real-time vehicle and environmental data. -
Customization and Personalization Trends
Automakers can offer customizable AR experiences, such as adaptive content for entertainment, navigation, and vehicle diagnostics. -
Growing Aftermarket Demand
Aftermarket upgrades for existing vehicles with AR capabilities are gaining popularity, especially in the luxury and sports car segments.
Market Challenges
-
Standardization Across OEMs
The lack of standard protocols for AR integration across different automotive brands can hinder widespread adoption. -
Regulatory and Safety Concerns
Government regulations around driver distraction and safety could limit how AR content is displayed in vehicles. -
Thermal and Environmental Limitations
AR systems must operate under extreme automotive conditions like heat, vibration, and humidity, which poses durability challenges.
Key Benefits of This Market Research:
- Industry drivers, restraints, and opportunities covered in the study
- Neutral perspective on the market performance
- Recent industry trends and developments
- Competitive landscape & strategies of key players
- Potential & niche segments and regions exhibiting promising growth covered
- Historical, current, and projected market size, in terms of value
- In-depth analysis of the Augmented Reality Automotive Display Market
- Overview of the regional outlook of the Augmented Reality Automotive Display Market:
Key Reasons to Buy this Report:
- Access to date statistics compiled by our researchers. These provide you with historical and forecast data, which is analyzed to tell you why your market is set to change
- This enables you to anticipate market changes to remain ahead of your competitors
- You will be able to copy data from the Excel spreadsheet straight into your marketing plans, business presentations, or other strategic documents
- The concise analysis, clear graph, and table format will enable you to pinpoint the information you require quickly
- Provision of market value (USD Billion) data for each segment and sub-segment
- Indicates the region and segment that is expected to witness the fastest growth as well as to dominate the market
- Provides insight into the market through Value Chain
- Market dynamics scenario, along with growth opportunities of the market in the years to come
- 6-month post-sales analyst support
Customization of the Report
In case of any queries or customization requirements, please connect with our sales team, who will ensure that your requirements are met.
FAQs
Q1. What are the key driving factors and opportunities in the Augmented Reality Automotive Display Market?
A: Key drivers include enhanced safety, demand for connected cars, and display innovations. Opportunities lie in EVs, autonomous driving, and aftermarket AR upgrades.
Q2. Which region is projected to have the largest market share?
A: North America is expected to dominate the market due to early technology adoption, strong automotive OEM presence, and consumer demand.
Q3. Who are the top players in the global Augmented Reality Automotive Display Market?
A: Leading companies include Qualcomm, Continental AG, Google, and Apple, all playing major roles in product innovation and integration.
Q4. What are the latest technological advancements in the industry?
A: Advancements include microLED and OLED displays, integration with ADAS, and AR HUDs with real-time sensor-based navigation.
Q5. What is the current size of the global Augmented Reality Automotive Display Market?
A: Augmented Reality Automotive Display Market size was valued at USD 1,567 million in 2024 and is projected to reach USD 4,892 million by 2032, at a CAGR of 15.3% during the forecast period 2025-2032
Get Sample Report PDF for Exclusive Insights
Report Sample Includes
- Table of Contents
- List of Tables & Figures
- Charts, Research Methodology, and more...


