ATP Luminometer Market Overview
Measuring the amount of bioluminescence from an ATP reaction provides an excellent indication of surface cleanliness. This is because the quantity of light generated by the reaction is directly proportional to the amount of ATP present in the sample.
This report provides a deep insight into the global ATP Luminometer market covering all its essential aspects. This ranges from a macro overview of the market to micro details of the market size, competitive landscape, development trend, niche market, key market drivers and challenges, SWOT analysis, value chain analysis, etc.
The analysis helps the reader to shape the competition within the industries and strategies for the competitive environment to enhance the potential profit. Furthermore, it provides a simple framework for evaluating and accessing the position of the business organization. The report structure also focuses on the competitive landscape of the Global ATP Luminometer Market, this report introduces in detail the market share, market performance, product situation, operation situation, etc. of the main players, which helps the readers in the industry to identify the main competitors and deeply understand the competition pattern of the market.
In a word, this report is a must-read for industry players, investors, researchers, consultants, business strategists, and all those who have any kind of stake or are planning to foray into the ATP Luminometer market in any manner.
ATP Luminometer Market Analysis:
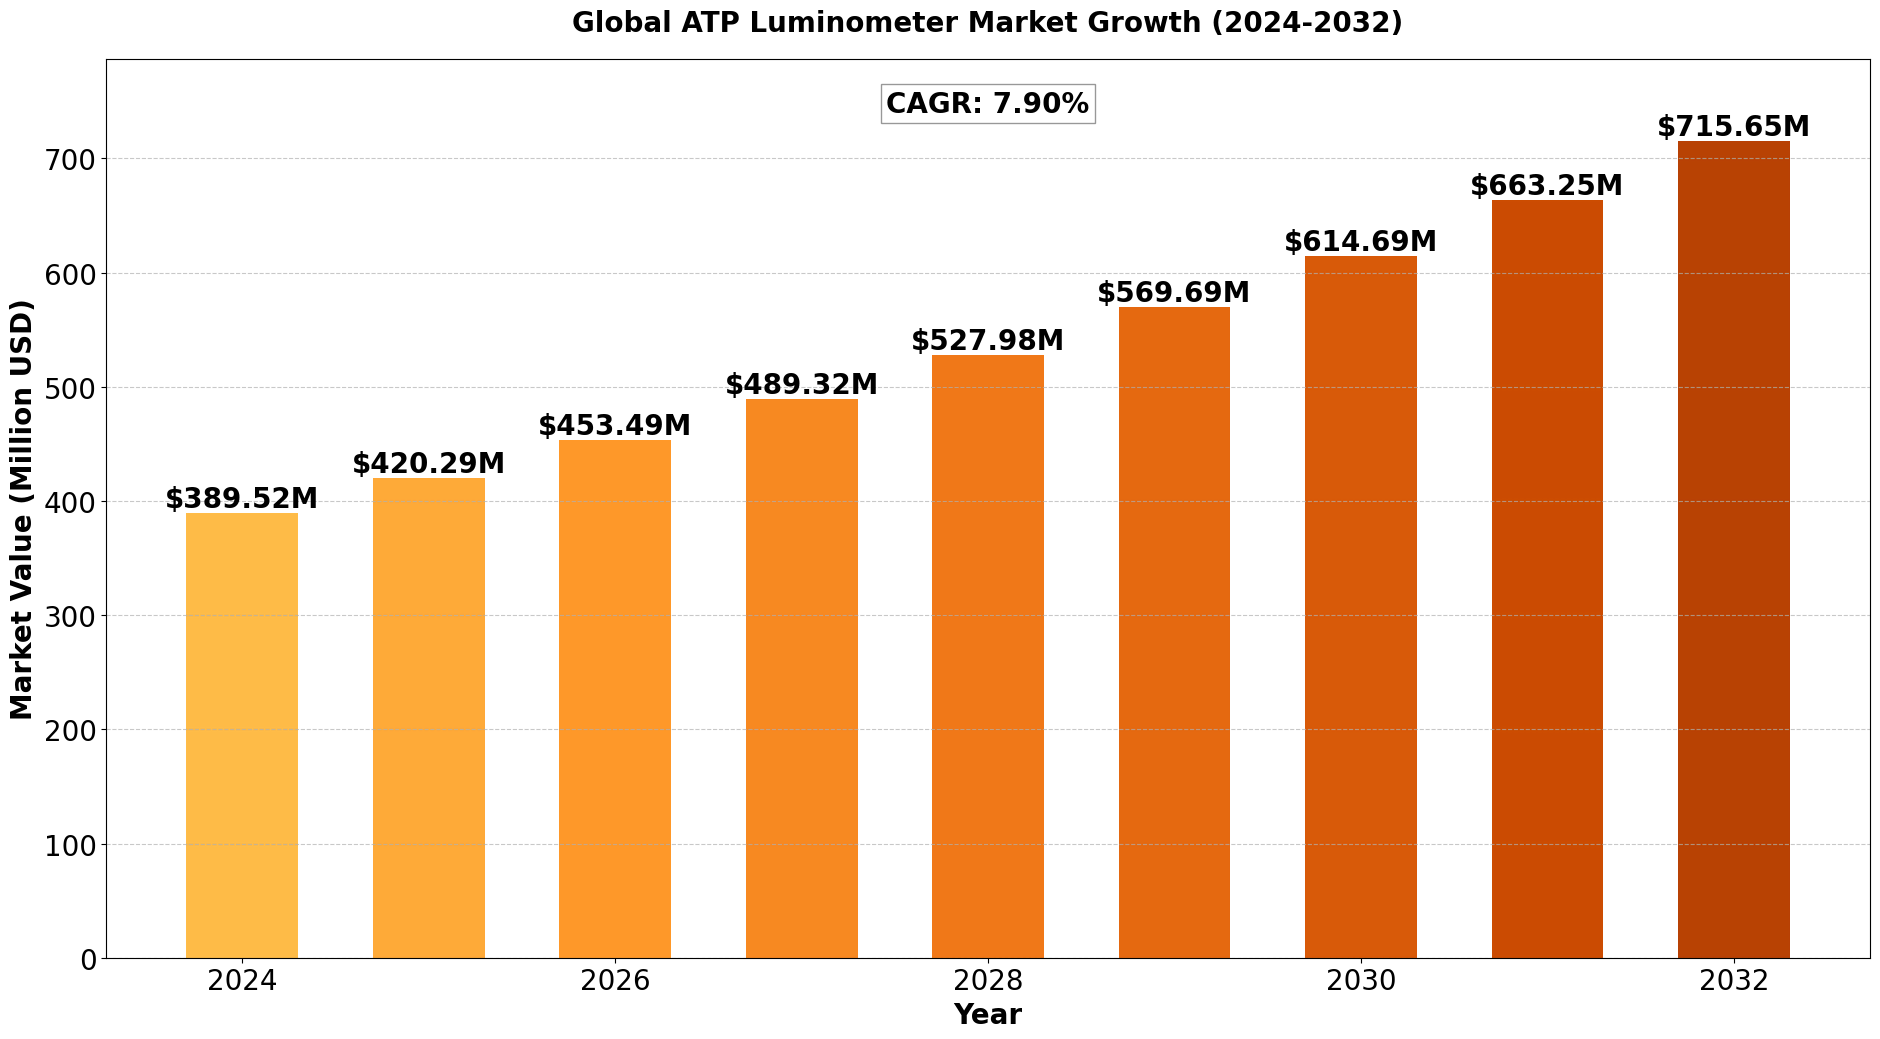
The Global ATP Luminometer Market size was estimated at USD 361 million in 2023 and is projected to reach USD 715.65 million by 2032, exhibiting a CAGR of 7.90% during the forecast period.
North America ATP Luminometer market size was estimated at USD 107.24 million in 2023, at a CAGR of 6.77% during the forecast period of 2025 through 2032.
ATP Luminometer Key Market Trends :
-
Growing Emphasis on Hygiene & Sanitation
- Increased focus on surface cleanliness in food processing, healthcare, and pharmaceutical sectors is driving ATP Luminometer adoption.
-
Shift Toward Portable & Handheld Devices
- The rising demand for real-time contamination detection is fueling the popularity of handheld ATP luminometers.
-
Technological Advancements in Bioluminescence Detection
- Innovations in sensor technology and software analytics are enhancing sensitivity, accuracy, and automation capabilities.
-
Increasing Adoption in Food & Beverage Industry
- Regulatory compliance and food safety standards are pushing food manufacturers to integrate ATP monitoring for quality control.
-
Expansion in Emerging Markets
- Rapid industrialization and growing awareness of hygiene monitoring in Asia-Pacific and Latin America are fueling market growth.
ATP Luminometer Market Regional Analysis :

-
North America:
Strong demand driven by EVs, 5G infrastructure, and renewable energy, with the U.S. leading the market.
-
Europe:
Growth fueled by automotive electrification, renewable energy, and strong regulatory support, with Germany as a key player.
-
Asia-Pacific:
Dominates the market due to large-scale manufacturing in China and Japan, with growing demand from EVs, 5G, and semiconductors.
-
South America:
Emerging market, driven by renewable energy and EV adoption, with Brazil leading growth.
-
Middle East & Africa:
Gradual growth, mainly due to investments in renewable energy and EV infrastructure, with Saudi Arabia and UAE as key contributors.
ATP Luminometer Market Segmentation
The research report includes specific segments by region (country), manufacturers, Type, and Application. Market segmentation creates subsets of a market based on product type, end-user or application, Geographic, and other factors. By understanding the market segments, the decision-maker can leverage this targeting in the product, sales, and marketing strategies. Market segments can power your product development cycles by informing how you create product offerings for different segments.
Key Company
- 3M
- Merck
- Creative Diagnostics
- Berthold Technologies
- Charm Sciences
- Ruhof
- Hygiena
- Kikkoman Biochemifa
- Neogen
- LuminUltra
- Shandong Hengmei Electronic Technology
- Xi’an Tianlong Science and Technology
- Qingdao Lubohongye Environmental Protection Technology Development
- Ningbo Meicheng Biotechnology
- Shandong Meizheng Bio-Tech
Market Segmentation (by Type)
- Handheld
- Desktop
Market Segmentation (by Application)
- Food
- Medical Insurance
- Health Monitoring
- Others
Drivers
- Rising Hygiene and Safety Concerns
The growing awareness of cleanliness in food processing, healthcare, and pharmaceuticals is a major driver of the ATP luminometer market. - Stringent Regulatory Standards
Compliance with international hygiene and contamination control regulations is increasing the adoption of ATP luminometers. - Advancements in Detection Technology
Continuous improvements in sensitivity and accuracy are making these devices more reliable and widely used.
Restraints
- High Initial Investment Costs
The cost of high-quality ATP luminometers can be a barrier, especially for small-scale businesses. - Limited Awareness in Developing Markets
Lack of knowledge and expertise in using ATP luminometers in certain regions is restraining market growth. - Alternative Testing Methods
The presence of other microbial detection techniques may impact market demand.
Opportunities
- Expansion in Emerging Economies
Developing countries are increasingly adopting ATP luminometers, presenting lucrative growth opportunities. - Integration with Digital Technologies
Smart ATP luminometers with data tracking and connectivity features are enhancing usability and demand. - Increased Demand in Water and Environmental Testing
The growing need for contamination monitoring in water treatment plants is boosting ATP luminometer adoption.
Challenges
- Technological Complexity
Advanced ATP luminometers require proper training for accurate results, posing a challenge for widespread adoption. - Fluctuations in Raw Material Costs
Variations in the availability and cost of components may impact pricing and profitability. - Regulatory Hurdles
Meeting different regional compliance standards can be a challenge for manufacturers.
Key Benefits of This Market Research:
- Industry drivers, restraints, and opportunities covered in the study
- Neutral perspective on the market performance
- Recent industry trends and developments
- Competitive landscape & strategies of key players
- Potential & niche segments and regions exhibiting promising growth covered
- Historical, current, and projected market size, in terms of value
- In-depth analysis of the ATP Luminometer Market
- Overview of the regional outlook of the ATP Luminometer Market:
Key Reasons to Buy this Report:
- Access to date statistics compiled by our researchers. These provide you with historical and forecast data, which is analyzed to tell you why your market is set to change
- This enables you to anticipate market changes to remain ahead of your competitors
- You will be able to copy data from the Excel spreadsheet straight into your marketing plans, business presentations, or other strategic documents
- The concise analysis, clear graph, and table format will enable you to pinpoint the information you require quickly
- Provision of market value data for each segment and sub-segment
- Indicates the region and segment that is expected to witness the fastest growth as well as to dominate the market
- Provides insight into the market through Value Chain
- Market dynamics scenario, along with growth opportunities of the market in the years to come
- 6-month post-sales analyst support
Customization of the Report
In case of any queries or customization requirements, please connect with our sales team, who will ensure that your requirements are met.
FAQs
Q: What are the key driving factors and opportunities in the ATP Luminometer market?
A: Key driving factors include rising hygiene concerns, stringent regulatory standards, and advancements in detection technology. Opportunities exist in emerging markets, digital integration, and environmental testing.
Q: Which region is projected to have the largest market share?
A: North America is expected to dominate the market due to strict hygiene regulations, followed by Europe and the Asia-Pacific region.
Q: Who are the top players in the global ATP Luminometer market?
A: Leading companies include 3M, Merck, Creative Diagnostics, Berthold Technologies, Charm Sciences, and Hygiena.
Q: What are the latest technological advancements in the industry?
A: Innovations include high-sensitivity bioluminescence detection, wireless connectivity, and AI-based contamination analysis.
Q: What is the current size of the global ATP Luminometer market?
A: The market was valued at USD 361 million in 2023 and is projected to reach USD 715.65 million by 2032, growing at a CAGR of 7.90%.

Get Sample Report PDF for Exclusive Insights
Report Sample Includes
- Table of Contents
- List of Tables & Figures
- Charts, Research Methodology, and more...


