Glass Substrates for Displays Market, Size, Trends, Business Strategies 2025-2032

Global Glass Substrates for Displays market size was estimated at USD 6215 million in 2023 and is projected to reach USD 7695.76 million by 2030, exhibiting a CAGR of 3.10% during the forecast period.

PDF Icon Download Sample Report PDF
  • Quick Dispatch

    All Orders

  • Secure Payment

    100% Secure Payment

Compare

$1,500.00$4,250.00

Clear

Glass Substrates for Displays Market Overview

This report studies the Display Glass Substrate market, Display glass substrate is a special glass used for thin-film-transistor (TFT) liquid crystal displays (LCD) and OLEDs, which form the display area of products including LCD televisions, personal computers and mobile phones. An LCD panel consists of various components stacked in a number of layers. These components include a polarizer, a color filter and a liquid crystal layer, with the glass substrate being the most important..

This report provides a deep insight into the global Glass Substrates for Displays market covering all its essential aspects. This ranges from a macro overview of the market to micro details of the market size, competitive landscape, development trend, niche market, key market drivers and challenges, SWOT analysis, value chain analysis, etc.

The analysis helps the reader to shape the competition within the industries and strategies for the competitive environment to enhance the potential profit. Furthermore, it provides a simple framework for evaluating and accessing the position of the business organization. The report structure also focuses on the competitive landscape of the Global Glass Substrates for Displays Market, this report introduces in detail the market share, market performance, product situation, operation situation, etc. of the main players, which helps the readers in the industry to identify the main competitors and deeply understand the competition pattern of the market.
In a word, this report is a must-read for industry players, investors, researchers, consultants, business strategists, and all those who have any kind of stake or are planning to foray into the Glass Substrates for Displays market in any manner.

Glass Substrates for Displays Market Analysis:

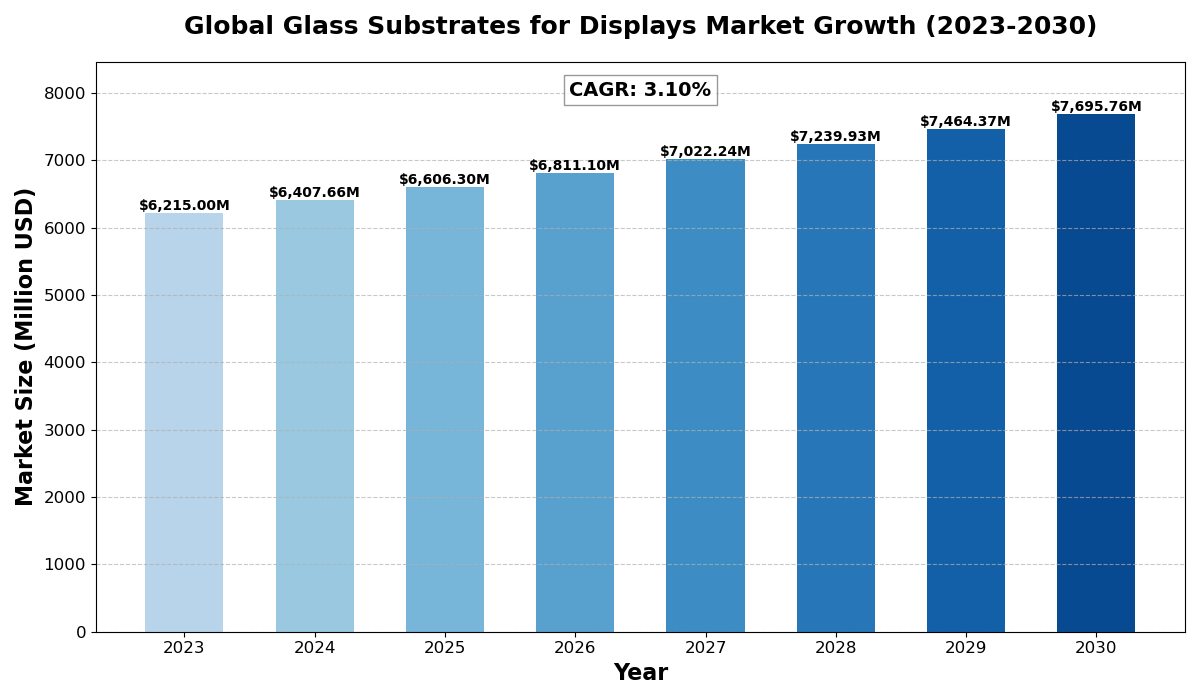
The global Glass Substrates for Displays market size was estimated at USD 6215 million in 2023 and is projected to reach USD 7695.76 million by 2030, exhibiting a CAGR of 3.10% during the forecast period.

North America Glass Substrates for Displays market size was USD 1619.45 million in 2023, at a CAGR of 2.66% during the forecast period of 2025 through 2030.

Glass Substrates for Displays Key Market Trends  :

  1. Growing Adoption of OLED Displays
    The shift from LCD to OLED technology is driving demand for advanced glass substrates due to their superior image quality, thinner profiles, and energy efficiency.

  2. Rising Demand for High-Resolution Displays
    Increasing consumer preference for ultra-HD, 4K, and 8K displays in televisions, smartphones, and tablets is fueling the need for high-quality glass substrates.

  3. Advancements in Flexible and Foldable Displays
    The development of bendable and foldable display panels in smartphones and wearables is pushing manufacturers to innovate ultra-thin and durable glass substrates.

  4. Increased Integration of Displays in Automobiles
    Automotive displays, including infotainment screens, heads-up displays (HUDs), and digital dashboards, are becoming standard, boosting the demand for high-performance display glass.

  5. Sustainability and Eco-Friendly Manufacturing
    Display manufacturers are focusing on energy-efficient production processes and recyclable glass materials to align with global environmental regulations and sustainability goals.

Glass Substrates for Displays Market Regional Analysis :

semi insight

  • North America:Strong demand driven by EVs, 5G infrastructure, and renewable energy, with the U.S. leading the market.
  • Europe:Growth fueled by automotive electrification, renewable energy, and strong regulatory support, with Germany as a key player.
  • Asia-Pacific:Dominates the market due to large-scale manufacturing in China and Japan, with growing demand from EVs, 5G, and semiconductors.
  • South America:Emerging market, driven by renewable energy and EV adoption, with Brazil leading growth.
  • Middle East & Africa:Gradual growth, mainly due to investments in renewable energy and EV infrastructure, with Saudi Arabia and UAE as key contributors.

Glass Substrates for Displays Market Segmentation

The research report includes specific segments by region (country), manufacturers, Type, and Application. Market segmentation creates subsets of a market based on product type, end-user or application, Geographic, and other factors. By understanding the market segments, the decision-maker can leverage this targeting in the product, sales, and marketing strategies. Market segments can power your product development cycles by informing how you create product offerings for different segments.

Key Company

  • Corning
  • Asahi Glass Co.
  • Ltd (AGC)
  • Nippon Electric Glass Co.
  • Ltd (NEG)

Market Segmentation (by Type)

  • LCD Display Type
  • LED Display Type
  • OLED Display Type

Market Segmentation (by Application)

  • Televisions
  • Personal Computers
  • Smart Phones
  • Tablet Devices
  • Cars
  • Others

Drivers

  • Expanding Consumer Electronics Industry
    The rising demand for smartphones, laptops, tablets, and televisions is driving the growth of the glass substrates market as displays remain a core component of these devices.

  • Technological Advancements in Display Panels
    Innovations in micro-LED and OLED technologies are increasing the need for high-quality glass substrates with better transparency, durability, and lightweight properties.

  • Growth in Smart Automotive Displays
    The automotive industry’s shift towards digital dashboards, HUDs, and in-car entertainment systems is creating new opportunities for glass substrate manufacturers.

Restraints

  • High Manufacturing Costs
    The production of high-precision glass substrates requires advanced manufacturing techniques, leading to higher costs that may limit adoption in cost-sensitive markets.

  • Supply Chain Disruptions
    Fluctuations in raw material availability and geopolitical factors can impact the production and supply of display glass substrates, affecting market growth.

  • Competition from Alternative Display Technologies
    Emerging display materials and technologies, such as quantum dot and micro-LED displays, could reduce dependence on traditional glass substrates.

Opportunities

  • Rising Demand for Smart Wearables
    The growth of smartwatches, augmented reality (AR), and virtual reality (VR) devices is opening new avenues for ultra-thin and durable glass substrates.

  • Expansion of 5G and IoT Devices
    The proliferation of 5G smartphones and IoT-connected devices is increasing the need for high-performance displays, driving the demand for glass substrates.

  • Innovations in Lightweight and Flexible Glass
    Continuous advancements in glass technology, such as ultra-thin, scratch-resistant, and bendable glass, are unlocking new possibilities in display applications.

Challenges

  • Strict Quality Standards and Manufacturing Complexities
    Producing defect-free, ultra-thin, and high-strength glass substrates requires advanced processing techniques, making production challenging and cost-intensive.

  • Environmental Regulations and Waste Management
    The glass manufacturing industry faces stringent regulations related to emissions, waste disposal, and energy consumption, which can impact production efficiency.

  • Intense Market Competition
    Established players and new entrants are competing to offer high-performance glass substrates, leading to pricing pressures and profit margin challenges.

Key Benefits of This Market Research:

  • Industry drivers, restraints, and opportunities covered in the study
  • Neutral perspective on the market performance
  • Recent industry trends and developments
  • Competitive landscape & strategies of key players
  • Potential & niche segments and regions exhibiting promising growth covered
  • Historical, current, and projected market size, in terms of value
  • In-depth analysis of the Glass Substrates for Displays Market
  • Overview of the regional outlook of the Glass Substrates for Displays Market:

Key Reasons to Buy this Report:

  • Access to date statistics compiled by our researchers. These provide you with historical and forecast data, which is analyzed to tell you why your market is set to change
  • This enables you to anticipate market changes to remain ahead of your competitors
  • You will be able to copy data from the Excel spreadsheet straight into your marketing plans, business presentations, or other strategic documents
  • The concise analysis, clear graph, and table format will enable you to pinpoint the information you require quickly
  • Provision of market value data for each segment and sub-segment
  • Indicates the region and segment that is expected to witness the fastest growth as well as to dominate the market
  • Provides insight into the market through Value Chain
  • Market dynamics scenario, along with growth opportunities of the market in the years to come
  • 6-month post-sales analyst support

Customization of the Report
In case of any queries or customization requirements, please connect with our sales team, who will ensure that your requirements are met.

FAQs

What are the key driving factors and opportunities in the Glass Substrates for Displays market?
The market is driven by the growing consumer electronics industry, advancements in display technology, and increased adoption of automotive displays. Opportunities exist in smart wearables, 5G-enabled devices, and innovations in flexible and lightweight glass.


Which region is projected to have the largest market share?
North America and Asia-Pacific are expected to lead, with Asia-Pacific dominating due to its strong consumer electronics manufacturing base, particularly in China, South Korea, and Japan.


Who are the top players in the global Glass Substrates for Displays market?
Major companies include Corning, Asahi Glass Co. Ltd (AGC), and Nippon Electric Glass Co. Ltd (NEG), which specialize in high-quality display glass substrates.


What are the latest technological advancements in the industry?
Recent innovations include ultra-thin flexible glass for foldable devices, micro-LED and OLED display advancements, and energy-efficient glass manufacturing techniques.


What is the current size of the global Glass Substrates for Displays market?
The market was valued at USD 6,215 million in 2023 and is projected to reach USD 7,695.76 million by 2030, growing at a CAGR of 3.10% during the forecast period.

Glass Substrates for Displays Market, Size, Trends, Business Strategies 2025-2032

Get Sample Report PDF for Exclusive Insights

Report Sample Includes

  • Table of Contents
  • List of Tables & Figures
  • Charts, Research Methodology, and more...
PDF Icon Download Sample Report PDF

Download Sample Report

Table of Content

Table of Contents
1 Research Methodology and Statistical Scope
1.1 Market Definition and Statistical Scope of Glass Substrates for Displays
1.2 Key Market Segments
1.2.1 Glass Substrates for Displays Segment by Type
1.2.2 Glass Substrates for Displays Segment by Application
1.3 Methodology & Sources of Information
1.3.1 Research Methodology
1.3.2 Research Process
1.3.3 Market Breakdown and Data Triangulation
1.3.4 Base Year
1.3.5 Report Assumptions & Caveats
2 Glass Substrates for Displays Market Overview
2.1 Global Market Overview
2.1.1 Global Glass Substrates for Displays Market Size (M USD) Estimates and Forecasts (2019-2030)
2.1.2 Global Glass Substrates for Displays Sales Estimates and Forecasts (2019-2030)
2.2 Market Segment Executive Summary
2.3 Global Market Size by Region
3 Glass Substrates for Displays Market Competitive Landscape
3.1 Global Glass Substrates for Displays Sales by Manufacturers (2019-2025)
3.2 Global Glass Substrates for Displays Revenue Market Share by Manufacturers (2019-2025)
3.3 Glass Substrates for Displays Market Share by Company Type (Tier 1, Tier 2, and Tier 3)
3.4 Global Glass Substrates for Displays Average Price by Manufacturers (2019-2025)
3.5 Manufacturers Glass Substrates for Displays Sales Sites, Area Served, Product Type
3.6 Glass Substrates for Displays Market Competitive Situation and Trends
3.6.1 Glass Substrates for Displays Market Concentration Rate
3.6.2 Global 5 and 10 Largest Glass Substrates for Displays Players Market Share by Revenue
3.6.3 Mergers & Acquisitions, Expansion
4 Glass Substrates for Displays Industry Chain Analysis
4.1 Glass Substrates for Displays Industry Chain Analysis
4.2 Market Overview of Key Raw Materials
4.3 Midstream Market Analysis
4.4 Downstream Customer Analysis
5 The Development and Dynamics of Glass Substrates for Displays Market
5.1 Key Development Trends
5.2 Driving Factors
5.3 Market Challenges
5.4 Market Restraints
5.5 Industry News
5.5.1 New Product Developments
5.5.2 Mergers & Acquisitions
5.5.3 Expansions
5.5.4 Collaboration/Supply Contracts
5.6 Industry Policies
6 Glass Substrates for Displays Market Segmentation by Type
6.1 Evaluation Matrix of Segment Market Development Potential (Type)
6.2 Global Glass Substrates for Displays Sales Market Share by Type (2019-2025)
6.3 Global Glass Substrates for Displays Market Size Market Share by Type (2019-2025)
6.4 Global Glass Substrates for Displays Price by Type (2019-2025)
7 Glass Substrates for Displays Market Segmentation by Application
7.1 Evaluation Matrix of Segment Market Development Potential (Application)
7.2 Global Glass Substrates for Displays Market Sales by Application (2019-2025)
7.3 Global Glass Substrates for Displays Market Size (M USD) by Application (2019-2025)
7.4 Global Glass Substrates for Displays Sales Growth Rate by Application (2019-2025)
8 Glass Substrates for Displays Market Segmentation by Region
8.1 Global Glass Substrates for Displays Sales by Region
8.1.1 Global Glass Substrates for Displays Sales by Region
8.1.2 Global Glass Substrates for Displays Sales Market Share by Region
8.2 North America
8.2.1 North America Glass Substrates for Displays Sales by Country
8.2.2 U.S.
8.2.3 Canada
8.2.4 Mexico
8.3 Europe
8.3.1 Europe Glass Substrates for Displays Sales by Country
8.3.2 Germany
8.3.3 France
8.3.4 U.K.
8.3.5 Italy
8.3.6 Russia
8.4 Asia Pacific
8.4.1 Asia Pacific Glass Substrates for Displays Sales by Region
8.4.2 China
8.4.3 Japan
8.4.4 South Korea
8.4.5 India
8.4.6 Southeast Asia
8.5 South America
8.5.1 South America Glass Substrates for Displays Sales by Country
8.5.2 Brazil
8.5.3 Argentina
8.5.4 Columbia
8.6 Middle East and Africa
8.6.1 Middle East and Africa Glass Substrates for Displays Sales by Region
8.6.2 Saudi Arabia
8.6.3 UAE
8.6.4 Egypt
8.6.5 Nigeria
8.6.6 South Africa
9 Key Companies Profile
9.1 Corning
9.1.1 Corning Glass Substrates for Displays Basic Information
9.1.2 Corning Glass Substrates for Displays Product Overview
9.1.3 Corning Glass Substrates for Displays Product Market Performance
9.1.4 Corning Business Overview
9.1.5 Corning Glass Substrates for Displays SWOT Analysis
9.1.6 Corning Recent Developments
9.2 Asahi Glass Co.
9.2.1 Asahi Glass Co. Glass Substrates for Displays Basic Information
9.2.2 Asahi Glass Co. Glass Substrates for Displays Product Overview
9.2.3 Asahi Glass Co. Glass Substrates for Displays Product Market Performance
9.2.4 Asahi Glass Co. Business Overview
9.2.5 Asahi Glass Co. Glass Substrates for Displays SWOT Analysis
9.2.6 Asahi Glass Co. Recent Developments
9.3 Ltd (AGC)
9.3.1 Ltd (AGC) Glass Substrates for Displays Basic Information
9.3.2 Ltd (AGC) Glass Substrates for Displays Product Overview
9.3.3 Ltd (AGC) Glass Substrates for Displays Product Market Performance
9.3.4 Ltd (AGC) Glass Substrates for Displays SWOT Analysis
9.3.5 Ltd (AGC) Business Overview
9.3.6 Ltd (AGC) Recent Developments
9.4 Nippon Electric Glass Co.
9.4.1 Nippon Electric Glass Co. Glass Substrates for Displays Basic Information
9.4.2 Nippon Electric Glass Co. Glass Substrates for Displays Product Overview
9.4.3 Nippon Electric Glass Co. Glass Substrates for Displays Product Market Performance
9.4.4 Nippon Electric Glass Co. Business Overview
9.4.5 Nippon Electric Glass Co. Recent Developments
9.5 Ltd (NEG)
9.5.1 Ltd (NEG) Glass Substrates for Displays Basic Information
9.5.2 Ltd (NEG) Glass Substrates for Displays Product Overview
9.5.3 Ltd (NEG) Glass Substrates for Displays Product Market Performance
9.5.4 Ltd (NEG) Business Overview
9.5.5 Ltd (NEG) Recent Developments
10 Glass Substrates for Displays Market Forecast by Region
10.1 Global Glass Substrates for Displays Market Size Forecast
10.2 Global Glass Substrates for Displays Market Forecast by Region
10.2.1 North America Market Size Forecast by Country
10.2.2 Europe Glass Substrates for Displays Market Size Forecast by Country
10.2.3 Asia Pacific Glass Substrates for Displays Market Size Forecast by Region
10.2.4 South America Glass Substrates for Displays Market Size Forecast by Country
10.2.5 Middle East and Africa Forecasted Consumption of Glass Substrates for Displays by Country
11 Forecast Market by Type and by Application (2025-2030)
11.1 Global Glass Substrates for Displays Market Forecast by Type (2025-2030)
11.1.1 Global Forecasted Sales of Glass Substrates for Displays by Type (2025-2030)
11.1.2 Global Glass Substrates for Displays Market Size Forecast by Type (2025-2030)
11.1.3 Global Forecasted Price of Glass Substrates for Displays by Type (2025-2030)
11.2 Global Glass Substrates for Displays Market Forecast by Application (2025-2030)
11.2.1 Global Glass Substrates for Displays Sales (K Units) Forecast by Application
11.2.2 Global Glass Substrates for Displays Market Size (M USD) Forecast by Application (2025-2030)
12 Conclusion and Key FindingsList of Tables
Table 1. Introduction of the Type
Table 2. Introduction of the Application
Table 3. Market Size (M USD) Segment Executive Summary
Table 4. Glass Substrates for Displays Market Size Comparison by Region (M USD)
Table 5. Global Glass Substrates for Displays Sales (K Units) by Manufacturers (2019-2025)
Table 6. Global Glass Substrates for Displays Sales Market Share by Manufacturers (2019-2025)
Table 7. Global Glass Substrates for Displays Revenue (M USD) by Manufacturers (2019-2025)
Table 8. Global Glass Substrates for Displays Revenue Share by Manufacturers (2019-2025)
Table 9. Company Type (Tier 1, Tier 2, and Tier 3) & (based on the Revenue in Glass Substrates for Displays as of 2022)
Table 10. Global Market Glass Substrates for Displays Average Price (USD/Unit) of Key Manufacturers (2019-2025)
Table 11. Manufacturers Glass Substrates for Displays Sales Sites and Area Served
Table 12. Manufacturers Glass Substrates for Displays Product Type
Table 13. Global Glass Substrates for Displays Manufacturers Market Concentration Ratio (CR5 and HHI)
Table 14. Mergers & Acquisitions, Expansion Plans
Table 15. Industry Chain Map of Glass Substrates for Displays
Table 16. Market Overview of Key Raw Materials
Table 17. Midstream Market Analysis
Table 18. Downstream Customer Analysis
Table 19. Key Development Trends
Table 20. Driving Factors
Table 21. Glass Substrates for Displays Market Challenges
Table 22. Global Glass Substrates for Displays Sales by Type (K Units)
Table 23. Global Glass Substrates for Displays Market Size by Type (M USD)
Table 24. Global Glass Substrates for Displays Sales (K Units) by Type (2019-2025)
Table 25. Global Glass Substrates for Displays Sales Market Share by Type (2019-2025)
Table 26. Global Glass Substrates for Displays Market Size (M USD) by Type (2019-2025)
Table 27. Global Glass Substrates for Displays Market Size Share by Type (2019-2025)
Table 28. Global Glass Substrates for Displays Price (USD/Unit) by Type (2019-2025)
Table 29. Global Glass Substrates for Displays Sales (K Units) by Application
Table 30. Global Glass Substrates for Displays Market Size by Application
Table 31. Global Glass Substrates for Displays Sales by Application (2019-2025) & (K Units)
Table 32. Global Glass Substrates for Displays Sales Market Share by Application (2019-2025)
Table 33. Global Glass Substrates for Displays Sales by Application (2019-2025) & (M USD)
Table 34. Global Glass Substrates for Displays Market Share by Application (2019-2025)
Table 35. Global Glass Substrates for Displays Sales Growth Rate by Application (2019-2025)
Table 36. Global Glass Substrates for Displays Sales by Region (2019-2025) & (K Units)
Table 37. Global Glass Substrates for Displays Sales Market Share by Region (2019-2025)
Table 38. North America Glass Substrates for Displays Sales by Country (2019-2025) & (K Units)
Table 39. Europe Glass Substrates for Displays Sales by Country (2019-2025) & (K Units)
Table 40. Asia Pacific Glass Substrates for Displays Sales by Region (2019-2025) & (K Units)
Table 41. South America Glass Substrates for Displays Sales by Country (2019-2025) & (K Units)
Table 42. Middle East and Africa Glass Substrates for Displays Sales by Region (2019-2025) & (K Units)
Table 43. Corning Glass Substrates for Displays Basic Information
Table 44. Corning Glass Substrates for Displays Product Overview
Table 45. Corning Glass Substrates for Displays Sales (K Units), Revenue (M USD), Price (USD/Unit) and Gross Margin (2019-2025)
Table 46. Corning Business Overview
Table 47. Corning Glass Substrates for Displays SWOT Analysis
Table 48. Corning Recent Developments
Table 49. Asahi Glass Co. Glass Substrates for Displays Basic Information
Table 50. Asahi Glass Co. Glass Substrates for Displays Product Overview
Table 51. Asahi Glass Co. Glass Substrates for Displays Sales (K Units), Revenue (M USD), Price (USD/Unit) and Gross Margin (2019-2025)
Table 52. Asahi Glass Co. Business Overview
Table 53. Asahi Glass Co. Glass Substrates for Displays SWOT Analysis
Table 54. Asahi Glass Co. Recent Developments
Table 55. Ltd (AGC) Glass Substrates for Displays Basic Information
Table 56. Ltd (AGC) Glass Substrates for Displays Product Overview
Table 57. Ltd (AGC) Glass Substrates for Displays Sales (K Units), Revenue (M USD), Price (USD/Unit) and Gross Margin (2019-2025)
Table 58. Ltd (AGC) Glass Substrates for Displays SWOT Analysis
Table 59. Ltd (AGC) Business Overview
Table 60. Ltd (AGC) Recent Developments
Table 61. Nippon Electric Glass Co. Glass Substrates for Displays Basic Information
Table 62. Nippon Electric Glass Co. Glass Substrates for Displays Product Overview
Table 63. Nippon Electric Glass Co. Glass Substrates for Displays Sales (K Units), Revenue (M USD), Price (USD/Unit) and Gross Margin (2019-2025)
Table 64. Nippon Electric Glass Co. Business Overview
Table 65. Nippon Electric Glass Co. Recent Developments
Table 66. Ltd (NEG) Glass Substrates for Displays Basic Information
Table 67. Ltd (NEG) Glass Substrates for Displays Product Overview
Table 68. Ltd (NEG) Glass Substrates for Displays Sales (K Units), Revenue (M USD), Price (USD/Unit) and Gross Margin (2019-2025)
Table 69. Ltd (NEG) Business Overview
Table 70. Ltd (NEG) Recent Developments
Table 71. Global Glass Substrates for Displays Sales Forecast by Region (2025-2030) & (K Units)
Table 72. Global Glass Substrates for Displays Market Size Forecast by Region (2025-2030) & (M USD)
Table 73. North America Glass Substrates for Displays Sales Forecast by Country (2025-2030) & (K Units)
Table 74. North America Glass Substrates for Displays Market Size Forecast by Country (2025-2030) & (M USD)
Table 75. Europe Glass Substrates for Displays Sales Forecast by Country (2025-2030) & (K Units)
Table 76. Europe Glass Substrates for Displays Market Size Forecast by Country (2025-2030) & (M USD)
Table 77. Asia Pacific Glass Substrates for Displays Sales Forecast by Region (2025-2030) & (K Units)
Table 78. Asia Pacific Glass Substrates for Displays Market Size Forecast by Region (2025-2030) & (M USD)
Table 79. South America Glass Substrates for Displays Sales Forecast by Country (2025-2030) & (K Units)
Table 80. South America Glass Substrates for Displays Market Size Forecast by Country (2025-2030) & (M USD)
Table 81. Middle East and Africa Glass Substrates for Displays Consumption Forecast by Country (2025-2030) & (Units)
Table 82. Middle East and Africa Glass Substrates for Displays Market Size Forecast by Country (2025-2030) & (M USD)
Table 83. Global Glass Substrates for Displays Sales Forecast by Type (2025-2030) & (K Units)
Table 84. Global Glass Substrates for Displays Market Size Forecast by Type (2025-2030) & (M USD)
Table 85. Global Glass Substrates for Displays Price Forecast by Type (2025-2030) & (USD/Unit)
Table 86. Global Glass Substrates for Displays Sales (K Units) Forecast by Application (2025-2030)
Table 87. Global Glass Substrates for Displays Market Size Forecast by Application (2025-2030) & (M USD)
List of Figures
Figure 1. Product Picture of Glass Substrates for Displays
Figure 2. Data Triangulation
Figure 3. Key Caveats
Figure 4. Global Glass Substrates for Displays Market Size (M USD), 2019-2030
Figure 5. Global Glass Substrates for Displays Market Size (M USD) (2019-2030)
Figure 6. Global Glass Substrates for Displays Sales (K Units) & (2019-2030)
Figure 7. Evaluation Matrix of Segment Market Development Potential (Type)
Figure 8. Evaluation Matrix of Segment Market Development Potential (Application)
Figure 9. Evaluation Matrix of Regional Market Development Potential
Figure 10. Glass Substrates for Displays Market Size by Country (M USD)
Figure 11. Glass Substrates for Displays Sales Share by Manufacturers in 2023
Figure 12. Global Glass Substrates for Displays Revenue Share by Manufacturers in 2023
Figure 13. Glass Substrates for Displays Market Share by Company Type (Tier 1, Tier 2 and Tier 3): 2023
Figure 14. Global Market Glass Substrates for Displays Average Price (USD/Unit) of Key Manufacturers in 2023
Figure 15. The Global 5 and 10 Largest Players: Market Share by Glass Substrates for Displays Revenue in 2023
Figure 16. Evaluation Matrix of Segment Market Development Potential (Type)
Figure 17. Global Glass Substrates for Displays Market Share by Type
Figure 18. Sales Market Share of Glass Substrates for Displays by Type (2019-2025)
Figure 19. Sales Market Share of Glass Substrates for Displays by Type in 2023
Figure 20. Market Size Share of Glass Substrates for Displays by Type (2019-2025)
Figure 21. Market Size Market Share of Glass Substrates for Displays by Type in 2023
Figure 22. Evaluation Matrix of Segment Market Development Potential (Application)
Figure 23. Global Glass Substrates for Displays Market Share by Application
Figure 24. Global Glass Substrates for Displays Sales Market Share by Application (2019-2025)
Figure 25. Global Glass Substrates for Displays Sales Market Share by Application in 2023
Figure 26. Global Glass Substrates for Displays Market Share by Application (2019-2025)
Figure 27. Global Glass Substrates for Displays Market Share by Application in 2023
Figure 28. Global Glass Substrates for Displays Sales Growth Rate by Application (2019-2025)
Figure 29. Global Glass Substrates for Displays Sales Market Share by Region (2019-2025)
Figure 30. North America Glass Substrates for Displays Sales and Growth Rate (2019-2025) & (K Units)
Figure 31. North America Glass Substrates for Displays Sales Market Share by Country in 2023
Figure 32. U.S. Glass Substrates for Displays Sales and Growth Rate (2019-2025) & (K Units)
Figure 33. Canada Glass Substrates for Displays Sales (K Units) and Growth Rate (2019-2025)
Figure 34. Mexico Glass Substrates for Displays Sales (Units) and Growth Rate (2019-2025)
Figure 35. Europe Glass Substrates for Displays Sales and Growth Rate (2019-2025) & (K Units)
Figure 36. Europe Glass Substrates for Displays Sales Market Share by Country in 2023
Figure 37. Germany Glass Substrates for Displays Sales and Growth Rate (2019-2025) & (K Units)
Figure 38. France Glass Substrates for Displays Sales and Growth Rate (2019-2025) & (K Units)
Figure 39. U.K. Glass Substrates for Displays Sales and Growth Rate (2019-2025) & (K Units)
Figure 40. Italy Glass Substrates for Displays Sales and Growth Rate (2019-2025) & (K Units)
Figure 41. Russia Glass Substrates for Displays Sales and Growth Rate (2019-2025) & (K Units)
Figure 42. Asia Pacific Glass Substrates for Displays Sales and Growth Rate (K Units)
Figure 43. Asia Pacific Glass Substrates for Displays Sales Market Share by Region in 2023
Figure 44. China Glass Substrates for Displays Sales and Growth Rate (2019-2025) & (K Units)
Figure 45. Japan Glass Substrates for Displays Sales and Growth Rate (2019-2025) & (K Units)
Figure 46. South Korea Glass Substrates for Displays Sales and Growth Rate (2019-2025) & (K Units)
Figure 47. India Glass Substrates for Displays Sales and Growth Rate (2019-2025) & (K Units)
Figure 48. Southeast Asia Glass Substrates for Displays Sales and Growth Rate (2019-2025) & (K Units)
Figure 49. South America Glass Substrates for Displays Sales and Growth Rate (K Units)
Figure 50. South America Glass Substrates for Displays Sales Market Share by Country in 2023
Figure 51. Brazil Glass Substrates for Displays Sales and Growth Rate (2019-2025) & (K Units)
Figure 52. Argentina Glass Substrates for Displays Sales and Growth Rate (2019-2025) & (K Units)
Figure 53. Columbia Glass Substrates for Displays Sales and Growth Rate (2019-2025) & (K Units)
Figure 54. Middle East and Africa Glass Substrates for Displays Sales and Growth Rate (K Units)
Figure 55. Middle East and Africa Glass Substrates for Displays Sales Market Share by Region in 2023
Figure 56. Saudi Arabia Glass Substrates for Displays Sales and Growth Rate (2019-2025) & (K Units)
Figure 57. UAE Glass Substrates for Displays Sales and Growth Rate (2019-2025) & (K Units)
Figure 58. Egypt Glass Substrates for Displays Sales and Growth Rate (2019-2025) & (K Units)
Figure 59. Nigeria Glass Substrates for Displays Sales and Growth Rate (2019-2025) & (K Units)
Figure 60. South Africa Glass Substrates for Displays Sales and Growth Rate (2019-2025) & (K Units)
Figure 61. Global Glass Substrates for Displays Sales Forecast by Volume (2019-2030) & (K Units)
Figure 62. Global Glass Substrates for Displays Market Size Forecast by Value (2019-2030) & (M USD)
Figure 63. Global Glass Substrates for Displays Sales Market Share Forecast by Type (2025-2030)
Figure 64. Global Glass Substrates for Displays Market Share Forecast by Type (2025-2030)
Figure 65. Global Glass Substrates for Displays Sales Forecast by Application (2025-2030)
Figure 66. Global Glass Substrates for Displays Market Share Forecast by Application (2025-2030)