Game Camera Market, Global Business Strategies 2026-2033

Camera Market was valued at USD 43 million in 2025. The market is projected to grow from USD 44.5 million in 2026 to USD 50.9 million by 2033, exhibiting a CAGR of 2.5% during the forecast period.

PDF Icon Download Sample Report PDF
  • Quick Dispatch

    All Orders

  • Secure Payment

    100% Secure Payment

Price range: $1,500.00 through $4,250.00

Clear

Market Insights

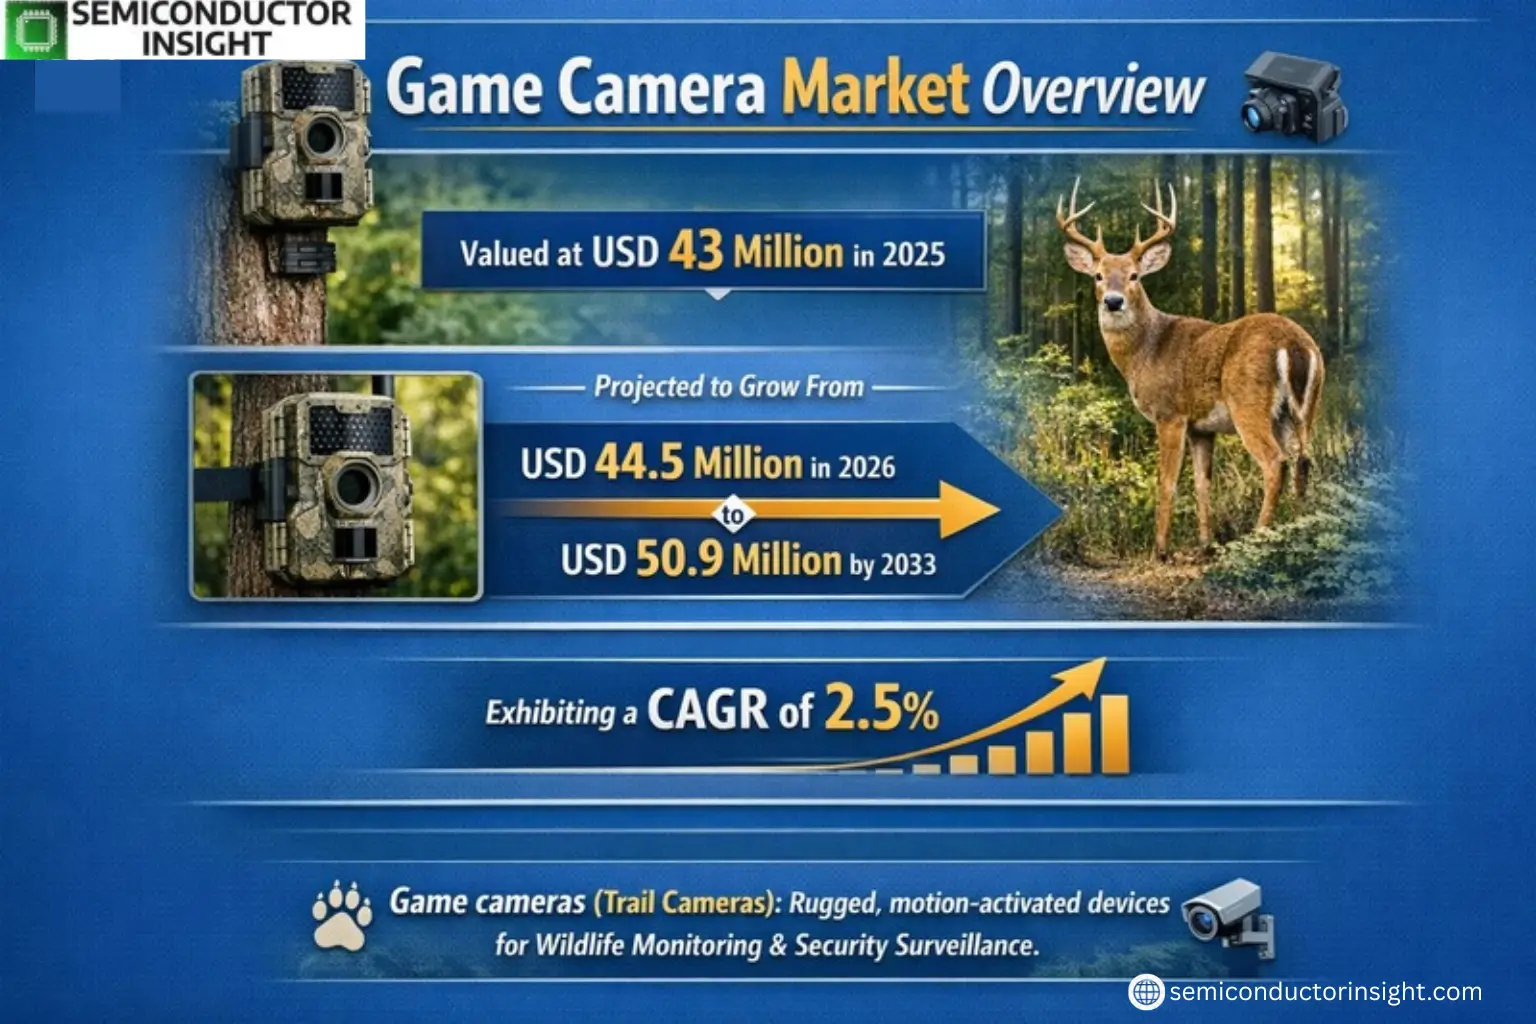
Global Game Camera Market was valued at USD 43 million in 2025. The market is projected to grow from USD 44.5 million in 2026 to USD 50.9 million by 2033, exhibiting a CAGR of 2.5% during the forecast period.

Game cameras, also known as trail cameras, are rugged, motion-activated devices designed for wildlife monitoring and security surveillance. These cameras integrate a passive infrared (PIR) motion sensor with a digital imaging system to capture photos or videos when movement is detected. Key applications include hunting, ecological research, and property security.

The market growth is driven by increasing adoption in wildlife conservation programs and rising demand from hunting enthusiasts. Technological advancements such as higher resolution sensors (8-12MP models dominate with over 55% market share) and cellular connectivity are accelerating adoption. North America leads global demand with over 70% market share due to high hunting participation rates, followed by Europe and Japan with combined shares of approximately 20%. Prominent manufacturers like Prometheus Group and Vista Outdoor collectively hold more than half of the global market.

Xyz market size & forecast

MARKET DRIVERS

Growing Demand for Wildlife Monitoring and Hunting Applications

Game Camera Market is experiencing robust growth due to increasing demand from wildlife researchers, conservationists, and hunting enthusiasts. Modern game cameras offer advanced features like high-resolution imaging, night vision, and motion detection, making them indispensable tools for field observation. Global market is projected to grow at approximately 7% annually as adoption increases across multiple user segments.

Technological Advancements in Camera Systems

Innovations such as 4K video recording, cellular connectivity, and artificial intelligence-based animal recognition are driving product upgrades. Manufacturers are focusing on longer battery life and improved durability to meet the demands of harsh outdoor environments. Cellular-enabled game cameras, which allow remote monitoring, now account for over 25% of total sales.

Consumer preference is shifting towards cameras with real-time data transmission capabilities, creating new revenue streams for manufacturers through subscription-based cloud services.

MARKET CHALLENGES

High Cost of Advanced Game Camera Systems

Premium game cameras with cellular connectivity and AI features command prices 2-3 times higher than basic models, limiting adoption among price-sensitive consumers. Market penetration in developing regions remains below 15% due to this price barrier and lack of supporting infrastructure for cellular models.

Other Challenges

Battery Life and Durability Concerns
Extended field deployment requires frequent battery replacements, with 60% of users reporting operational challenges in extreme weather conditions. Manufacturers face engineering challenges in balancing power consumption with feature-rich offerings.

MARKET RESTRAINTS

Regulatory Limitations on Wildlife Monitoring

Several regions enforce strict regulations on wildlife photography and trail camera usage in protected areas, affecting market growth. In North America, 12 states have implemented seasonal restrictions on game camera deployment during hunting periods. These legal frameworks create operational complexities for both recreational and professional users.

MARKET OPPORTUNITIES

Expansion in Agricultural and Security Applications

Farmers are increasingly adopting game cameras for crop protection and livestock monitoring, representing a USD 220 million untapped market segment. Similarly, security applications in remote properties are growing at 9% annually. Manufacturers developing hybrid wildlife/security camera systems are well-positioned to capitalize on this convergence.

Emerging Markets in Asia-Pacific Region

The Asia-Pacific Game Camera Market is forecasted to grow at 11% CAGR due to increasing conservation efforts and rising disposable income. Countries like India and Australia are implementing large-scale wildlife tracking projects utilizing advanced camera trap networks.
Game Camera Market Trends

Steady Market Growth Driven by Technological Advancements

Global Game Camera market is projected to grow from USD 43 million in 2025 to USD 50.9 million by 2033 at a CAGR of 2.5%. This growth is fueled by continuous improvements in camera resolution, battery life, and wireless connectivity. Manufacturers are increasingly integrating cellular and satellite transmission capabilities into game cameras, creating new opportunities for remote wildlife monitoring and security applications.

Other Trends

Market Dominance of 8-12MP Cameras

8-12MP resolution game cameras currently command over 55% market share, as this range provides the optimal balance between image quality and storage efficiency. Higher resolution models above 12MP are gaining traction but face challenges related to larger file sizes and battery consumption in field applications.

North America Leads Global Game Camera Adoption

With over 70% market share, North America remains the largest market for game cameras, primarily due to strong hunting culture and wildlife research activities. Europe and Japan collectively account for about 20% of the market, with growing interest in conservation applications driving adoption in these regions.

Consolidated Competitive Landscape

The top five manufacturers control more than 55% of the global Game Camera market, with Prometheus Group, Vista Outdoor, and Wildgame Innovations leading the industry. These companies are investing heavily in product innovation and distribution networks to maintain their competitive positions.

Hunting Applications Drive Majority of Sales

Hunting remains the primary application for game cameras, followed by research purposes. The hunting segment benefits from increasing regulations requiring ethical hunting practices, while research applications are expanding due to growing wildlife conservation efforts worldwide.

COMPETITIVE LANDSCAPE

Key Industry Players

Consolidated Market Leadership with Focus on Technological Innovation

Global Game Camera Market is dominated by five key players holding over 55% market share, led by Prometheus Group and Vista Outdoor. These industry leaders focus on advanced PIR sensors, high-resolution imaging (8-12MP segment holds 55% share), and ruggedized designs for harsh outdoor environments. North America commands 70% market share, with product development closely tied to hunting applications which represent the largest end-use segment.

Niche players like Reconyx and Spypoint differentiate through specialized features such as cellular connectivity and rapid trigger speeds. Emerging Asian manufacturers including Bolymedia are gaining traction by offering cost-competitive alternatives while European firms focus on research-grade equipment with enhanced data collection capabilities.

List of Key Game Camera Companies Profiled

Segment Analysis:

Segment Category Sub-Segments Key Insights
By Type
  • Below 8MP
  • 8-12MP
  • Over 12MP
8-12MP Cameras dominate the market due to their optimal balance between image quality and cost-effectiveness:

  • Preferred by both recreational hunters and professional researchers for clear wildlife documentation
  • Offers sufficient resolution for detailed animal identification without excessive file sizes
  • Manufacturers are focusing R&D efforts on this segment to enhance night vision and motion sensing
By Application
  • Hunting
  • Research
  • Entertainment
  • Others
Hunting Applications drive the largest demand for game cameras:

  • Essential tool for scouting game patterns and strategic hunting location selection
  • Increasing adoption by recreational hunters is expanding the consumer base
  • Specialized features like silent operation and camouflage designs are being developed for this segment
  • Research applications show growing potential for wildlife conservation and ecological studies
By End User
  • Individual Consumers
  • Research Institutions
  • Wildlife Conservation Organizations
Individual Consumers represent the core market for game cameras:

  • Hunting enthusiasts and nature photographers are driving product innovation and adoption
  • Growing interest in backyard wildlife monitoring is expanding the consumer base
  • Research institutions require more rugged and advanced features for field studies
  • Conservation groups are adopting specialized models for endangered species monitoring
By Technology
  • Basic Trail Cameras
  • Cellular-enabled Cameras
  • Wireless Network Cameras
Cellular-enabled Cameras are witnessing rapid adoption:

  • Real-time image transmission capability eliminates frequent field checks
  • Increasing network coverage is making this technology more accessible
  • Premium pricing structure creates higher margins for manufacturers
  • Professional users value the immediacy of data collection and security applications
By Distribution Channel
  • Specialty Outdoor Stores
  • Online Retailers
  • Big Box Retailers
Online Retail Channels are transforming market dynamics:

  • Convenient comparison shopping drives price transparency and competitive pricing
  • Direct-to-consumer models allow manufacturers better control over brand presentation
  • Specialty stores remain important for expert advice and hands-on demonstrations
  • Big box retailers are expanding assortments to capture casual users

Regional Analysis: Global Game Camera Market

North America

The North American Game Camera Market continues to dominate globally due to high adoption rates among hunting enthusiasts and wildlife researchers. Advanced thermal imaging technology and cellular-enabled cameras are driving premium product demand across the U.S. and Canada. Strict wildlife conservation regulations coupled with growing interest in trail monitoring have created sustained market growth. Major manufacturers are strategically expanding distribution networks, with specialty outdoor retailers maintaining strong footholds in rural markets. The region also benefits from early adoption of AI-powered animal recognition features, with tech-savvy consumers willing to pay premium prices for smart connectivity and cloud storage capabilities in hunting cameras.

Premium Product Adoption
North American consumers show strong preference for high-end game cameras, with over 60% market revenue coming from cellular and multi-sensor models. The willingness to invest in advanced features creates higher profit margins.
Distribution Channels
Specialty outdoor retailers dominate physical sales while e-commerce platforms are gaining traction for replacement purchases. Manufacturers maintain strong partnerships with hunting equipment distributors across the region.
Technology Integration
Integration with hunting apps and mapping software creates product stickiness. Bluetooth and WiFi connectivity have become standard expectations rather than premium features in the North American market.
Seasonal Demand Patterns
Pre-hunting season purchases account for nearly 40% of annual sales. Southern states show more consistent year-round demand due to varied hunting seasons, while northern markets are highly seasonal.

Europe
The European Game Camera Market is characterized by strong environmental monitoring applications alongside recreational use. Germany and Scandinavia lead adoption due to advanced forestry management programs requiring wildlife tracking. EU regulations on battery types and data privacy influence product designs, with manufacturers offering specialized compliance features. The market shows preference for rugged, weather-resistant cameras able to withstand harsh Nordic winters. Unlike North America, cellular models have slower adoption due to rural network limitations, keeping focus on high-capacity SD card variants.

Asia-Pacific
Asia-Pacific emerges as the fastest growing Game Camera Market, driven by expanding wildlife tourism in India and anti-poaching initiatives across Southeast Asia. Chinese manufacturers dominate production while Japanese companies lead in advanced sensor technology. Australia’s unique wildlife monitoring needs fuel demand for specialized drought-resistant models. Price sensitivity remains high across developing markets, creating opportunities for budget product lines alongside premium offerings in urban centers.

South America
Brazil and Argentina represent key growth markets for game cameras in South America, fueled by expanding hunting tourism infrastructure. Anti-theft features see high demand due to poaching concerns in protected areas. The Amazon basin’s research institutions drive purchases of specialized humidity-resistant cameras. Limited local manufacturing keeps the region import-dependent, with North American brands commanding premium positioning.

Middle East & Africa
The Middle East shows niche demand from falconry enthusiasts and desert wildlife researchers. South Africa dominates the African market through conservation projects in game reserves. Market growth is constrained by import restrictions in some countries, creating opportunities for local assembly operations. Extreme temperature endurance is critical product requirement across the region.

Report Scope

This market research report provides a comprehensive analysis of the Game Camera Market, covering the forecast period 2026–2033. It offers detailed insights into market dynamics, technological advancements, competitive landscape, and key trends shaping the industry.

Key focus areas of the report include:

  • Market Overview: The report begins with an overview outlining its current market scenario, key growth indicators, and industry transformation drivers. It discusses macroeconomic factors, demand–supply balance, regulatory landscape, and the strategic role of game cameras in wildlife monitoring and security applications.
  • Market Size & Forecast: Historical data and future projections for revenue, unit shipments, and market value across major regions and segments.
  • Segmentation Analysis: Detailed breakdown by product type, resolution, application, and end-user industry to identify high-growth segments and investment opportunities.
  • Regional Insights: Insights into market performance across North America, Europe, Asia, Latin America, and the Middle East & Africa, including country-level analysis where relevant.
  • Competitive Landscape: Profiles of leading market participants, including their product offerings, R&D focus, manufacturing capacity, pricing strategies, and recent developments such as mergers, acquisitions, and partnerships.
  • Technology Trends & Innovation: Assessment of emerging technologies, integration of AI/IoT in game cameras, and evolving industry standards.
  • Market Drivers & Restraints: Evaluation of factors driving market growth along with challenges, supply chain constraints, regulatory issues, and market-entry barriers.
  • Stakeholder Insights: Insights for component suppliers, OEMs, system integrators, investors, and policymakers regarding the evolving ecosystem and strategic opportunities.

Primary and secondary research methods are employed, including interviews with industry experts, data from verified sources, and real-time market intelligence to ensure the accuracy and reliability of the insights presented.

FREQUENTLY ASKED QUESTIONS:

What is the current market size of Game Camera Market?

-> Game Camera Market was valued at USD 43 million in 2025. The market is projected to grow from USD 44.5 million in 2026 to USD 50.9 million by 2033, exhibiting a CAGR of 2.5% during the forecast period.

What is the growth rate (CAGR) of Game Camera Market?

-> The market is expected to grow at a CAGR of 2.5% during the forecast period 2025-2033.

Which key companies operate in Game Camera Market?

-> Key players include Prometheus Group, Vista Outdoor, Wildgame Innovations, Bgha Inc., Moultrie, Reconyx, Spypoint, Cuddeback, GSM Outdoors, and Bolymedia. Global top five manufacturers hold a share over 55%.

Which region leads the Game Camera Market?

-> North America is the largest market with over 70% share, followed by Europe and Japan with about 20% combined share.

What are the key product segments in Game Camera Market?

-> 8-12MP cameras dominate the market with over 55% share, followed by Below 8MP and Over 12MP segments.

What are the major applications of Game Cameras?

-> Hunting is the largest application, followed by Research, Entertainment, and Others.

Game Camera Market, Global Business Strategies 2026-2033

Get Sample Report PDF for Exclusive Insights

Report Sample Includes

  • Table of Contents
  • List of Tables & Figures
  • Charts, Research Methodology, and more...
PDF Icon Download Sample Report PDF

Download Sample Report

Table of Content

1 Introduction to Research & Analysis Reports
1.1 Game Camera Market Definition
1.2 Market Segments
1.2.1 Segment by Type
1.2.2 Segment by Application
1.3 Global Game Camera Market Overview
1.4 Features & Benefits of This Report
1.5 Methodology & Sources of Information
1.5.1 Research Methodology
1.5.2 Research Process
1.5.3 Base Year
1.5.4 Report Assumptions & Caveats
2 Global Game Camera Overall Market Size
2.1 Global Game Camera Market Size: 2024 VS 2032
2.2 Global Game Camera Market Size, Prospects & Forecasts: 2020-2032
2.3 Global Game Camera Sales: 2020-2032
3 Company Landscape
3.1 Top Game Camera Players in Global Market
3.2 Top Global Game Camera Companies Ranked by Revenue
3.3 Global Game Camera Revenue by Companies
3.4 Global Game Camera Sales by Companies
3.5 Global Game Camera Price by Manufacturer (2020-2025)
3.6 Top 3 and Top 5 Game Camera Companies in Global Market, by Revenue in 2024
3.7 Global Manufacturers Game Camera Product Type
3.8 Tier 1, Tier 2, and Tier 3 Game Camera Players in Global Market
3.8.1 List of Global Tier 1 Game Camera Companies
3.8.2 List of Global Tier 2 and Tier 3 Game Camera Companies
4 Sights by Product
4.1 Overview
4.1.1 Segment by Type – Global Game Camera Market Size Markets, 2024 & 2032
4.1.2 Below 8MP
4.1.3 8-12MP
4.1.4 Over 12MP
4.2 Segment by Type – Global Game Camera Revenue & Forecasts
4.2.1 Segment by Type – Global Game Camera Revenue, 2020-2025
4.2.2 Segment by Type – Global Game Camera Revenue, 2026-2032
4.2.3 Segment by Type – Global Game Camera Revenue Market Share, 2020-2032
4.3 Segment by Type – Global Game Camera Sales & Forecasts
4.3.1 Segment by Type – Global Game Camera Sales, 2020-2025
4.3.2 Segment by Type – Global Game Camera Sales, 2026-2032
4.3.3 Segment by Type – Global Game Camera Sales Market Share, 2020-2032
4.4 Segment by Type – Global Game Camera Price (Manufacturers Selling Prices), 2020-2032
5 Sights by Application
5.1 Overview
5.1.1 Segment by Application – Global Game Camera Market Size, 2024 & 2032
5.1.2 Entertainment
5.1.3 Hunting
5.1.4 Research
5.1.5 Others
5.2 Segment by Application – Global Game Camera Revenue & Forecasts
5.2.1 Segment by Application – Global Game Camera Revenue, 2020-2025
5.2.2 Segment by Application – Global Game Camera Revenue, 2026-2032
5.2.3 Segment by Application – Global Game Camera Revenue Market Share, 2020-2032
5.3 Segment by Application – Global Game Camera Sales & Forecasts
5.3.1 Segment by Application – Global Game Camera Sales, 2020-2025
5.3.2 Segment by Application – Global Game Camera Sales, 2026-2032
5.3.3 Segment by Application – Global Game Camera Sales Market Share, 2020-2032
5.4 Segment by Application – Global Game Camera Price (Manufacturers Selling Prices), 2020-2032
6 Sights by Region
6.1 By Region – Global Game Camera Market Size, 2024 & 2032
6.2 By Region – Global Game Camera Revenue & Forecasts
6.2.1 By Region – Global Game Camera Revenue, 2020-2025
6.2.2 By Region – Global Game Camera Revenue, 2026-2032
6.2.3 By Region – Global Game Camera Revenue Market Share, 2020-2032
6.3 By Region – Global Game Camera Sales & Forecasts
6.3.1 By Region – Global Game Camera Sales, 2020-2025
6.3.2 By Region – Global Game Camera Sales, 2026-2032
6.3.3 By Region – Global Game Camera Sales Market Share, 2020-2032
6.4 North America
6.4.1 By Country – North America Game Camera Revenue, 2020-2032
6.4.2 By Country – North America Game Camera Sales, 2020-2032
6.4.3 United States Game Camera Market Size, 2020-2032
6.4.4 Canada Game Camera Market Size, 2020-2032
6.4.5 Mexico Game Camera Market Size, 2020-2032
6.5 Europe
6.5.1 By Country – Europe Game Camera Revenue, 2020-2032
6.5.2 By Country – Europe Game Camera Sales, 2020-2032
6.5.3 Germany Game Camera Market Size, 2020-2032
6.5.4 France Game Camera Market Size, 2020-2032
6.5.5 U.K. Game Camera Market Size, 2020-2032
6.5.6 Italy Game Camera Market Size, 2020-2032
6.5.7 Russia Game Camera Market Size, 2020-2032
6.5.8 Nordic Countries Game Camera Market Size, 2020-2032
6.5.9 Benelux Game Camera Market Size, 2020-2032
6.6 Asia
6.6.1 By Region – Asia Game Camera Revenue, 2020-2032
6.6.2 By Region – Asia Game Camera Sales, 2020-2032
6.6.3 China Game Camera Market Size, 2020-2032
6.6.4 Japan Game Camera Market Size, 2020-2032
6.6.5 South Korea Game Camera Market Size, 2020-2032
6.6.6 Southeast Asia Game Camera Market Size, 2020-2032
6.6.7 India Game Camera Market Size, 2020-2032
6.7 South America
6.7.1 By Country – South America Game Camera Revenue, 2020-2032
6.7.2 By Country – South America Game Camera Sales, 2020-2032
6.7.3 Brazil Game Camera Market Size, 2020-2032
6.7.4 Argentina Game Camera Market Size, 2020-2032
6.8 Middle East & Africa
6.8.1 By Country – Middle East & Africa Game Camera Revenue, 2020-2032
6.8.2 By Country – Middle East & Africa Game Camera Sales, 2020-2032
6.8.3 Turkey Game Camera Market Size, 2020-2032
6.8.4 Israel Game Camera Market Size, 2020-2032
6.8.5 Saudi Arabia Game Camera Market Size, 2020-2032
6.8.6 UAE Game Camera Market Size, 2020-2032
7 Manufacturers & Brands Profiles
7.1 Prometheus Group
7.1.1 Prometheus Group Company Summary
7.1.2 Prometheus Group Business Overview
7.1.3 Prometheus Group Game Camera Major Product Offerings
7.1.4 Prometheus Group Game Camera Sales and Revenue in Global (2020-2025)
7.1.5 Prometheus Group Key News & Latest Developments
7.2 Vista Outdoor
7.2.1 Vista Outdoor Company Summary
7.2.2 Vista Outdoor Business Overview
7.2.3 Vista Outdoor Game Camera Major Product Offerings
7.2.4 Vista Outdoor Game Camera Sales and Revenue in Global (2020-2025)
7.2.5 Vista Outdoor Key News & Latest Developments
7.3 Wildgame Innovations
7.3.1 Wildgame Innovations Company Summary
7.3.2 Wildgame Innovations Business Overview
7.3.3 Wildgame Innovations Game Camera Major Product Offerings
7.3.4 Wildgame Innovations Game Camera Sales and Revenue in Global (2020-2025)
7.3.5 Wildgame Innovations Key News & Latest Developments
7.4 Bgha Inc.
7.4.1 Bgha Inc. Company Summary
7.4.2 Bgha Inc. Business Overview
7.4.3 Bgha Inc. Game Camera Major Product Offerings
7.4.4 Bgha Inc. Game Camera Sales and Revenue in Global (2020-2025)
7.4.5 Bgha Inc. Key News & Latest Developments
7.5 Moultrie
7.5.1 Moultrie Company Summary
7.5.2 Moultrie Business Overview
7.5.3 Moultrie Game Camera Major Product Offerings
7.5.4 Moultrie Game Camera Sales and Revenue in Global (2020-2025)
7.5.5 Moultrie Key News & Latest Developments
7.6 Reconyx
7.6.1 Reconyx Company Summary
7.6.2 Reconyx Business Overview
7.6.3 Reconyx Game Camera Major Product Offerings
7.6.4 Reconyx Game Camera Sales and Revenue in Global (2020-2025)
7.6.5 Reconyx Key News & Latest Developments
7.7 Spypoint
7.7.1 Spypoint Company Summary
7.7.2 Spypoint Business Overview
7.7.3 Spypoint Game Camera Major Product Offerings
7.7.4 Spypoint Game Camera Sales and Revenue in Global (2020-2025)
7.7.5 Spypoint Key News & Latest Developments
7.8 Cuddeback
7.8.1 Cuddeback Company Summary
7.8.2 Cuddeback Business Overview
7.8.3 Cuddeback Game Camera Major Product Offerings
7.8.4 Cuddeback Game Camera Sales and Revenue in Global (2020-2025)
7.8.5 Cuddeback Key News & Latest Developments
7.9 GSM Outdoors
7.9.1 GSM Outdoors Company Summary
7.9.2 GSM Outdoors Business Overview
7.9.3 GSM Outdoors Game Camera Major Product Offerings
7.9.4 GSM Outdoors Game Camera Sales and Revenue in Global (2020-2025)
7.9.5 GSM Outdoors Key News & Latest Developments
7.10 Bolymedia
7.10.1 Bolymedia Company Summary
7.10.2 Bolymedia Business Overview
7.10.3 Bolymedia Game Camera Major Product Offerings
7.10.4 Bolymedia Game Camera Sales and Revenue in Global (2020-2025)
7.10.5 Bolymedia Key News & Latest Developments
8 Global Game Camera Production Capacity, Analysis
8.1 Global Game Camera Production Capacity, 2020-2032
8.2 Game Camera Production Capacity of Key Manufacturers in Global Market
8.3 Global Game Camera Production by Region
9 Key Market Trends, Opportunity, Drivers and Restraints
9.1 Market Opportunities & Trends
9.2 Market Drivers
9.3 Market Restraints
10 Game Camera Supply Chain Analysis
10.1 Game Camera Industry Value Chain
10.2 Game Camera Upstream Market
10.3 Game Camera Downstream and Clients
10.4 Marketing Channels Analysis
10.4.1 Marketing Channels
10.4.2 Game Camera Distributors and Sales Agents in Global
11 Conclusion
12 Appendix
12.1 Note
12.2 Examples of Clients
12.3 DisclaimerList of Tables
Table 1. Key Players of Game Camera in Global Market
Table 2. Top Game Camera Players in Global Market, Ranking by Revenue (2024)
Table 3. Global Game Camera Revenue by Companies, (US$, Mn), 2020-2025
Table 4. Global Game Camera Revenue Share by Companies, 2020-2025
Table 5. Global Game Camera Sales by Companies, (K Units), 2020-2025
Table 6. Global Game Camera Sales Share by Companies, 2020-2025
Table 7. Key Manufacturers Game Camera Price (2020-2025) & (USD/Unit)
Table 8. Global Manufacturers Game Camera Product Type
Table 9. List of Global Tier 1 Game Camera Companies, Revenue (US$, Mn) in 2024 and Market Share
Table 10. List of Global Tier 2 and Tier 3 Game Camera Companies, Revenue (US$, Mn) in 2024 and Market Share
Table 11. Segment by Type – Global Game Camera Revenue, (US$, Mn), 2024 & 2032
Table 12. Segment by Type – Global Game Camera Revenue (US$, Mn), 2020-2025
Table 13. Segment by Type – Global Game Camera Revenue (US$, Mn), 2026-2032
Table 14. Segment by Type – Global Game Camera Sales (K Units), 2020-2025
Table 15. Segment by Type – Global Game Camera Sales (K Units), 2026-2032
Table 16. Segment by Application – Global Game Camera Revenue, (US$, Mn), 2024 & 2032
Table 17. Segment by Application – Global Game Camera Revenue, (US$, Mn), 2020-2025
Table 18. Segment by Application – Global Game Camera Revenue, (US$, Mn), 2026-2032
Table 19. Segment by Application – Global Game Camera Sales, (K Units), 2020-2025
Table 20. Segment by Application – Global Game Camera Sales, (K Units), 2026-2032
Table 21. By Region – Global Game Camera Revenue, (US$, Mn), 2025-2032
Table 22. By Region – Global Game Camera Revenue, (US$, Mn), 2020-2025
Table 23. By Region – Global Game Camera Revenue, (US$, Mn), 2026-2032
Table 24. By Region – Global Game Camera Sales, (K Units), 2020-2025
Table 25. By Region – Global Game Camera Sales, (K Units), 2026-2032
Table 26. By Country – North America Game Camera Revenue, (US$, Mn), 2020-2025
Table 27. By Country – North America Game Camera Revenue, (US$, Mn), 2026-2032
Table 28. By Country – North America Game Camera Sales, (K Units), 2020-2025
Table 29. By Country – North America Game Camera Sales, (K Units), 2026-2032
Table 30. By Country – Europe Game Camera Revenue, (US$, Mn), 2020-2025
Table 31. By Country – Europe Game Camera Revenue, (US$, Mn), 2026-2032
Table 32. By Country – Europe Game Camera Sales, (K Units), 2020-2025
Table 33. By Country – Europe Game Camera Sales, (K Units), 2026-2032
Table 34. By Region – Asia Game Camera Revenue, (US$, Mn), 2020-2025
Table 35. By Region – Asia Game Camera Revenue, (US$, Mn), 2026-2032
Table 36. By Region – Asia Game Camera Sales, (K Units), 2020-2025
Table 37. By Region – Asia Game Camera Sales, (K Units), 2026-2032
Table 38. By Country – South America Game Camera Revenue, (US$, Mn), 2020-2025
Table 39. By Country – South America Game Camera Revenue, (US$, Mn), 2026-2032
Table 40. By Country – South America Game Camera Sales, (K Units), 2020-2025
Table 41. By Country – South America Game Camera Sales, (K Units), 2026-2032
Table 42. By Country – Middle East & Africa Game Camera Revenue, (US$, Mn), 2020-2025
Table 43. By Country – Middle East & Africa Game Camera Revenue, (US$, Mn), 2026-2032
Table 44. By Country – Middle East & Africa Game Camera Sales, (K Units), 2020-2025
Table 45. By Country – Middle East & Africa Game Camera Sales, (K Units), 2026-2032
Table 46. Prometheus Group Company Summary
Table 47. Prometheus Group Game Camera Product Offerings
Table 48. Prometheus Group Game Camera Sales (K Units), Revenue (US$, Mn) and Average Price (USD/Unit) & (2020-2025)
Table 49. Prometheus Group Key News & Latest Developments
Table 50. Vista Outdoor Company Summary
Table 51. Vista Outdoor Game Camera Product Offerings
Table 52. Vista Outdoor Game Camera Sales (K Units), Revenue (US$, Mn) and Average Price (USD/Unit) & (2020-2025)
Table 53. Vista Outdoor Key News & Latest Developments
Table 54. Wildgame Innovations Company Summary
Table 55. Wildgame Innovations Game Camera Product Offerings
Table 56. Wildgame Innovations Game Camera Sales (K Units), Revenue (US$, Mn) and Average Price (USD/Unit) & (2020-2025)
Table 57. Wildgame Innovations Key News & Latest Developments
Table 58. Bgha Inc. Company Summary
Table 59. Bgha Inc. Game Camera Product Offerings
Table 60. Bgha Inc. Game Camera Sales (K Units), Revenue (US$, Mn) and Average Price (USD/Unit) & (2020-2025)
Table 61. Bgha Inc. Key News & Latest Developments
Table 62. Moultrie Company Summary
Table 63. Moultrie Game Camera Product Offerings
Table 64. Moultrie Game Camera Sales (K Units), Revenue (US$, Mn) and Average Price (USD/Unit) & (2020-2025)
Table 65. Moultrie Key News & Latest Developments
Table 66. Reconyx Company Summary
Table 67. Reconyx Game Camera Product Offerings
Table 68. Reconyx Game Camera Sales (K Units), Revenue (US$, Mn) and Average Price (USD/Unit) & (2020-2025)
Table 69. Reconyx Key News & Latest Developments
Table 70. Spypoint Company Summary
Table 71. Spypoint Game Camera Product Offerings
Table 72. Spypoint Game Camera Sales (K Units), Revenue (US$, Mn) and Average Price (USD/Unit) & (2020-2025)
Table 73. Spypoint Key News & Latest Developments
Table 74. Cuddeback Company Summary
Table 75. Cuddeback Game Camera Product Offerings
Table 76. Cuddeback Game Camera Sales (K Units), Revenue (US$, Mn) and Average Price (USD/Unit) & (2020-2025)
Table 77. Cuddeback Key News & Latest Developments
Table 78. GSM Outdoors Company Summary
Table 79. GSM Outdoors Game Camera Product Offerings
Table 80. GSM Outdoors Game Camera Sales (K Units), Revenue (US$, Mn) and Average Price (USD/Unit) & (2020-2025)
Table 81. GSM Outdoors Key News & Latest Developments
Table 82. Bolymedia Company Summary
Table 83. Bolymedia Game Camera Product Offerings
Table 84. Bolymedia Game Camera Sales (K Units), Revenue (US$, Mn) and Average Price (USD/Unit) & (2020-2025)
Table 85. Bolymedia Key News & Latest Developments
Table 86. Game Camera Capacity of Key Manufacturers in Global Market, 2023-2025 (K Units)
Table 87. Global Game Camera Capacity Market Share of Key Manufacturers, 2023-2025
Table 88. Global Game Camera Production by Region, 2020-2025 (K Units)
Table 89. Global Game Camera Production by Region, 2026-2032 (K Units)
Table 90. Game Camera Market Opportunities & Trends in Global Market
Table 91. Game Camera Market Drivers in Global Market
Table 92. Game Camera Market Restraints in Global Market
Table 93. Game Camera Raw Materials
Table 94. Game Camera Raw Materials Suppliers in Global Market
Table 95. Typical Game Camera Downstream
Table 96. Game Camera Downstream Clients in Global Market
Table 97. Game Camera Distributors and Sales Agents in Global Market

List of Figures
Figure 1. Game Camera Product Picture
Figure 2. Game Camera Segment by Type in 2024
Figure 3. Game Camera Segment by Application in 2024
Figure 4. Global Game Camera Market Overview: 2024
Figure 5. Key Caveats
Figure 6. Global Game Camera Market Size: 2024 VS 2032 (US$, Mn)
Figure 7. Global Game Camera Revenue: 2020-2032 (US$, Mn)
Figure 8. Game Camera Sales in Global Market: 2020-2032 (K Units)
Figure 9. The Top 3 and 5 Players Market Share by Game Camera Revenue in 2024
Figure 10. Segment by Type – Global Game Camera Revenue, (US$, Mn), 2024 & 2032
Figure 11. Segment by Type – Global Game Camera Revenue Market Share, 2020-2032
Figure 12. Segment by Type – Global Game Camera Sales Market Share, 2020-2032
Figure 13. Segment by Type – Global Game Camera Price (USD/Unit), 2020-2032
Figure 14. Segment by Application – Global Game Camera Revenue, (US$, Mn), 2024 & 2032
Figure 15. Segment by Application – Global Game Camera Revenue Market Share, 2020-2032
Figure 16. Segment by Application – Global Game Camera Sales Market Share, 2020-2032
Figure 17. Segment by Application -Global Game Camera Price (USD/Unit), 2020-2032
Figure 18. By Region – Global Game Camera Revenue, (US$, Mn), 2025 & 2032
Figure 19. By Region – Global Game Camera Revenue Market Share, 2020 VS 2024 VS 2032
Figure 20. By Region – Global Game Camera Revenue Market Share, 2020-2032
Figure 21. By Region – Global Game Camera Sales Market Share, 2020-2032
Figure 22. By Country – North America Game Camera Revenue Market Share, 2020-2032
Figure 23. By Country – North America Game Camera Sales Market Share, 2020-2032
Figure 24. United States Game Camera Revenue, (US$, Mn), 2020-2032
Figure 25. Canada Game Camera Revenue, (US$, Mn), 2020-2032
Figure 26. Mexico Game Camera Revenue, (US$, Mn), 2020-2032
Figure 27. By Country – Europe Game Camera Revenue Market Share, 2020-2032
Figure 28. By Country – Europe Game Camera Sales Market Share, 2020-2032
Figure 29. Germany Game Camera Revenue, (US$, Mn), 2020-2032
Figure 30. France Game Camera Revenue, (US$, Mn), 2020-2032
Figure 31. U.K. Game Camera Revenue, (US$, Mn), 2020-2032
Figure 32. Italy Game Camera Revenue, (US$, Mn), 2020-2032
Figure 33. Russia Game Camera Revenue, (US$, Mn), 2020-2032
Figure 34. Nordic Countries Game Camera Revenue, (US$, Mn), 2020-2032
Figure 35. Benelux Game Camera Revenue, (US$, Mn), 2020-2032
Figure 36. By Region – Asia Game Camera Revenue Market Share, 2020-2032
Figure 37. By Region – Asia Game Camera Sales Market Share, 2020-2032
Figure 38. China Game Camera Revenue, (US$, Mn), 2020-2032
Figure 39. Japan Game Camera Revenue, (US$, Mn), 2020-2032
Figure 40. South Korea Game Camera Revenue, (US$, Mn), 2020-2032
Figure 41. Southeast Asia Game Camera Revenue, (US$, Mn), 2020-2032
Figure 42. India Game Camera Revenue, (US$, Mn), 2020-2032
Figure 43. By Country – South America Game Camera Revenue Market Share, 2020-2032
Figure 44. By Country – South America Game Camera Sales, Market Share, 2020-2032
Figure 45. Brazil Game Camera Revenue, (US$, Mn), 2020-2032
Figure 46. Argentina Game Camera Revenue, (US$, Mn), 2020-2032
Figure 47. By Country – Middle East & Africa Game Camera Revenue, Market Share, 2020-2032
Figure 48. By Country – Middle East & Africa Game Camera Sales, Market Share, 2020-2032
Figure 49. Turkey Game Camera Revenue, (US$, Mn), 2020-2032
Figure 50. Israel Game Camera Revenue, (US$, Mn), 2020-2032
Figure 51. Saudi Arabia Game Camera Revenue, (US$, Mn), 2020-2032
Figure 52. UAE Game Camera Revenue, (US$, Mn), 2020-2032
Figure 53. Global Game Camera Production Capacity (K Units), 2020-2032
Figure 54. The Percentage of Production Game Camera by Region, 2024 VS 2032
Figure 55. Game Camera Industry Value Chain
Figure 56. Marketing Channels