MARKET INSIGHTS
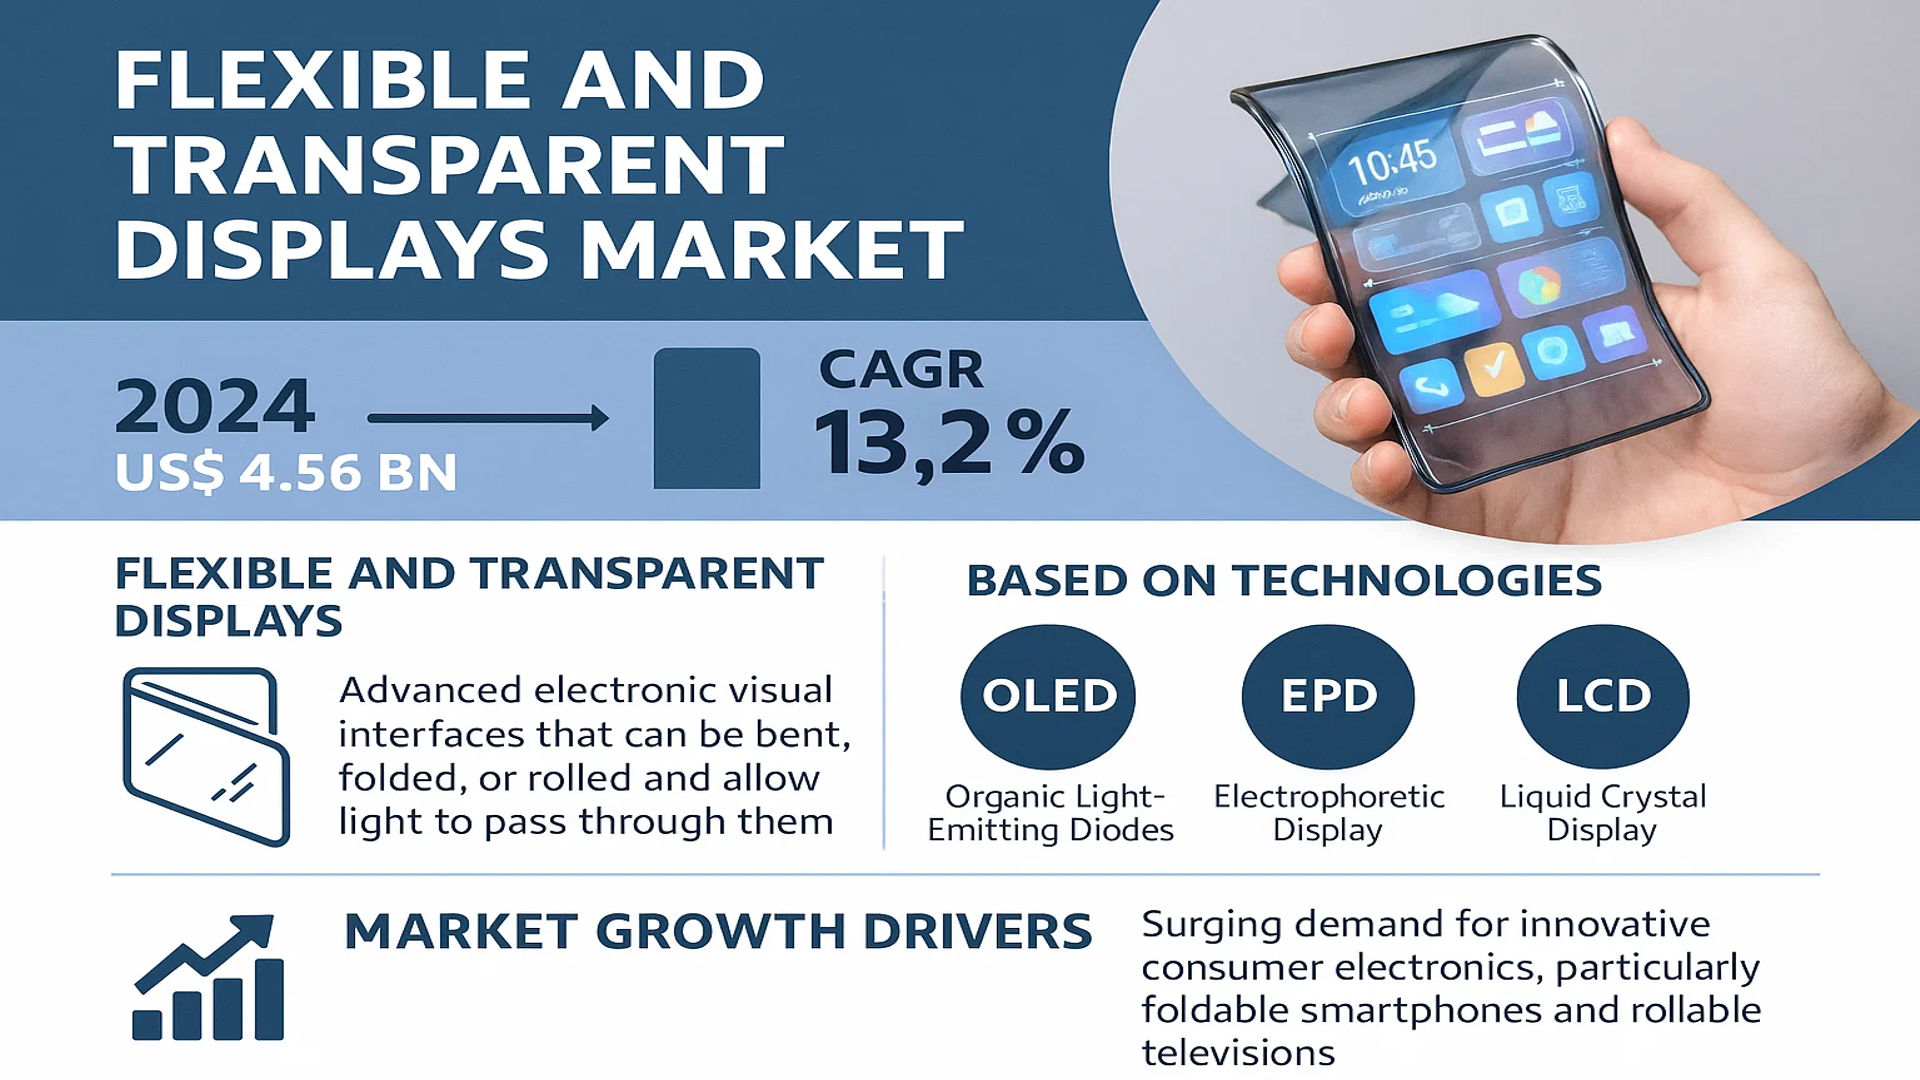
The global Flexible and Transparent Displays Market size was valued at US$ 4.56 billion in 2024 and is projected to reach US$ 12.34 billion by 2032, at a CAGR of 13.2% during the forecast period 2025-2032.
Flexible and transparent displays are advanced electronic visual interfaces that can be bent, folded, or rolled and allow light to pass through them. These displays are primarily based on technologies such as Organic Light-Emitting Diodes (OLED), Electrophoretic Display (EPD), and Liquid Crystal Display (LCD). They are crucial for enabling next-generation form factors in consumer electronics, automotive interfaces, and smart architectural applications, offering unprecedented design freedom and user experience enhancements.
The market is experiencing robust growth driven by surging demand for innovative consumer electronics, particularly foldable smartphones and rollable televisions. Furthermore, the automotive sector’s increasing integration of heads-up displays (HUDs) and transparent infotainment systems is a significant growth driver. Asia-Pacific dominates the market, with China being a major hub; for instance, the top three manufacturers—Royole Corporation, LG, and AU Optronics—collectively hold a market share exceeding 54%. The largest product segment is Flexible Surface displays, commanding over 72% of the market, while Consumer Electronics remains the dominant application area.
MARKET DYNAMICS
MARKET DRIVERS
Rising Demand for Foldable Smartphones and Wearables to Drive Market Expansion
The global flexible and transparent displays market is experiencing robust growth driven by increasing consumer adoption of foldable smartphones and wearable devices. Shipments of foldable smartphones reached approximately 18 million units in 2023, representing a 50% year-over-year growth, with this segment projected to exceed 100 million units annually by 2030. This surge is primarily fueled by technological advancements in OLED technology, which enables thinner, lighter, and more energy-efficient displays. Major smartphone manufacturers have launched multiple foldable models across various price points, making these devices more accessible to consumers. The wearable segment, particularly smartwatches and augmented reality glasses, further contributes to this growth, with transparent displays becoming essential for heads-up displays and immersive AR experiences.
Advancements in Automotive and Aviation Applications to Accelerate Adoption
The automotive and aviation sectors present significant growth opportunities for flexible and transparent displays, driven by the integration of advanced human-machine interfaces and augmented reality systems. Modern vehicles increasingly incorporate curved and flexible displays for dashboards, center consoles, and rear-seat entertainment, with the automotive display market projected to reach $28 billion by 2030. Transparent displays are gaining traction in head-up displays (HUDs), which project critical information onto windshields, enhancing driver safety and situational awareness. In aviation, transparent displays are being implemented in cockpit systems and passenger entertainment, with commercial aircraft manufacturers investing heavily in next-generation display technologies. The growing emphasis on connected vehicles and autonomous driving systems further accelerates the adoption of these advanced display solutions.
Innovations in Building Decoration and Retail to Fuel Market Growth
Architectural and retail applications are emerging as significant drivers for flexible and transparent displays, transforming how businesses engage with customers and decorate spaces. The global smart retail market, valued at over $40 billion, increasingly incorporates transparent displays for interactive product showcases and digital signage. These displays enable retailers to create immersive shopping experiences while maintaining product visibility. In building decoration, transparent displays are being integrated into windows, partitions, and facades, serving both functional and aesthetic purposes. The development of energy-efficient, sunlight-readable transparent OLED panels has opened new possibilities for architectural integration, with several high-profile commercial buildings already implementing these technologies for dynamic information display and artistic installations.
MARKET RESTRAINTS
High Manufacturing Costs and Complex Production Processes to Limit Market Penetration
Despite the promising growth trajectory, the flexible and transparent displays market faces significant restraints due to high manufacturing costs and complex production processes. The production of flexible OLED displays requires specialized equipment and materials, with manufacturing costs approximately 30-40% higher than traditional rigid displays. The yield rates for flexible displays remain challenging, particularly for larger panels, with industry averages hovering around 60-70% compared to 85-90% for conventional displays. These cost factors translate to higher consumer prices, limiting mass adoption in price-sensitive markets. Additionally, the encapsulation process for flexible displays demands advanced barrier technologies to prevent moisture and oxygen penetration, adding further complexity and expense to the manufacturing workflow.
Durability Concerns and Technical Limitations to Hinder Widespread Adoption
Technical challenges related to durability and performance present substantial restraints for market expansion. Flexible displays must withstand repeated bending cycles without degradation, with current industry standards requiring survival through 200,000 folding cycles. However, achieving consistent performance across temperature variations and mechanical stress remains challenging. Transparent displays face limitations in brightness and contrast ratio, particularly in high-ambient light conditions, with current transparent OLEDs achieving approximately 45% transparency while maintaining display functionality. The trade-off between transparency and display quality continues to pose engineering challenges, especially for applications requiring high-resolution content. These technical limitations affect consumer confidence and slow adoption in critical applications where reliability is paramount.
Supply Chain Constraints and Material Availability to Impact Production Scalability
The market faces additional restraints from supply chain limitations and material availability issues. Flexible and transparent displays require specialized materials such as polyimide substrates, transparent conductive oxides, and flexible encapsulation layers, which have limited manufacturing capacity globally. The supply of these specialized materials often fails to meet growing demand, leading to production bottlenecks and extended lead times. Geographic concentration of key material suppliers creates vulnerability to geopolitical tensions and trade restrictions. Furthermore, the recycling and disposal of flexible display materials present environmental challenges, with current recycling rates for display components remaining below 25%, raising sustainability concerns that may attract regulatory scrutiny and affect market growth.
MARKET CHALLENGES
Technical Standardization and Compatibility Issues to Challenge Market Development
The flexible and transparent displays market faces significant challenges regarding technical standardization and compatibility with existing systems. The absence of universal standards for flexible display interfaces, folding mechanisms, and durability metrics creates interoperability issues across devices and applications. Manufacturers developing proprietary technologies often face resistance from ecosystem partners, slowing industry-wide adoption. Compatibility with existing manufacturing infrastructure presents another challenge, as traditional display production lines require substantial modification to accommodate flexible substrates and processing techniques. The industry must establish common standards for bend radius, folding endurance, and optical performance to ensure consistent quality and user experience across products.
Other Challenges
Consumer Acceptance and Market Education
Consumer skepticism regarding the durability and practicality of flexible displays poses a substantial challenge to market growth. Early adopters have reported concerns about screen creasing, mechanical failure, and repair costs, affecting broader consumer confidence. The market requires extensive education efforts to demonstrate the reliability and benefits of these technologies, particularly for high-price-point devices. Additionally, the perception of transparent displays as novelty items rather than practical solutions hinders adoption in professional and industrial applications where functionality and ROI are critical considerations.
Regulatory and Environmental Compliance
Stringent regulatory requirements for electronic waste management and hazardous material usage present ongoing challenges for market participants. Flexible displays incorporate materials that may face restrictions under evolving environmental regulations, particularly in regions with strict chemical management laws. The industry must navigate complex compliance landscapes while maintaining performance characteristics, often requiring costly material substitutions and process modifications. Furthermore, the recycling infrastructure for flexible displays remains underdeveloped, creating potential regulatory liabilities as product volumes increase and end-of-life management becomes more scrutinized.
MARKET OPPORTUNITIES
Emerging Applications in Healthcare and Education to Create New Growth Avenues
The healthcare and education sectors present substantial opportunities for flexible and transparent displays, driven by the need for innovative visualization and interactive solutions. In healthcare, transparent displays are being integrated into surgical systems, patient monitoring equipment, and medical training simulations, enabling enhanced visualization during procedures and improved patient education. The global medical display market, projected to reach $3.5 billion by 2030, increasingly adopts flexible technologies for portable diagnostic devices and wearable health monitors. Educational institutions are implementing transparent displays for interactive learning experiences, with the smart education technology market growing at approximately 15% annually. These applications require durable, lightweight displays that can withstand frequent use and various environmental conditions, creating ideal opportunities for flexible display technologies.
Advancements in Military and Defense Applications to Drive Specialized Market Growth
Military and defense applications offer significant opportunities for flexible and transparent displays, particularly for situational awareness, command and control systems, and wearable combat equipment. The global military display market is expected to exceed $2.8 billion by 2030, with increasing investment in lightweight, ruggedized display solutions. Flexible displays enable the development of conformal displays that can be integrated into curved surfaces of aircraft cockpits, vehicle dashboards, and soldier equipment. Transparent displays are being deployed in augmented reality systems for training simulations and real-time battlefield information overlay. These applications demand high reliability under extreme conditions, driving innovation in display durability, readability in various lighting conditions, and resistance to environmental factors.
Integration with Internet of Things and Smart City Infrastructure to Expand Market Reach
The proliferation of Internet of Things devices and smart city initiatives creates extensive opportunities for flexible and transparent displays in public infrastructure and consumer IoT applications. Smart city projects worldwide are incorporating transparent displays into public transportation systems, information kiosks, and architectural elements, with global smart city investment expected to reach $2.5 trillion by 2025. Flexible displays enable the creation of unobtrusive, integrated information systems that blend with urban environments while providing dynamic content delivery. In consumer IoT, flexible displays are being integrated into smart home controllers, wearable devices, and appliance interfaces, driven by the growing smart home market which is projected to surpass $500 billion by 2030. These applications benefit from the form factor advantages and durability characteristics of flexible display technologies.
FLEXIBLE AND TRANSPARENT DISPLAYS MARKET TRENDS
Advancements in OLED and MicroLED Technologies to Emerge as a Trend in the Market
Advancements in Organic Light Emitting Diode (OLED) and MicroLED technologies are fundamentally reshaping the flexible and transparent display landscape. The inherent flexibility of OLED substrates allows for the creation of rollable, foldable, and even stretchable screens, which is a primary driver for the market’s projected growth to US$ 12.34 billion by 2032. Recent innovations have focused on improving the durability of these panels, with foldable displays now achieving over 200,000 folds without significant degradation in performance. Furthermore, the integration of transparent OLED (T-OLED) technology is unlocking novel applications in retail and automotive, where displays can seamlessly transition from opaque to transparent states. The development of more efficient and brighter blue phosphorescent materials has also been a critical breakthrough, enhancing the longevity and energy efficiency of these devices, which is crucial for their adoption in battery-powered consumer electronics.
Other Trends
Proliferation in Consumer Electronics
The insatiable consumer demand for novel form factors is a powerful market catalyst. The success of foldable smartphones, which saw global shipments surpass 21 million units in 2023, has validated the commercial viability of flexible displays and spurred intense R&D investment from major manufacturers. This trend is expanding beyond smartphones into tablets, laptops, and wearable devices like smartwatches and fitness bands, which increasingly utilize curved and flexible screens for enhanced ergonomics and design aesthetics. The market for flexible displays in consumer electronics alone is anticipated to grow at a compound annual growth rate (CAGR) of over 15% during the forecast period, making it the largest application segment with a share exceeding 60%.
Expansion into Automotive and Architectural Applications
The expansion into automotive and architectural applications represents a significant blue ocean for flexible and transparent display technologies. In the automotive sector, these displays are being integrated into curved dashboards, transparent A-pillars for improved driver visibility, and even sunroofs that double as entertainment screens. The global automotive display market is projected to exceed US$ 30 billion by 2030, with flexible and transparent variants capturing an increasingly larger share. Concurrently, in architecture and building decoration, large-scale transparent displays are being used for interactive storefronts, smart windows that control light and display information, and immersive art installations. This diversification beyond traditional consumer electronics is crucial for sustaining long-term market growth and mitigating risks associated with cyclical demand in the smartphone industry.
COMPETITIVE LANDSCAPE
Key Industry Players
Technological Innovation and Strategic Expansion Define Market Leadership
The global flexible and transparent displays market exhibits a semi-consolidated structure, characterized by a dynamic mix of established electronics giants and agile, innovation-driven specialists. LG Display is a dominant force, leveraging its extensive manufacturing scale, deep R&D investments in OLED technology, and strategic partnerships with major consumer electronics brands. The company’s production capacity and technological advancements, particularly in large-size transparent OLED panels for retail and automotive applications, cement its leadership position.
Samsung Display and Royole Corporation also command significant market share. Samsung’s strength lies in its flagship foldable display technology used in its Galaxy Z series smartphones, while Royole, as a pioneer, has made substantial inroads with its flexible displays, holding numerous patents and achieving early commercialization. The growth of these players is propelled by their continuous product innovation and ability to secure high-volume contracts within the burgeoning consumer electronics sector.
Furthermore, these leading companies are aggressively pursuing growth through geographic expansion into emerging markets and a relentless stream of new product launches. This is expected to significantly solidify their market positions over the forecast period.
Meanwhile, other key participants like AU Optronics (AUO) and BOE Technology are strengthening their global footprint through substantial capital expenditure in next-generation production lines, strategic collaborations with automotive OEMs, and developments in ultra-thin, rollable display form factors. Their focused strategies ensure vigorous competition and drive the overall evolution of the market landscape.
List of Key Companies Profiled in the Flexible and Transparent Displays Market
- LG Display Co., Ltd. (South Korea)
- Samsung Display Co., Ltd. (South Korea)
- Royole Corporation (China)
- AU Optronics Corp. (AUO) (Taiwan)
- BOE Technology Group Co., Ltd. (China)
- Sharp Corporation (Foxconn) (Japan)
- Visionox Technology Inc. (China)
- E Ink Holdings Inc. (Taiwan)
- Planar Systems, Inc. (Leyard) (U.S.)
Segment Analysis:
By Type
Flexible Surface Segment Dominates the Market Due to its Widespread Adoption in Consumer Electronics
The market is segmented based on type into:
- Flexible Surface
- Foldable Displays
By Application
Consumer Electronics Segment Leads Due to High Demand in Smartphones and Wearable Devices
The market is segmented based on application into:
- Consumer Electronics
- Smart Home
- Automotive and Aviation
- Building Decoration
- Others
By Technology
OLED Technology Segment Leads Due to Superior Flexibility and Transparency Characteristics
The market is segmented based on technology into:
- OLED
- LCD
- EPD
- Others
By End User
Individual Consumers Segment Leads Due to Mass Adoption of Flexible Display Devices
The market is segmented based on end user into:
- Individual Consumers
- Enterprise & Commercial
- Industrial
- Government & Defense
Regional Analysis: Flexible and Transparent Displays Market
Asia-Pacific
The Asia-Pacific region is the undisputed leader in the global flexible and transparent displays market, accounting for the largest market share by both volume and revenue. This dominance is primarily driven by the massive consumer electronics manufacturing base concentrated in countries like China, South Korea, and Japan. China, in particular, is a powerhouse, home to leading manufacturers such as Royole Corporation, BOE Technology, and Shenzhen China Star Optoelectronics Technology (CSOT). The region benefits from a robust supply chain ecosystem for OLED and advanced display technologies, aggressive investment in R&D, and strong government support for high-tech industries. While consumer electronics, especially smartphones and wearables, remain the primary application, there is a growing exploration of these displays in the automotive sector for futuristic dashboards and heads-up displays. The sheer scale of production and rapid adoption of new technology by a vast consumer base solidifies Asia-Pacific’s position as the market’s growth engine.
North America
North America is a significant hub for innovation and early adoption within the flexible and transparent displays market. The region’s strength lies in its advanced technological infrastructure, substantial R&D investments from tech giants, and a highly receptive market for premium consumer electronics. Key players like Apple Inc. and Google, headquartered in the U.S., are major drivers of demand as they integrate these advanced displays into their next-generation devices, including foldable phones and augmented reality glasses. Furthermore, there is growing application development in the automotive sector, with companies exploring transparent displays for windshields and side windows. The market is characterized by a focus on high-value, cutting-edge products rather than mass-volume production, with a strong emphasis on intellectual property and design innovation.
Europe
Europe holds a prominent position in the flexible and transparent displays market, distinguished by its strong focus on research, high-quality manufacturing, and application in premium automotive and aerospace sectors. The region is home to leading automotive manufacturers who are at the forefront of integrating transparent display technology into vehicle cockpits to enhance user experience and safety. Countries like Germany, the UK, and France host significant research initiatives and collaborations between universities and industry players to advance material science underlying these displays. While the region may not match Asia’s production volume, it competes effectively in high-end, niche applications where performance, durability, and integration with luxury products are paramount. Strict regulatory standards also push innovation toward more energy-efficient and environmentally sustainable display solutions.
South America
The market for flexible and transparent displays in South America is currently in a nascent stage of development. Adoption is primarily limited to high-end consumer electronics imported from North America and Asia, accessible to a relatively small segment of the population. Economic volatility and currency fluctuations present significant challenges, making it difficult for manufacturers to establish local production facilities or for consumers to afford premium devices featuring this technology. However, as global prices for display components gradually decrease and the region’s economy stabilizes, long-term growth potential exists. Initial forays are likely to be seen in advertising and retail sectors for transparent digital signage, before trickling down to broader consumer applications.
Middle East & Africa
The Middle East & Africa region represents an emerging market with potential driven by investment in smart city initiatives and luxury retail in certain Gulf Cooperation Council (GCC) nations. Countries like the United Arab Emirates and Saudi Arabia, with their focus on technological modernization and tourism, are early adopters. Applications are primarily seen in high-end retail stores, hotel lobbies, and corporate offices as transparent signage and interactive displays to create immersive experiences. However, the broader adoption across consumer electronics and other sectors is hindered by economic disparities across the region, less developed local manufacturing capabilities, and a reliance on imports. Growth is expected to be gradual, closely tied to urban development projects and economic diversification efforts in the wealthier nations.
Report Scope
This market research report provides a comprehensive analysis of the global Flexible and Transparent Displays market, covering the forecast period 2025–2032. It offers detailed insights into market dynamics, technological advancements, competitive landscape, and key trends shaping the industry.
Key focus areas of the report include:
- Market Size & Forecast: Historical data and future projections for revenue, unit shipments, and market value across major regions and segments.
- Segmentation Analysis: Detailed breakdown by product type, technology, application, and end-user industry to identify high-growth segments and investment opportunities.
- Regional Outlook: Insights into market performance across North America, Europe, Asia-Pacific, Latin America, and the Middle East & Africa, including country-level analysis where relevant.
- Competitive Landscape: Profiles of leading market participants, including their product offerings, R&D focus, manufacturing capacity, pricing strategies, and recent developments such as mergers, acquisitions, and partnerships.
- Technology Trends & Innovation: Assessment of emerging technologies, integration of AI/IoT, semiconductor design trends, fabrication techniques, and evolving industry standards.
- Market Drivers & Restraints: Evaluation of factors driving market growth along with challenges, supply chain constraints, regulatory issues, and market-entry barriers.
- Stakeholder Analysis: Insights for component suppliers, OEMs, system integrators, investors, and policymakers regarding the evolving ecosystem and strategic opportunities.
Primary and secondary research methods are employed, including interviews with industry experts, data from verified sources, and real-time market intelligence to ensure the accuracy and reliability of the insights presented.
FREQUENTLY ASKED QUESTIONS:
What is the current market size of Global Flexible and Transparent Displays Market?
->Flexible and Transparent Displays Market size was valued at US$ 4.56 billion in 2024 and is projected to reach US$ 12.34 billion by 2032, at a CAGR of 13.2% during the forecast period 2025-2032.
Which key companies operate in Global Flexible and Transparent Displays Market?
-> Key players include Royole Corporation, LG Display, AU Optronics, Gamin-tech, HENLIPS, and Lianman, among others.
What are the key growth drivers?
-> Key growth drivers include rising demand for foldable smartphones, adoption in automotive displays, and increasing applications in smart home and building decoration sectors.
Which region dominates the market?
-> Asia-Pacific dominates the market, with China holding a significant share and being home to major manufacturers like Royole Corporation.
What are the emerging trends?
-> Emerging trends include development of ultra-thin flexible OLEDs, integration with IoT devices, and expansion into wearable technology and augmented reality applications.

Get Sample Report PDF for Exclusive Insights
Report Sample Includes
- Table of Contents
- List of Tables & Figures
- Charts, Research Methodology, and more...