Firewall Devices Market Overview
Firewall Devices, a network security system, which monitors input and output network traffic and determines whether certain traffic is allowed or blocked, according to specified security rules.
This report provides a deep insight into the global Firewall Devices market covering all its essential aspects. This ranges from a macro overview of the market to micro details of the market size, competitive landscape, development trend, niche market, key market drivers and challenges, SWOT analysis, value chain analysis, etc.
The analysis helps the reader to shape the competition within the industries and strategies for the competitive environment to enhance the potential profit. Furthermore, it provides a simple framework for evaluating and accessing the position of the business organization. The report structure also focuses on the competitive landscape of the Global Firewall Devices Market, this report introduces in detail the market share, market performance, product situation, operation situation, etc. of the main players, which helps the readers in the industry to identify the main competitors and deeply understand the competition pattern of the market.
In a word, this report is a must-read for industry players, investors, researchers, consultants, business strategists, and all those who have any kind of stake or are planning to foray into the Firewall Devices market in any manner.
Firewall Devices Market Analysis:
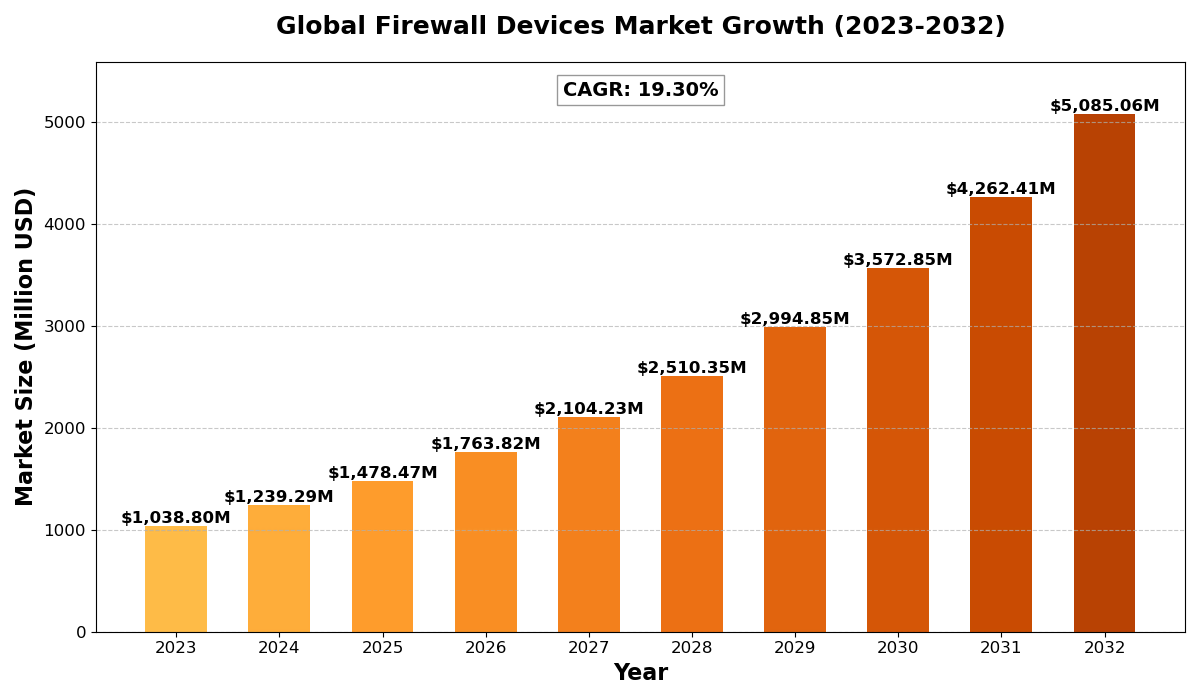
The global Firewall Devices Market size was estimated at USD 1038.80 million in 2023 and is projected to reach USD 5085.06 million by 2032, exhibiting a CAGR of 19.30% during the forecast period.
North America Firewall Devices market size was estimated at USD 367.65 million in 2023, at a CAGR of 16.54% during the forecast period of 2025 through 2032.
Firewall Devices Key Market Trends :
- Growing Adoption of Next-Generation Firewalls (NGFWs)
Businesses are increasingly adopting NGFWs due to their advanced threat detection capabilities, integrated intrusion prevention systems, and enhanced visibility into network traffic. - Rising Cybersecurity Threats and Stringent Regulations
The increasing frequency of cyberattacks and stringent government regulations worldwide are driving organizations to invest heavily in firewall security solutions. - Cloud-Based Firewall Solutions on the Rise
With the shift to cloud computing, enterprises are adopting cloud-based firewall solutions for better scalability, flexibility, and cost-effectiveness. - AI and Machine Learning Integration
Firewalls are leveraging AI and machine learning for real-time threat detection and automated responses, improving overall network security. - Increasing Demand in SMEs
Small and medium enterprises are recognizing the importance of firewall security, driving the demand for affordable and easy-to-deploy firewall solutions.
Firewall Devices Market Regional Analysis :

North America:
Strong demand driven by EVs, 5G infrastructure, and renewable energy, with the U.S. leading the market.
Europe:
Growth fueled by automotive electrification, renewable energy, and strong regulatory support, with Germany as a key player.
Asia-Pacific:
Dominates the market due to large-scale manufacturing in China and Japan, with growing demand from EVs, 5G, and semiconductors.
South America:
Emerging market, driven by renewable energy and EV adoption, with Brazil leading growth.
Middle East & Africa:
Gradual growth, mainly due to investments in renewable energy and EV infrastructure, with Saudi Arabia and UAE as key contributors.
Firewall Devices Market Segmentation :
The research report includes specific segments by region (country), manufacturers, Type, and Application. Market segmentation creates subsets of a market based on product type, end-user or application, Geographic, and other factors. By understanding the market segments, the decision-maker can leverage this targeting in the product, sales, and marketing strategies. Market segments can power your product development cycles by informing how you create product offerings for different segments.
Key Company
- Check Point
- Cisco
- Palo Alto Networks
- Fortinet
- Dell SonicWALL
- IT Central Station
- Juniper
- PfSense
- Cyberoam
- FireEye
Market Segmentation (by Type)
- Packet Filter
- Application Proxy
- Stateful Inspection
Market Segmentation (by Application)
- Healthcare
- Government
- Retail
- Others
Market Drivers
- Surge in Cybersecurity Threats
The rise in cyber threats, including malware, ransomware, and DDoS attacks, is propelling the demand for advanced firewall solutions across industries. - Growing Digital Transformation
The rapid digitalization of businesses and increased adoption of cloud services are driving the need for robust network security solutions. - Regulatory Compliance Requirements
Governments and regulatory bodies are implementing stringent security standards, compelling businesses to adopt firewall security systems.
Market Restraints
- High Implementation and Maintenance Costs
The initial setup and ongoing maintenance costs of firewall solutions can be expensive, especially for small businesses. - Complexity in Configuration and Management
Advanced firewall solutions require skilled IT personnel for proper configuration and management, which can be a challenge for some organizations. - Performance Issues with High Traffic
Firewalls may face performance degradation when handling large volumes of network traffic, affecting business operations.
Market Opportunities
- Expansion of Cloud-Based Security Solutions
The increasing adoption of cloud-based security solutions presents lucrative opportunities for firewall solution providers. - Growing Demand in Emerging Markets
Developing regions are witnessing significant growth in cybersecurity investments, offering new market expansion opportunities. - Innovations in AI-Driven Security Solutions
The integration of AI and machine learning in firewalls can enhance threat detection and prevention capabilities, attracting more businesses.
Market Challenges
- Evolving Cyber Threat Landscape
Cybercriminals continuously develop sophisticated attack methods, making it challenging for firewall solutions to keep up. - Shortage of Skilled Cybersecurity Professionals
The lack of skilled IT professionals in cybersecurity is a major challenge for businesses looking to implement advanced firewall solutions. - Integration with Existing Security Infrastructure
Ensuring compatibility and seamless integration of firewall solutions with existing security infrastructure remains a challenge for enterprises.
Key Benefits of This Market Research:
- Industry drivers, restraints, and opportunities covered in the study
- Neutral perspective on the market performance
- Recent industry trends and developments
- Competitive landscape & strategies of key players
- Potential & niche segments and regions exhibiting promising growth covered
- Historical, current, and projected market size, in terms of value
- In-depth analysis of the Firewall Devices Market
- Overview of the regional outlook of the Firewall Devices Market:
Key Reasons to Buy this Report:
- Access to date statistics compiled by our researchers. These provide you with historical and forecast data, which is analyzed to tell you why your market is set to change
- This enables you to anticipate market changes to remain ahead of your competitors
- You will be able to copy data from the Excel spreadsheet straight into your marketing plans, business presentations, or other strategic documents
- The concise analysis, clear graph, and table format will enable you to pinpoint the information you require quickly
- Provision of market value data for each segment and sub-segment
- Indicates the region and segment that is expected to witness the fastest growth as well as to dominate the market
- Provides insight into the market through Value Chain
- Market dynamics scenario, along with growth opportunities of the market in the years to come
- 6-month post-sales analyst support
Customization of the Report
In case of any queries or customization requirements, please connect with our sales team, who will ensure that your requirements are met.
FAQs
Q: What are the key driving factors and opportunities in the Firewall Devices market?
A: The primary drivers include increasing cybersecurity threats, digital transformation, and regulatory compliance. Opportunities lie in cloud-based security solutions, emerging markets, and AI-driven innovations.
Q: Which region is projected to have the largest market share?
A: North America is expected to dominate the market due to high cybersecurity awareness, regulatory frameworks, and significant investments in network security infrastructure.
Q: Who are the top players in the global Firewall Devices market?
A: Key players include Check Point, Cisco, Palo Alto Networks, Fortinet, Dell SonicWALL, Juniper, and FireEye, among others.
Q: What are the latest technological advancements in the industry?
A: Advancements include AI-driven threat detection, cloud-based firewall solutions, and next-generation firewalls with integrated intrusion prevention systems.
Q: What is the current size of the global Firewall Devices market?
A: The market size was estimated at USD 1038.80 million in 2023 and is projected to reach USD 5085.06 million by 2032, growing at a CAGR of 19.30%.

Get Sample Report PDF for Exclusive Insights
Report Sample Includes
- Table of Contents
- List of Tables & Figures
- Charts, Research Methodology, and more...


