External ODD Market, Global Business Strategies 2026-2033

External ODD Market was valued at USD 1.5 billion in 2025 and is projected to reach USD 2.1 billion by 2033, exhibiting a CAGR of 4.3% during the forecast period.

PDF Icon Download Sample Report PDF
  • Quick Dispatch

    All Orders

  • Secure Payment

    100% Secure Payment

Price range: $1,500.00 through $4,250.00

Clear

Market Insights

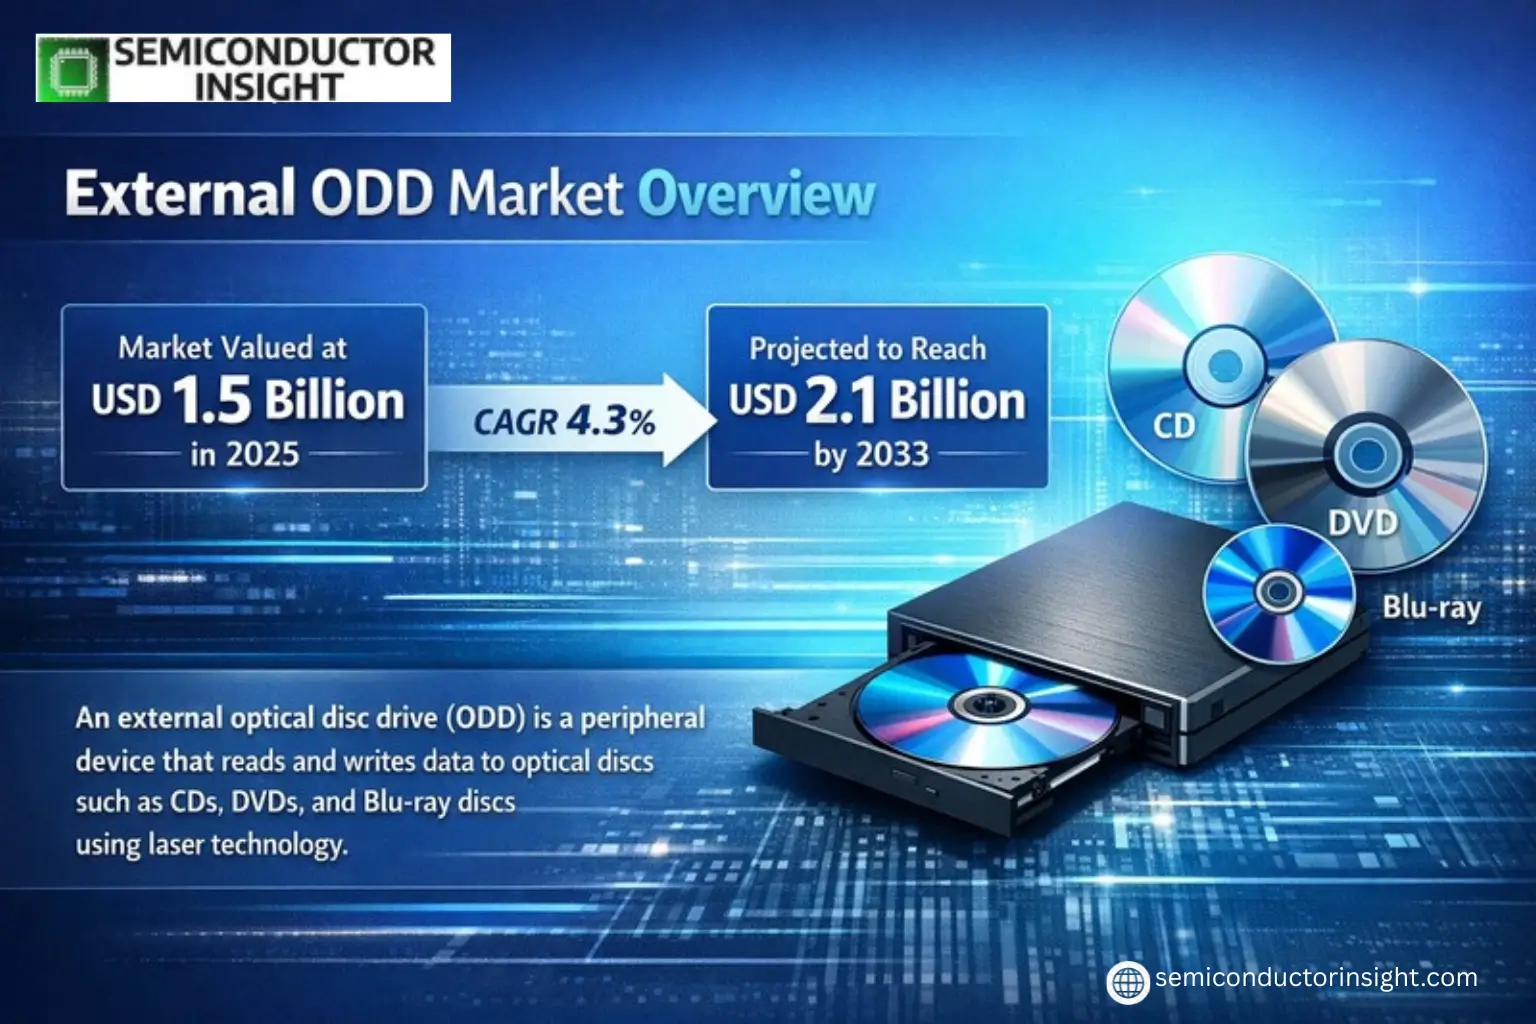
Global External ODD Market was valued at USD 1.5 billion in 2025 and is projected to reach USD 2.1 billion by 2033, exhibiting a CAGR of 4.3% during the forecast period.

An external optical disc drive (ODD) is a peripheral device that reads and writes data to optical discs such as CDs, DVDs, and Blu-ray discs using laser technology. These drives connect to computers or other devices via USB or Thunderbolt interfaces, providing portable storage and media playback solutions where internal drives are unavailable.

The market growth is driven by continued demand in professional sectors requiring physical media for data archiving, software distribution, and multimedia playback. While cloud storage dominates consumer segments, industries like healthcare, education, and government maintain steady ODD usage due to regulatory compliance and legacy system requirements. Key players including ASUS, Pioneer, and Buffalo dominate over 70% of the market share through advanced models featuring USB 3.0 connectivity and encryption capabilities.

Xyz market size & forecast

MARKET DRIVERS

Growing Demand for Portable Storage Solutions

External ODD Market is witnessing growth due to increasing demand for portable and compact optical disc drives. With rising digital content consumption, professionals and consumers require reliable methods to access legacy media formats. The External ODD sector provides compatibility with older systems lacking built-in drives while offering plug-and-play convenience.

Expanding Media Preservation Needs

Archival usage drives demand as organizations preserve critical data on optical media. External ODD units enable businesses to access decades-old CDs/DVDs containing legal records, medical imaging, or engineering designs. Government regulations mandating long-term data retention further support market expansion.

Technological innovations like USB-C connectivity and ultra-slim designs are enhancing product appeal. Manufacturers are addressing niche demands for ruggedized External ODD units in industrial applications.

MARKET CHALLENGES

Declining Optical Media Usage

External ODD Market faces headwinds from reduced optical media adoption in consumer sectors. Cloud storage and streaming services have diminished CD/DVD usage, particularly in entertainment applications. However, specialized professional segments continue driving demand.

Other Challenges

Compatibility Issues
Modern operating systems increasingly omit native support for optical media functions, creating software compatibility hurdles for External ODD manufacturers. This necessitates continuous driver development and firmware updates.

MARKET RESTRAINTS

Competition from Alternative Storage Technologies

External SSDs and high-capacity USB flash drives present formidable competition to External ODD products. While optical media offers superior longevity for archival purposes, consumers frequently prioritize the speed and convenience of solid-state solutions for everyday use.

MARKET OPPORTUNITIES

Industrial and Enterprise Applications

External ODD Market finds significant growth potential in specialized industrial applications. Aviation, healthcare, and manufacturing sectors maintain extensive optical media archives requiring reliable access. Enterprise-grade External ODD solutions with enhanced durability and security features are gaining traction.
External ODD Market Trends

Steady Growth in Global External ODD Market

Global External ODD Market was valued at USD XX million in 2025 and is projected to reach USD XX million by 2033, growing at a CAGR of X% during the forecast period. The demand for optical disc drives persists despite cloud storage growth, particularly in enterprise and archival applications where physical media remains crucial.

Other Trends

Dominance of 2.0 Interface Connection

USB 2.0 Interface Connection accounts for over 95% of External ODD Market share by product type, owing to its widespread compatibility with legacy systems. However, USB 3.0 adoption is gradually increasing in professional environments where faster data transfer speeds are required.

Regional Market Dynamics

Asia Pacific leads in External ODD manufacturing and consumption, with China holding majority share. North America and Europe maintain steady demand, primarily for business continuity and media production applications. The top four manufacturers collectively control over 70% of the global External ODD Market.

Other Trends

Application Segmentation

Portable applications dominate with XX% market share, followed by desktop solutions at XX%. The remaining segment includes niche applications in industrial, medical, and government sectors where disc-based media continues to offer security advantages over cloud storage.

Competitive Landscape

Key players like ASUS, Hitachi-LG Data Storage, and Liteon ODD continue to lead through technological enhancements in durability and read/write speeds. The market sees increasing competition from emerging manufacturers optimizing cost-efficient production while maintaining quality standards.

COMPETITIVE LANDSCAPE

Key Industry Players

Market Dominated by Asian Manufacturers with Global Tech Giants Holding Significant Shares

External ODD Market is highly consolidated, with the top four manufacturers controlling over 70% of global market share. Asian manufacturers lead the competitive landscape, with Toshiba Samsung Storage Technology Corporation and Hitachi-LG Data Storage emerging as dominant players. These companies benefit from established manufacturing ecosystems and strong R&D capabilities in optical storage technologies. The market has seen steady consolidation as smaller players struggle to compete with the scale advantages of major manufacturers.

Niche players like Buffalo and STW cater to specialized segments with ruggedized and high-performance external ODD solutions. Western technology companies including HP, Dell, and Lenovo maintain significant presence through bundled offerings with their computing devices. Recent market developments include increased adoption of USB 3.0 interface models and growing demand for slim, portable designs in the commercial sector.

List of Key External ODD Companies Profiled

Segment Analysis:

Segment Category Sub-Segments Key Insights
By Type
  • 2.0 Interface Connection
  • 3.0 Interface Connection
  • Other Interface Types
2.0 Interface Connection dominates the market due to wide compatibility with legacy systems and cost-effectiveness.

  • Widespread adoption in consumer electronics due to simple USB 2.0 standards
  • Lower manufacturing costs compared to newer interface technologies
  • Maintains strong demand in developing markets with older hardware ecosystems
By Application
  • Portable
  • Desktop
  • Industrial
  • Others
Portable applications show strongest demand owing to mobility requirements in modern computing.

  • Growing preference for lightweight, travel-friendly data storage solutions
  • Increased need for temporary disc access in business and educational environments
  • Emerging use cases in media production and field data collection
By End User
  • Consumer Electronics
  • Enterprise/Business
  • Education
  • Government
Enterprise/Business segment drives significant demand for premium external ODD solutions.

  • Corporate data archival requirements maintain steady demand
  • Legal and compliance needs for physical media in certain industries
  • Preference for external drives in hot-desking and shared workstation environments
By Form Factor
  • Slim/Slimline
  • Standard
  • Industrial-grade
Slim/Slimline models are gaining traction as the preferred form factor.

  • Aligns with modern ultrabook and tablet accessories market trends
  • Offers better portability without sacrificing performance for most applications
  • Increasing adoption in professional AV equipment and digital signage systems
By Region
  • North America
  • Europe
  • Asia Pacific
  • Rest of World
Asia Pacific emerges as a key regional market with unique characteristics.

  • Strong manufacturing ecosystem supports competitive pricing and innovation
  • Continued demand from educational institutions and government sectors
  • Growing adoption in emerging markets with expanding IT infrastructure

Regional Analysis: Global External ODD Market

Asia-Pacific

The Asia-Pacific region dominates the External ODD Market, fueled by strong electronics manufacturing ecosystems and increasing IT infrastructure spending. Countries like China, Japan, and South Korea are key production hubs, offering cost advantages for external optical drive manufacturers. The region benefits from high PC adoption rates in emerging economies and government initiatives promoting digitalization across education and business sectors. Local manufacturers excel in producing budget-friendly external ODD solutions while maintaining competitive quality standards. Market growth is further accelerated by the expansion of e-commerce channels making these devices widely accessible across both urban and rural areas. Regional players are investing in compact, portable designs with enhanced durability to meet consumer preferences.

Manufacturing Advantage
Asia-Pacific’s established electronics supply chain enables efficient external ODD production with shorter lead times and lower operational costs compared to other regions.
Technology Adoption
Rapid adoption of high-speed interfaces like USB 3.0 and Type-C connections in the region has boosted demand for modern external optical drives with faster data transfer capabilities.
Distribution Networks
Dense retailer networks and strong B2B partnerships allow external ODD manufacturers to efficiently reach both enterprise clients and individual consumers across diverse markets.
Future Readiness
Regional players are developing hybrid external ODD models with additional functionality like card readers and USB hubs to maintain relevance in evolving technology ecosystems.

North America
The North American External ODD Market thrives on strong enterprise demand and premium product positioning. Businesses prioritize reliable external optical drives for legacy system integration and data archiving needs. The region shows preference for rugged, high-performance models from established brands, with special focus on security features and compatibility with professional media formats. Creative industries and government sectors remain steady consumers of external ODD solutions. Market players emphasize cloud-integrated models that bridge physical and digital storage solutions

Europe
European markets demonstrate steady demand for External ODD devices, particularly in professional and industrial applications. Strict data regulations drive adoption of reliable external optical storage solutions in sectors handling sensitive information. The region shows preference for energy-efficient designs with longer product lifecycles. Manufacturers focus on compliance with EU environmental standards while maintaining backward compatibility with various legacy systems still operational across businesses

Middle East & Africa
This emerging External ODD Market benefits from increasing digitization initiatives and infrastructure development. Price sensitivity remains a key factor, driving demand for value-oriented external optical drives. The region shows growing adoption in education sectors and small-to-medium businesses transitioning to digital operations. Market players are adapting products for harsh climate conditions while targeting government contracts for large-scale educational and administrative technology deployments

South America
The South American External ODD Market is characterized by selective, niche demand primarily from media professionals and academic institutions. Market growth is constrained by economic fluctuations but shows resilience in specific verticals requiring physical media handling. Manufacturers focus on multi-format compatibility to address the region’s diverse media standards adoption. The gaming community presents a growing market segment for specialized external optical drives

Report Scope

This market research report provides a comprehensive analysis of the External ODD Market, covering the forecast period 2025–2033. It offers detailed insights into market dynamics, technological advancements, competitive landscape, and key trends shaping the industry.

Key focus areas of the report include:

  • Market Overview: The report begins with an overview outlining the current market scenario, key growth indicators, and industry transformation drivers. It discusses macroeconomic factors, demand–supply balance, regulatory landscape, and the strategic role of optical disc drives in industries such as consumer electronics, telecommunications, and data storage.
  • Market Size & Forecast: Historical data and future projections for revenue, unit shipments, and market value across major regions and segments.
  • Segmentation Analysis: Detailed breakdown by product type, interface connection, application, and end-user industry to identify high-growth segments and investment opportunities.
  • Regional Insights: Insights into market performance across North America, Europe, Asia, South America, and Middle East & Africa, including country-level analysis where relevant.
  • Competitive Landscape: Profiles of leading market participants, including their product offerings, R&D focus, manufacturing capacity, pricing strategies, and recent developments such as mergers, acquisitions, and partnerships.
  • Technology Trends & Innovation: Assessment of emerging technologies, evolving interface standards, and fabrication techniques.
  • Market Drivers & Restraints: Evaluation of factors driving market growth along with challenges, supply chain constraints, regulatory issues, and market-entry barriers.
  • Stakeholder Insights: Insights for component suppliers, OEMs, system integrators, investors, and policymakers regarding the evolving ecosystem and strategic opportunities.

Primary and secondary research methods are employed, including interviews with industry experts, data from verified sources, and real-time market intelligence to ensure the accuracy and reliability of the insights presented.

FREQUENTLY ASKED QUESTIONS:

What is the current market size of External ODD Market?

-> External ODD Market was valued at USD 1.5 billion in 2025 and is projected to reach USD 2.1 billion by 2033, exhibiting a CAGR of 4.3% during the forecast period.

Which key companies operate in External ODD Market?

-> Key players include ASUS, e-elei, Hitachi-LG Data Storage, Liteon ODD, Toshiba Samsung Storage Technology Corporation, Sony, Pioneer, HP, Buffalo, Lenovo, Dell, and STW, among others. Global top four manufacturers hold a share over 70%.

What is the largest product segment in External ODD Market?

-> The 2.0 Interface Connection segment holds the largest market share, accounting for over 95% of the global market.

What is the dominant application in External ODD Market?

-> The Portable application is the largest segment, followed by Desktop.

Which region leads the External ODD Market?

-> Asia dominates the market, with China being a key player in manufacturing and consumption of External ODD products.

External ODD Market, Global Business Strategies 2026-2033

Get Sample Report PDF for Exclusive Insights

Report Sample Includes

  • Table of Contents
  • List of Tables & Figures
  • Charts, Research Methodology, and more...
PDF Icon Download Sample Report PDF

Download Sample Report

Table of Content

1 Introduction to Research & Analysis Reports
1.1 External ODD Market Definition
1.2 Market Segments
1.2.1 Segment by Type
1.2.2 Segment by Application
1.3 Global External ODD Market Overview
1.4 Features & Benefits of This Report
1.5 Methodology & Sources of Information
1.5.1 Research Methodology
1.5.2 Research Process
1.5.3 Base Year
1.5.4 Report Assumptions & Caveats
2 Global External ODD Overall Market Size
2.1 Global External ODD Market Size: 2024 VS 2032
2.2 Global External ODD Market Size, Prospects & Forecasts: 2020-2032
2.3 Global External ODD Sales: 2020-2032
3 Company Landscape
3.1 Top External ODD Players in Global Market
3.2 Top Global External ODD Companies Ranked by Revenue
3.3 Global External ODD Revenue by Companies
3.4 Global External ODD Sales by Companies
3.5 Global External ODD Price by Manufacturer (2020-2025)
3.6 Top 3 and Top 5 External ODD Companies in Global Market, by Revenue in 2024
3.7 Global Manufacturers External ODD Product Type
3.8 Tier 1, Tier 2, and Tier 3 External ODD Players in Global Market
3.8.1 List of Global Tier 1 External ODD Companies
3.8.2 List of Global Tier 2 and Tier 3 External ODD Companies
4 Sights by Product
4.1 Overview
4.1.1 Segment by Type – Global External ODD Market Size Markets, 2024 & 2032
4.1.2 2.0 Interface Connection
4.1.3 3.0 Interface Connection
4.2 Segment by Type – Global External ODD Revenue & Forecasts
4.2.1 Segment by Type – Global External ODD Revenue, 2020-2025
4.2.2 Segment by Type – Global External ODD Revenue, 2026-2032
4.2.3 Segment by Type – Global External ODD Revenue Market Share, 2020-2032
4.3 Segment by Type – Global External ODD Sales & Forecasts
4.3.1 Segment by Type – Global External ODD Sales, 2020-2025
4.3.2 Segment by Type – Global External ODD Sales, 2026-2032
4.3.3 Segment by Type – Global External ODD Sales Market Share, 2020-2032
4.4 Segment by Type – Global External ODD Price (Manufacturers Selling Prices), 2020-2032
5 Sights by Application
5.1 Overview
5.1.1 Segment by Application – Global External ODD Market Size, 2024 & 2032
5.1.2 Portable
5.1.3 Desktop
5.1.4 Other
5.2 Segment by Application – Global External ODD Revenue & Forecasts
5.2.1 Segment by Application – Global External ODD Revenue, 2020-2025
5.2.2 Segment by Application – Global External ODD Revenue, 2026-2032
5.2.3 Segment by Application – Global External ODD Revenue Market Share, 2020-2032
5.3 Segment by Application – Global External ODD Sales & Forecasts
5.3.1 Segment by Application – Global External ODD Sales, 2020-2025
5.3.2 Segment by Application – Global External ODD Sales, 2026-2032
5.3.3 Segment by Application – Global External ODD Sales Market Share, 2020-2032
5.4 Segment by Application – Global External ODD Price (Manufacturers Selling Prices), 2020-2032
6 Sights by Region
6.1 By Region – Global External ODD Market Size, 2024 & 2032
6.2 By Region – Global External ODD Revenue & Forecasts
6.2.1 By Region – Global External ODD Revenue, 2020-2025
6.2.2 By Region – Global External ODD Revenue, 2026-2032
6.2.3 By Region – Global External ODD Revenue Market Share, 2020-2032
6.3 By Region – Global External ODD Sales & Forecasts
6.3.1 By Region – Global External ODD Sales, 2020-2025
6.3.2 By Region – Global External ODD Sales, 2026-2032
6.3.3 By Region – Global External ODD Sales Market Share, 2020-2032
6.4 North America
6.4.1 By Country – North America External ODD Revenue, 2020-2032
6.4.2 By Country – North America External ODD Sales, 2020-2032
6.4.3 United States External ODD Market Size, 2020-2032
6.4.4 Canada External ODD Market Size, 2020-2032
6.4.5 Mexico External ODD Market Size, 2020-2032
6.5 Europe
6.5.1 By Country – Europe External ODD Revenue, 2020-2032
6.5.2 By Country – Europe External ODD Sales, 2020-2032
6.5.3 Germany External ODD Market Size, 2020-2032
6.5.4 France External ODD Market Size, 2020-2032
6.5.5 U.K. External ODD Market Size, 2020-2032
6.5.6 Italy External ODD Market Size, 2020-2032
6.5.7 Russia External ODD Market Size, 2020-2032
6.5.8 Nordic Countries External ODD Market Size, 2020-2032
6.5.9 Benelux External ODD Market Size, 2020-2032
6.6 Asia
6.6.1 By Region – Asia External ODD Revenue, 2020-2032
6.6.2 By Region – Asia External ODD Sales, 2020-2032
6.6.3 China External ODD Market Size, 2020-2032
6.6.4 Japan External ODD Market Size, 2020-2032
6.6.5 South Korea External ODD Market Size, 2020-2032
6.6.6 Southeast Asia External ODD Market Size, 2020-2032
6.6.7 India External ODD Market Size, 2020-2032
6.7 South America
6.7.1 By Country – South America External ODD Revenue, 2020-2032
6.7.2 By Country – South America External ODD Sales, 2020-2032
6.7.3 Brazil External ODD Market Size, 2020-2032
6.7.4 Argentina External ODD Market Size, 2020-2032
6.8 Middle East & Africa
6.8.1 By Country – Middle East & Africa External ODD Revenue, 2020-2032
6.8.2 By Country – Middle East & Africa External ODD Sales, 2020-2032
6.8.3 Turkey External ODD Market Size, 2020-2032
6.8.4 Israel External ODD Market Size, 2020-2032
6.8.5 Saudi Arabia External ODD Market Size, 2020-2032
6.8.6 UAE External ODD Market Size, 2020-2032
7 Manufacturers & Brands Profiles
7.1 Toshiba Samsung Storage Technology Corporation
7.1.1 Toshiba Samsung Storage Technology Corporation Company Summary
7.1.2 Toshiba Samsung Storage Technology Corporation Business Overview
7.1.3 Toshiba Samsung Storage Technology Corporation External ODD Major Product Offerings
7.1.4 Toshiba Samsung Storage Technology Corporation External ODD Sales and Revenue in Global (2020-2025)
7.1.5 Toshiba Samsung Storage Technology Corporation Key News & Latest Developments
7.2 Hitachi-LG Data Storage
7.2.1 Hitachi-LG Data Storage Company Summary
7.2.2 Hitachi-LG Data Storage Business Overview
7.2.3 Hitachi-LG Data Storage External ODD Major Product Offerings
7.2.4 Hitachi-LG Data Storage External ODD Sales and Revenue in Global (2020-2025)
7.2.5 Hitachi-LG Data Storage Key News & Latest Developments
7.3 Liteon ODD
7.3.1 Liteon ODD Company Summary
7.3.2 Liteon ODD Business Overview
7.3.3 Liteon ODD External ODD Major Product Offerings
7.3.4 Liteon ODD External ODD Sales and Revenue in Global (2020-2025)
7.3.5 Liteon ODD Key News & Latest Developments
7.4 Sony
7.4.1 Sony Company Summary
7.4.2 Sony Business Overview
7.4.3 Sony External ODD Major Product Offerings
7.4.4 Sony External ODD Sales and Revenue in Global (2020-2025)
7.4.5 Sony Key News & Latest Developments
7.5 ASUS
7.5.1 ASUS Company Summary
7.5.2 ASUS Business Overview
7.5.3 ASUS External ODD Major Product Offerings
7.5.4 ASUS External ODD Sales and Revenue in Global (2020-2025)
7.5.5 ASUS Key News & Latest Developments
7.6 Pioneer
7.6.1 Pioneer Company Summary
7.6.2 Pioneer Business Overview
7.6.3 Pioneer External ODD Major Product Offerings
7.6.4 Pioneer External ODD Sales and Revenue in Global (2020-2025)
7.6.5 Pioneer Key News & Latest Developments
7.7 HP
7.7.1 HP Company Summary
7.7.2 HP Business Overview
7.7.3 HP External ODD Major Product Offerings
7.7.4 HP External ODD Sales and Revenue in Global (2020-2025)
7.7.5 HP Key News & Latest Developments
7.8 Buffalo
7.8.1 Buffalo Company Summary
7.8.2 Buffalo Business Overview
7.8.3 Buffalo External ODD Major Product Offerings
7.8.4 Buffalo External ODD Sales and Revenue in Global (2020-2025)
7.8.5 Buffalo Key News & Latest Developments
7.9 Lenovo
7.9.1 Lenovo Company Summary
7.9.2 Lenovo Business Overview
7.9.3 Lenovo External ODD Major Product Offerings
7.9.4 Lenovo External ODD Sales and Revenue in Global (2020-2025)
7.9.5 Lenovo Key News & Latest Developments
7.10 Dell
7.10.1 Dell Company Summary
7.10.2 Dell Business Overview
7.10.3 Dell External ODD Major Product Offerings
7.10.4 Dell External ODD Sales and Revenue in Global (2020-2025)
7.10.5 Dell Key News & Latest Developments
7.11 STW
7.11.1 STW Company Summary
7.11.2 STW Business Overview
7.11.3 STW External ODD Major Product Offerings
7.11.4 STW External ODD Sales and Revenue in Global (2020-2025)
7.11.5 STW Key News & Latest Developments
7.12 e-elei
7.12.1 e-elei Company Summary
7.12.2 e-elei Business Overview
7.12.3 e-elei External ODD Major Product Offerings
7.12.4 e-elei External ODD Sales and Revenue in Global (2020-2025)
7.12.5 e-elei Key News & Latest Developments
8 Global External ODD Production Capacity, Analysis
8.1 Global External ODD Production Capacity, 2020-2032
8.2 External ODD Production Capacity of Key Manufacturers in Global Market
8.3 Global External ODD Production by Region
9 Key Market Trends, Opportunity, Drivers and Restraints
9.1 Market Opportunities & Trends
9.2 Market Drivers
9.3 Market Restraints
10 External ODD Supply Chain Analysis
10.1 External ODD Industry Value Chain
10.2 External ODD Upstream Market
10.3 External ODD Downstream and Clients
10.4 Marketing Channels Analysis
10.4.1 Marketing Channels
10.4.2 External ODD Distributors and Sales Agents in Global
11 Conclusion
12 Appendix
12.1 Note
12.2 Examples of Clients
12.3 DisclaimerList of Tables
Table 1. Key Players of External ODD in Global Market
Table 2. Top External ODD Players in Global Market, Ranking by Revenue (2024)
Table 3. Global External ODD Revenue by Companies, (US$, Mn), 2020-2025
Table 4. Global External ODD Revenue Share by Companies, 2020-2025
Table 5. Global External ODD Sales by Companies, (K Units), 2020-2025
Table 6. Global External ODD Sales Share by Companies, 2020-2025
Table 7. Key Manufacturers External ODD Price (2020-2025) & (USD/Unit)
Table 8. Global Manufacturers External ODD Product Type
Table 9. List of Global Tier 1 External ODD Companies, Revenue (US$, Mn) in 2024 and Market Share
Table 10. List of Global Tier 2 and Tier 3 External ODD Companies, Revenue (US$, Mn) in 2024 and Market Share
Table 11. Segment by Type – Global External ODD Revenue, (US$, Mn), 2024 & 2032
Table 12. Segment by Type – Global External ODD Revenue (US$, Mn), 2020-2025
Table 13. Segment by Type – Global External ODD Revenue (US$, Mn), 2026-2032
Table 14. Segment by Type – Global External ODD Sales (K Units), 2020-2025
Table 15. Segment by Type – Global External ODD Sales (K Units), 2026-2032
Table 16. Segment by Application – Global External ODD Revenue, (US$, Mn), 2024 & 2032
Table 17. Segment by Application – Global External ODD Revenue, (US$, Mn), 2020-2025
Table 18. Segment by Application – Global External ODD Revenue, (US$, Mn), 2026-2032
Table 19. Segment by Application – Global External ODD Sales, (K Units), 2020-2025
Table 20. Segment by Application – Global External ODD Sales, (K Units), 2026-2032
Table 21. By Region – Global External ODD Revenue, (US$, Mn), 2025-2032
Table 22. By Region – Global External ODD Revenue, (US$, Mn), 2020-2025
Table 23. By Region – Global External ODD Revenue, (US$, Mn), 2026-2032
Table 24. By Region – Global External ODD Sales, (K Units), 2020-2025
Table 25. By Region – Global External ODD Sales, (K Units), 2026-2032
Table 26. By Country – North America External ODD Revenue, (US$, Mn), 2020-2025
Table 27. By Country – North America External ODD Revenue, (US$, Mn), 2026-2032
Table 28. By Country – North America External ODD Sales, (K Units), 2020-2025
Table 29. By Country – North America External ODD Sales, (K Units), 2026-2032
Table 30. By Country – Europe External ODD Revenue, (US$, Mn), 2020-2025
Table 31. By Country – Europe External ODD Revenue, (US$, Mn), 2026-2032
Table 32. By Country – Europe External ODD Sales, (K Units), 2020-2025
Table 33. By Country – Europe External ODD Sales, (K Units), 2026-2032
Table 34. By Region – Asia External ODD Revenue, (US$, Mn), 2020-2025
Table 35. By Region – Asia External ODD Revenue, (US$, Mn), 2026-2032
Table 36. By Region – Asia External ODD Sales, (K Units), 2020-2025
Table 37. By Region – Asia External ODD Sales, (K Units), 2026-2032
Table 38. By Country – South America External ODD Revenue, (US$, Mn), 2020-2025
Table 39. By Country – South America External ODD Revenue, (US$, Mn), 2026-2032
Table 40. By Country – South America External ODD Sales, (K Units), 2020-2025
Table 41. By Country – South America External ODD Sales, (K Units), 2026-2032
Table 42. By Country – Middle East & Africa External ODD Revenue, (US$, Mn), 2020-2025
Table 43. By Country – Middle East & Africa External ODD Revenue, (US$, Mn), 2026-2032
Table 44. By Country – Middle East & Africa External ODD Sales, (K Units), 2020-2025
Table 45. By Country – Middle East & Africa External ODD Sales, (K Units), 2026-2032
Table 46. Toshiba Samsung Storage Technology Corporation Company Summary
Table 47. Toshiba Samsung Storage Technology Corporation External ODD Product Offerings
Table 48. Toshiba Samsung Storage Technology Corporation External ODD Sales (K Units), Revenue (US$, Mn) and Average Price (USD/Unit) & (2020-2025)
Table 49. Toshiba Samsung Storage Technology Corporation Key News & Latest Developments
Table 50. Hitachi-LG Data Storage Company Summary
Table 51. Hitachi-LG Data Storage External ODD Product Offerings
Table 52. Hitachi-LG Data Storage External ODD Sales (K Units), Revenue (US$, Mn) and Average Price (USD/Unit) & (2020-2025)
Table 53. Hitachi-LG Data Storage Key News & Latest Developments
Table 54. Liteon ODD Company Summary
Table 55. Liteon ODD External ODD Product Offerings
Table 56. Liteon ODD External ODD Sales (K Units), Revenue (US$, Mn) and Average Price (USD/Unit) & (2020-2025)
Table 57. Liteon ODD Key News & Latest Developments
Table 58. Sony Company Summary
Table 59. Sony External ODD Product Offerings
Table 60. Sony External ODD Sales (K Units), Revenue (US$, Mn) and Average Price (USD/Unit) & (2020-2025)
Table 61. Sony Key News & Latest Developments
Table 62. ASUS Company Summary
Table 63. ASUS External ODD Product Offerings
Table 64. ASUS External ODD Sales (K Units), Revenue (US$, Mn) and Average Price (USD/Unit) & (2020-2025)
Table 65. ASUS Key News & Latest Developments
Table 66. Pioneer Company Summary
Table 67. Pioneer External ODD Product Offerings
Table 68. Pioneer External ODD Sales (K Units), Revenue (US$, Mn) and Average Price (USD/Unit) & (2020-2025)
Table 69. Pioneer Key News & Latest Developments
Table 70. HP Company Summary
Table 71. HP External ODD Product Offerings
Table 72. HP External ODD Sales (K Units), Revenue (US$, Mn) and Average Price (USD/Unit) & (2020-2025)
Table 73. HP Key News & Latest Developments
Table 74. Buffalo Company Summary
Table 75. Buffalo External ODD Product Offerings
Table 76. Buffalo External ODD Sales (K Units), Revenue (US$, Mn) and Average Price (USD/Unit) & (2020-2025)
Table 77. Buffalo Key News & Latest Developments
Table 78. Lenovo Company Summary
Table 79. Lenovo External ODD Product Offerings
Table 80. Lenovo External ODD Sales (K Units), Revenue (US$, Mn) and Average Price (USD/Unit) & (2020-2025)
Table 81. Lenovo Key News & Latest Developments
Table 82. Dell Company Summary
Table 83. Dell External ODD Product Offerings
Table 84. Dell External ODD Sales (K Units), Revenue (US$, Mn) and Average Price (USD/Unit) & (2020-2025)
Table 85. Dell Key News & Latest Developments
Table 86. STW Company Summary
Table 87. STW External ODD Product Offerings
Table 88. STW External ODD Sales (K Units), Revenue (US$, Mn) and Average Price (USD/Unit) & (2020-2025)
Table 89. STW Key News & Latest Developments
Table 90. e-elei Company Summary
Table 91. e-elei External ODD Product Offerings
Table 92. e-elei External ODD Sales (K Units), Revenue (US$, Mn) and Average Price (USD/Unit) & (2020-2025)
Table 93. e-elei Key News & Latest Developments
Table 94. External ODD Capacity of Key Manufacturers in Global Market, 2023-2025 (K Units)
Table 95. Global External ODD Capacity Market Share of Key Manufacturers, 2023-2025
Table 96. Global External ODD Production by Region, 2020-2025 (K Units)
Table 97. Global External ODD Production by Region, 2026-2032 (K Units)
Table 98. External ODD Market Opportunities & Trends in Global Market
Table 99. External ODD Market Drivers in Global Market
Table 100. External ODD Market Restraints in Global Market
Table 101. External ODD Raw Materials
Table 102. External ODD Raw Materials Suppliers in Global Market
Table 103. Typical External ODD Downstream
Table 104. External ODD Downstream Clients in Global Market
Table 105. External ODD Distributors and Sales Agents in Global Market

List of Figures
Figure 1. External ODD Product Picture
Figure 2. External ODD Segment by Type in 2024
Figure 3. External ODD Segment by Application in 2024
Figure 4. Global External ODD Market Overview: 2024
Figure 5. Key Caveats
Figure 6. Global External ODD Market Size: 2024 VS 2032 (US$, Mn)
Figure 7. Global External ODD Revenue: 2020-2032 (US$, Mn)
Figure 8. External ODD Sales in Global Market: 2020-2032 (K Units)
Figure 9. The Top 3 and 5 Players Market Share by External ODD Revenue in 2024
Figure 10. Segment by Type – Global External ODD Revenue, (US$, Mn), 2024 & 2032
Figure 11. Segment by Type – Global External ODD Revenue Market Share, 2020-2032
Figure 12. Segment by Type – Global External ODD Sales Market Share, 2020-2032
Figure 13. Segment by Type – Global External ODD Price (USD/Unit), 2020-2032
Figure 14. Segment by Application – Global External ODD Revenue, (US$, Mn), 2024 & 2032
Figure 15. Segment by Application – Global External ODD Revenue Market Share, 2020-2032
Figure 16. Segment by Application – Global External ODD Sales Market Share, 2020-2032
Figure 17. Segment by Application -Global External ODD Price (USD/Unit), 2020-2032
Figure 18. By Region – Global External ODD Revenue, (US$, Mn), 2025 & 2032
Figure 19. By Region – Global External ODD Revenue Market Share, 2020 VS 2024 VS 2032
Figure 20. By Region – Global External ODD Revenue Market Share, 2020-2032
Figure 21. By Region – Global External ODD Sales Market Share, 2020-2032
Figure 22. By Country – North America External ODD Revenue Market Share, 2020-2032
Figure 23. By Country – North America External ODD Sales Market Share, 2020-2032
Figure 24. United States External ODD Revenue, (US$, Mn), 2020-2032
Figure 25. Canada External ODD Revenue, (US$, Mn), 2020-2032
Figure 26. Mexico External ODD Revenue, (US$, Mn), 2020-2032
Figure 27. By Country – Europe External ODD Revenue Market Share, 2020-2032
Figure 28. By Country – Europe External ODD Sales Market Share, 2020-2032
Figure 29. Germany External ODD Revenue, (US$, Mn), 2020-2032
Figure 30. France External ODD Revenue, (US$, Mn), 2020-2032
Figure 31. U.K. External ODD Revenue, (US$, Mn), 2020-2032
Figure 32. Italy External ODD Revenue, (US$, Mn), 2020-2032
Figure 33. Russia External ODD Revenue, (US$, Mn), 2020-2032
Figure 34. Nordic Countries External ODD Revenue, (US$, Mn), 2020-2032
Figure 35. Benelux External ODD Revenue, (US$, Mn), 2020-2032
Figure 36. By Region – Asia External ODD Revenue Market Share, 2020-2032
Figure 37. By Region – Asia External ODD Sales Market Share, 2020-2032
Figure 38. China External ODD Revenue, (US$, Mn), 2020-2032
Figure 39. Japan External ODD Revenue, (US$, Mn), 2020-2032
Figure 40. South Korea External ODD Revenue, (US$, Mn), 2020-2032
Figure 41. Southeast Asia External ODD Revenue, (US$, Mn), 2020-2032
Figure 42. India External ODD Revenue, (US$, Mn), 2020-2032
Figure 43. By Country – South America External ODD Revenue Market Share, 2020-2032
Figure 44. By Country – South America External ODD Sales, Market Share, 2020-2032
Figure 45. Brazil External ODD Revenue, (US$, Mn), 2020-2032
Figure 46. Argentina External ODD Revenue, (US$, Mn), 2020-2032
Figure 47. By Country – Middle East & Africa External ODD Revenue, Market Share, 2020-2032
Figure 48. By Country – Middle East & Africa External ODD Sales, Market Share, 2020-2032
Figure 49. Turkey External ODD Revenue, (US$, Mn), 2020-2032
Figure 50. Israel External ODD Revenue, (US$, Mn), 2020-2032
Figure 51. Saudi Arabia External ODD Revenue, (US$, Mn), 2020-2032
Figure 52. UAE External ODD Revenue, (US$, Mn), 2020-2032
Figure 53. Global External ODD Production Capacity (K Units), 2020-2032
Figure 54. The Percentage of Production External ODD by Region, 2024 VS 2032
Figure 55. External ODD Industry Value Chain
Figure 56. Marketing Channels