EV Connectors Market Trends, Business Strategies 2025-2032

Global EV Connectors market size was estimated at USD 126 million in 2023 and is projected to reach USD 630.89 million by 2032, exhibiting a CAGR of 19.60% during the forecast period.

PDF Icon Download Sample Report PDF
  • Quick Dispatch

    All Orders

  • Secure Payment

    100% Secure Payment

Price range: $1,500.00 through $4,250.00

Clear

EV Connectors Market  Overview

EV (Electric Vehicle) connectors are specialized electrical connectors used to charge electric vehicles. These connectors come in various shapes and sizes to accommodate different charging standards and vehicle types. They play a crucial role in the electric vehicle charging infrastructure by providing a safe and efficient connection between the charging station and the vehicle, allowing for the transfer of electrical power to charge the vehicle’s battery.

This report provides a deep insight into the global EV Connectors market covering all its essential aspects. This ranges from a macro overview of the market to micro details of the market size, competitive landscape, development trend, niche market, key market drivers and challenges, SWOT analysis, value chain analysis, etc.

The analysis helps the reader to shape the competition within the industries and strategies for the competitive environment to enhance the potential profit. Furthermore, it provides a simple framework for evaluating and accessing the position of the business organization. The report structure also focuses on the competitive landscape of the Global EV Connectors Market, this report introduces in detail the market share, market performance, product situation, operation situation, etc. of the main players, which helps the readers in the industry to identify the main competitors and deeply understand the competition pattern of the market.
In a word, this report is a must-read for industry players, investors, researchers, consultants, business strategists, and all those who have any kind of stake or are planning to foray into the EV Connectors market in any manner.

EV Connectors Market Analysis:

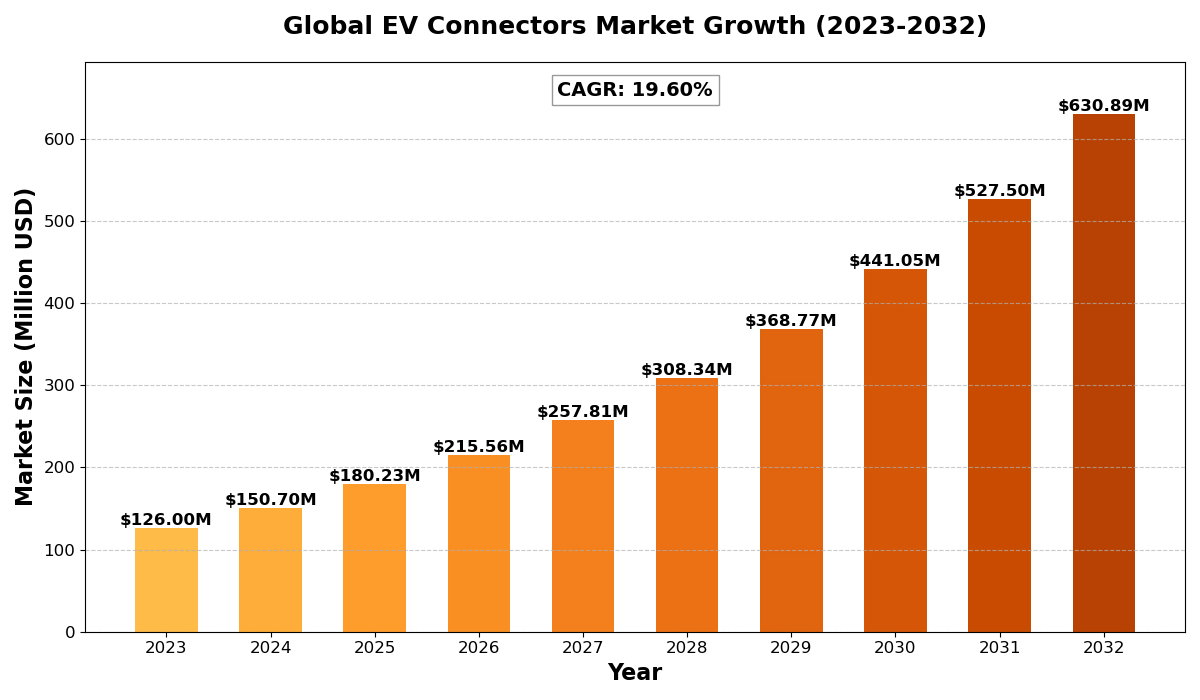
The global EV Connectors market size was estimated at USD 126 million in 2023 and is projected to reach USD 630.89 million by 2032, exhibiting a CAGR of 19.60% during the forecast period.

North America EV Connectors market size was estimated at USD 44.79 million in 2023, at a CAGR of 16.80% during the forecast period of 2025 through 2032

EV Connectors  Key Market Trends  

  1. Rising Adoption of Fast Charging Technologies
    The demand for high-speed charging solutions is driving innovations in EV connectors, enabling quicker and more efficient charging.
  2. Expansion of EV Charging Infrastructure
    Global efforts to develop robust EV charging networks are significantly boosting the demand for reliable EV connectors.
  3. Standardization of Charging Protocols
    Industry-wide moves toward standardized charging protocols are promoting compatibility and ease of use across various EV models.
  4. Growth in Wireless Charging Solutions
    Advancements in wireless EV charging technologies are creating new opportunities for connector manufacturers.
  5. Focus on Sustainability and Eco-friendly Materials
    Manufacturers are increasingly using sustainable materials and eco-friendly designs in EV connectors to reduce environmental impact.

EV Connectors Market Regional Analysis 

semi insight

  • North America:Strong demand driven by EVs, 5G infrastructure, and renewable energy, with the U.S. leading the market.
  • Europe:Growth fueled by automotive electrification, renewable energy, and strong regulatory support, with Germany as a key player.
  • Asia-Pacific:Dominates the market due to large-scale manufacturing in China and Japan, with growing demand from EVs, 5G, and semiconductors.
  • South America:Emerging market, driven by renewable energy and EV adoption, with Brazil leading growth.
  • Middle East & Africa:Gradual growth, mainly due to investments in renewable energy and EV infrastructure, with Saudi Arabia and UAE as key contributors.

EV Connectors Market Segmentation

The research report includes specific segments by region (country), manufacturers, Type, and Application. Market segmentation creates subsets of a market based on product type, end-user or application, Geographic, and other factors. By understanding the market segments, the decision-maker can leverage this targeting in the product, sales, and marketing strategies. Market segments can power your product development cycles by informing how you create product offerings for different segments.

Key Company

  • YAZAKI
  • TE CONNECTIVITY
  • SUMITOMO
  • SCHNEIDER ELECTRIC
  • HUBER+SUHNER
  • TESLA
  • BOSCH
  • ITT
  • AMPHENOL
  • SIEMENS AG
  • ABB
  • Fujikura

Market Segmentation (by Type)

  • Slow Connectors
  • Fast Connectors
  • Rapid Connectors

Market Segmentation (by Application)

  • Battery Electric Vehicles (BEVs)
  • Plug-In Hybrid Electric Vehicles (PHEVs)
  • Others

Drivers

  • Increasing Adoption of Electric Vehicles
    Growing consumer preference for EVs is driving demand for efficient and durable connectors.
  • Government Incentives and Policies
    Supportive government policies and subsidies are accelerating the deployment of EV charging stations, boosting the connector market.
  • Technological Advancements in Charging Solutions
    Innovations in fast charging and smart charging technologies are enhancing market growth.

Restraints

  • High Initial Installation Costs
    The substantial cost of setting up EV charging stations with advanced connectors can limit market expansion.
  • Compatibility Issues Across Different EV Models
    Variability in connector types and charging standards can pose challenges to universal compatibility.
  • Infrastructure Limitations in Developing Regions
    Lack of adequate EV charging infrastructure in some areas may hinder market growth.

Opportunities

  • Expansion into Emerging Markets
    Growing EV adoption in emerging economies presents significant opportunities for market growth.
  • Development of Ultra-fast Charging Technologies
    Continuous advancements in ultra-fast charging solutions open new avenues for connector innovation.
  • Integration with Renewable Energy Sources
    Combining EV charging stations with renewable energy sources offers sustainable growth prospects.

Challenges

  • Ensuring Safety and Reliability
    Maintaining high safety standards and reliability in connectors remains a critical challenge.
  • Managing Heat and Power Loads
    Handling increased power loads and heat dissipation in fast charging scenarios requires advanced engineering.
  • Intense Market Competition
    The growing number of market players increases competition and pricing pressures.

Key Benefits of This Market Research:

  • Industry drivers, restraints, and opportunities covered in the study
  • Neutral perspective on the market performance
  • Recent industry trends and developments
  • Competitive landscape & strategies of key players
  • Potential & niche segments and regions exhibiting promising growth covered
  • Historical, current, and projected market size, in terms of value
  • In-depth analysis of the EV Connectors Market Market
  • Overview of the regional outlook of the EV Connectors Market Market:

Key Reasons to Buy this Report:

  • Access to date statistics compiled by our researchers. These provide you with historical and forecast data, which is analyzed to tell you why your market is set to change
  • This enables you to anticipate market changes to remain ahead of your competitors
  • You will be able to copy data from the Excel spreadsheet straight into your marketing plans, business presentations, or other strategic documents
  • The concise analysis, clear graph, and table format will enable you to pinpoint the information you require quickly
  • Provision of market value data for each segment and sub-segment
  • Indicates the region and segment that is expected to witness the fastest growth as well as to dominate the market
  • Provides insight into the market through Value Chain
  • Market dynamics scenario, along with growth opportunities of the market in the years to come
  • 6-month post-sales analyst support

Customization of the Report
In case of any queries or customization requirements, please connect with our sales team, who will ensure that your requirements are met.

FAQs

Q: What are the key driving factors and opportunities in the global EV Connectors market?
A: Key drivers include the increasing adoption of electric vehicles, supportive government policies, and advancements in charging technologies. Opportunities lie in emerging markets, ultra-fast charging development, and renewable energy integration.


Q: Which region is projected to have the largest market share?
A: Asia-Pacific is expected to lead the market due to rapid EV adoption, government incentives, and expanding charging infrastructure.


Q: Who are the top players in the global EV Connectors market?
A: Major companies include TE Connectivity, Yazaki Corporation, Amphenol Corporation, Sumitomo Electric Industries, and ITT Inc.


Q: What are the latest technological advancements in the industry?
A: Recent innovations include ultra-fast charging connectors, wireless charging solutions, and eco-friendly connector designs.


Q: What is the current size of the global EV Connectors market?
A: The market is projected to experience significant growth from 2025 to 2032, driven by increasing EV adoption and advancements in charging technologies.


EV Connectors Market Trends, Business Strategies 2025-2032

Get Sample Report PDF for Exclusive Insights

Report Sample Includes

  • Table of Contents
  • List of Tables & Figures
  • Charts, Research Methodology, and more...
PDF Icon Download Sample Report PDF

Download Sample Report

Table of Content

Table of Contents
1 Research Methodology and Statistical Scope
1.1 Market Definition and Statistical Scope of EV Connectors
1.2 Key Market Segments
1.2.1 EV Connectors Segment by Type
1.2.2 EV Connectors Segment by Application
1.3 Methodology & Sources of Information
1.3.1 Research Methodology
1.3.2 Research Process
1.3.3 Market Breakdown and Data Triangulation
1.3.4 Base Year
1.3.5 Report Assumptions & Caveats
2 EV Connectors Market Overview
2.1 Global Market Overview
2.1.1 Global EV Connectors Market Size (M USD) Estimates and Forecasts (2019-2032)
2.1.2 Global EV Connectors Sales Estimates and Forecasts (2019-2032)
2.2 Market Segment Executive Summary
2.3 Global Market Size by Region
3 EV Connectors Market Competitive Landscape
3.1 Global EV Connectors Sales by Manufacturers (2019-2025)
3.2 Global EV Connectors Revenue Market Share by Manufacturers (2019-2025)
3.3 EV Connectors Market Share by Company Type (Tier 1, Tier 2, and Tier 3)
3.4 Global EV Connectors Average Price by Manufacturers (2019-2025)
3.5 Manufacturers EV Connectors Sales Sites, Area Served, Product Type
3.6 EV Connectors Market Competitive Situation and Trends
3.6.1 EV Connectors Market Concentration Rate
3.6.2 Global 5 and 10 Largest EV Connectors Players Market Share by Revenue
3.6.3 Mergers & Acquisitions, Expansion
4 EV Connectors Industry Chain Analysis
4.1 EV Connectors Industry Chain Analysis
4.2 Market Overview of Key Raw Materials
4.3 Midstream Market Analysis
4.4 Downstream Customer Analysis
5 The Development and Dynamics of EV Connectors Market
5.1 Key Development Trends
5.2 Driving Factors
5.3 Market Challenges
5.4 Market Restraints
5.5 Industry News
5.5.1 New Product Developments
5.5.2 Mergers & Acquisitions
5.5.3 Expansions
5.5.4 Collaboration/Supply Contracts
5.6 Industry Policies
6 EV Connectors Market Segmentation by Type
6.1 Evaluation Matrix of Segment Market Development Potential (Type)
6.2 Global EV Connectors Sales Market Share by Type (2019-2025)
6.3 Global EV Connectors Market Size Market Share by Type (2019-2025)
6.4 Global EV Connectors Price by Type (2019-2025)
7 EV Connectors Market Segmentation by Application
7.1 Evaluation Matrix of Segment Market Development Potential (Application)
7.2 Global EV Connectors Market Sales by Application (2019-2025)
7.3 Global EV Connectors Market Size (M USD) by Application (2019-2025)
7.4 Global EV Connectors Sales Growth Rate by Application (2019-2025)
8 EV Connectors Market Consumption by Region
8.1 Global EV Connectors Sales by Region
8.1.1 Global EV Connectors Sales by Region
8.1.2 Global EV Connectors Sales Market Share by Region
8.2 North America
8.2.1 North America EV Connectors Sales by Country
8.2.2 U.S.
8.2.3 Canada
8.2.4 Mexico
8.3 Europe
8.3.1 Europe EV Connectors Sales by Country
8.3.2 Germany
8.3.3 France
8.3.4 U.K.
8.3.5 Italy
8.3.6 Russia
8.4 Asia Pacific
8.4.1 Asia Pacific EV Connectors Sales by Region
8.4.2 China
8.4.3 Japan
8.4.4 South Korea
8.4.5 India
8.4.6 Southeast Asia
8.5 South America
8.5.1 South America EV Connectors Sales by Country
8.5.2 Brazil
8.5.3 Argentina
8.5.4 Columbia
8.6 Middle East and Africa
8.6.1 Middle East and Africa EV Connectors Sales by Region
8.6.2 Saudi Arabia
8.6.3 UAE
8.6.4 Egypt
8.6.5 Nigeria
8.6.6 South Africa
9 EV Connectors Market Production by Region
9.1 Global Production of EV Connectors by Region (2019-2025)
9.2 Global EV Connectors Revenue Market Share by Region (2019-2025)
9.3 Global EV Connectors Production, Revenue, Price and Gross Margin (2019-2025)
9.4 North America EV Connectors Production
9.4.1 North America EV Connectors Production Growth Rate (2019-2025)
9.4.2 North America EV Connectors Production, Revenue, Price and Gross Margin (2019-2025)
9.5 Europe EV Connectors Production
9.5.1 Europe EV Connectors Production Growth Rate (2019-2025)
9.5.2 Europe EV Connectors Production, Revenue, Price and Gross Margin (2019-2025)
9.6 Japan EV Connectors Production (2019-2025)
9.6.1 Japan EV Connectors Production Growth Rate (2019-2025)
9.6.2 Japan EV Connectors Production, Revenue, Price and Gross Margin (2019-2025)
9.7 China EV Connectors Production (2019-2025)
9.7.1 China EV Connectors Production Growth Rate (2019-2025)
9.7.2 China EV Connectors Production, Revenue, Price and Gross Margin (2019-2025)
10 Key Companies Profile
10.1 YAZAKI
10.1.1 YAZAKI EV Connectors Basic Information
10.1.2 YAZAKI EV Connectors Product Overview
10.1.3 YAZAKI EV Connectors Product Market Performance
10.1.4 YAZAKI Business Overview
10.1.5 YAZAKI EV Connectors SWOT Analysis
10.1.6 YAZAKI Recent Developments
10.2 TE CONNECTIVITY
10.2.1 TE CONNECTIVITY EV Connectors Basic Information
10.2.2 TE CONNECTIVITY EV Connectors Product Overview
10.2.3 TE CONNECTIVITY EV Connectors Product Market Performance
10.2.4 TE CONNECTIVITY Business Overview
10.2.5 TE CONNECTIVITY EV Connectors SWOT Analysis
10.2.6 TE CONNECTIVITY Recent Developments
10.3 SUMITOMO
10.3.1 SUMITOMO EV Connectors Basic Information
10.3.2 SUMITOMO EV Connectors Product Overview
10.3.3 SUMITOMO EV Connectors Product Market Performance
10.3.4 SUMITOMO EV Connectors SWOT Analysis
10.3.5 SUMITOMO Business Overview
10.3.6 SUMITOMO Recent Developments
10.4 SCHNEIDER ELECTRIC
10.4.1 SCHNEIDER ELECTRIC EV Connectors Basic Information
10.4.2 SCHNEIDER ELECTRIC EV Connectors Product Overview
10.4.3 SCHNEIDER ELECTRIC EV Connectors Product Market Performance
10.4.4 SCHNEIDER ELECTRIC Business Overview
10.4.5 SCHNEIDER ELECTRIC Recent Developments
10.5 HUBER+SUHNER
10.5.1 HUBER+SUHNER EV Connectors Basic Information
10.5.2 HUBER+SUHNER EV Connectors Product Overview
10.5.3 HUBER+SUHNER EV Connectors Product Market Performance
10.5.4 HUBER+SUHNER Business Overview
10.5.5 HUBER+SUHNER Recent Developments
10.6 TESLA
10.6.1 TESLA EV Connectors Basic Information
10.6.2 TESLA EV Connectors Product Overview
10.6.3 TESLA EV Connectors Product Market Performance
10.6.4 TESLA Business Overview
10.6.5 TESLA Recent Developments
10.7 BOSCH
10.7.1 BOSCH EV Connectors Basic Information
10.7.2 BOSCH EV Connectors Product Overview
10.7.3 BOSCH EV Connectors Product Market Performance
10.7.4 BOSCH Business Overview
10.7.5 BOSCH Recent Developments
10.8 ITT
10.8.1 ITT EV Connectors Basic Information
10.8.2 ITT EV Connectors Product Overview
10.8.3 ITT EV Connectors Product Market Performance
10.8.4 ITT Business Overview
10.8.5 ITT Recent Developments
10.9 AMPHENOL
10.9.1 AMPHENOL EV Connectors Basic Information
10.9.2 AMPHENOL EV Connectors Product Overview
10.9.3 AMPHENOL EV Connectors Product Market Performance
10.9.4 AMPHENOL Business Overview
10.9.5 AMPHENOL Recent Developments
10.10 SIEMENS AG
10.10.1 SIEMENS AG EV Connectors Basic Information
10.10.2 SIEMENS AG EV Connectors Product Overview
10.10.3 SIEMENS AG EV Connectors Product Market Performance
10.10.4 SIEMENS AG Business Overview
10.10.5 SIEMENS AG Recent Developments
10.11 ABB
10.11.1 ABB EV Connectors Basic Information
10.11.2 ABB EV Connectors Product Overview
10.11.3 ABB EV Connectors Product Market Performance
10.11.4 ABB Business Overview
10.11.5 ABB Recent Developments
10.12 Fujikura
10.12.1 Fujikura EV Connectors Basic Information
10.12.2 Fujikura EV Connectors Product Overview
10.12.3 Fujikura EV Connectors Product Market Performance
10.12.4 Fujikura Business Overview
10.12.5 Fujikura Recent Developments
11 EV Connectors Market Forecast by Region
11.1 Global EV Connectors Market Size Forecast
11.2 Global EV Connectors Market Forecast by Region
11.2.1 North America Market Size Forecast by Country
11.2.2 Europe EV Connectors Market Size Forecast by Country
11.2.3 Asia Pacific EV Connectors Market Size Forecast by Region
11.2.4 South America EV Connectors Market Size Forecast by Country
11.2.5 Middle East and Africa Forecasted Consumption of EV Connectors by Country
12 Forecast Market by Type and by Application (2025-2032)
12.1 Global EV Connectors Market Forecast by Type (2025-2032)
12.1.1 Global Forecasted Sales of EV Connectors by Type (2025-2032)
12.1.2 Global EV Connectors Market Size Forecast by Type (2025-2032)
12.1.3 Global Forecasted Price of EV Connectors by Type (2025-2032)
12.2 Global EV Connectors Market Forecast by Application (2025-2032)
12.2.1 Global EV Connectors Sales (K Units) Forecast by Application
12.2.2 Global EV Connectors Market Size (M USD) Forecast by Application (2025-2032)
13 Conclusion and Key FindingsList of Tables
Table 1. Introduction of the Type
Table 2. Introduction of the Application
Table 3. Market Size (M USD) Segment Executive Summary
Table 4. EV Connectors Market Size Comparison by Region (M USD)
Table 5. Global EV Connectors Sales (K Units) by Manufacturers (2019-2025)
Table 6. Global EV Connectors Sales Market Share by Manufacturers (2019-2025)
Table 7. Global EV Connectors Revenue (M USD) by Manufacturers (2019-2025)
Table 8. Global EV Connectors Revenue Share by Manufacturers (2019-2025)
Table 9. Company Type (Tier 1, Tier 2, and Tier 3) & (based on the Revenue in EV Connectors as of 2022)
Table 10. Global Market EV Connectors Average Price (USD/Unit) of Key Manufacturers (2019-2025)
Table 11. Manufacturers EV Connectors Sales Sites and Area Served
Table 12. Manufacturers EV Connectors Product Type
Table 13. Global EV Connectors Manufacturers Market Concentration Ratio (CR5 and HHI)
Table 14. Mergers & Acquisitions, Expansion Plans
Table 15. Industry Chain Map of EV Connectors
Table 16. Market Overview of Key Raw Materials
Table 17. Midstream Market Analysis
Table 18. Downstream Customer Analysis
Table 19. Key Development Trends
Table 20. Driving Factors
Table 21. EV Connectors Market Challenges
Table 22. Global EV Connectors Sales by Type (K Units)
Table 23. Global EV Connectors Market Size by Type (M USD)
Table 24. Global EV Connectors Sales (K Units) by Type (2019-2025)
Table 25. Global EV Connectors Sales Market Share by Type (2019-2025)
Table 26. Global EV Connectors Market Size (M USD) by Type (2019-2025)
Table 27. Global EV Connectors Market Size Share by Type (2019-2025)
Table 28. Global EV Connectors Price (USD/Unit) by Type (2019-2025)
Table 29. Global EV Connectors Sales (K Units) by Application
Table 30. Global EV Connectors Market Size by Application
Table 31. Global EV Connectors Sales by Application (2019-2025) & (K Units)
Table 32. Global EV Connectors Sales Market Share by Application (2019-2025)
Table 33. Global EV Connectors Sales by Application (2019-2025) & (M USD)
Table 34. Global EV Connectors Market Share by Application (2019-2025)
Table 35. Global EV Connectors Sales Growth Rate by Application (2019-2025)
Table 36. Global EV Connectors Sales by Region (2019-2025) & (K Units)
Table 37. Global EV Connectors Sales Market Share by Region (2019-2025)
Table 38. North America EV Connectors Sales by Country (2019-2025) & (K Units)
Table 39. Europe EV Connectors Sales by Country (2019-2025) & (K Units)
Table 40. Asia Pacific EV Connectors Sales by Region (2019-2025) & (K Units)
Table 41. South America EV Connectors Sales by Country (2019-2025) & (K Units)
Table 42. Middle East and Africa EV Connectors Sales by Region (2019-2025) & (K Units)
Table 43. Global EV Connectors Production (K Units) by Region (2019-2025)
Table 44. Global EV Connectors Revenue (US$ Million) by Region (2019-2025)
Table 45. Global EV Connectors Revenue Market Share by Region (2019-2025)
Table 46. Global EV Connectors Production (K Units), Revenue (US$ Million), Price (USD/Unit) and Gross Margin (2019-2025)
Table 47. North America EV Connectors Production (K Units), Revenue (US$ Million), Price (USD/Unit) and Gross Margin (2019-2025)
Table 48. Europe EV Connectors Production (K Units), Revenue (US$ Million), Price (USD/Unit) and Gross Margin (2019-2025)
Table 49. Japan EV Connectors Production (K Units), Revenue (US$ Million), Price (USD/Unit) and Gross Margin (2019-2025)
Table 50. China EV Connectors Production (K Units), Revenue (US$ Million), Price (USD/Unit) and Gross Margin (2019-2025)
Table 51. YAZAKI EV Connectors Basic Information
Table 52. YAZAKI EV Connectors Product Overview
Table 53. YAZAKI EV Connectors Sales (K Units), Revenue (M USD), Price (USD/Unit) and Gross Margin (2019-2025)
Table 54. YAZAKI Business Overview
Table 55. YAZAKI EV Connectors SWOT Analysis
Table 56. YAZAKI Recent Developments
Table 57. TE CONNECTIVITY EV Connectors Basic Information
Table 58. TE CONNECTIVITY EV Connectors Product Overview
Table 59. TE CONNECTIVITY EV Connectors Sales (K Units), Revenue (M USD), Price (USD/Unit) and Gross Margin (2019-2025)
Table 60. TE CONNECTIVITY Business Overview
Table 61. TE CONNECTIVITY EV Connectors SWOT Analysis
Table 62. TE CONNECTIVITY Recent Developments
Table 63. SUMITOMO EV Connectors Basic Information
Table 64. SUMITOMO EV Connectors Product Overview
Table 65. SUMITOMO EV Connectors Sales (K Units), Revenue (M USD), Price (USD/Unit) and Gross Margin (2019-2025)
Table 66. SUMITOMO EV Connectors SWOT Analysis
Table 67. SUMITOMO Business Overview
Table 68. SUMITOMO Recent Developments
Table 69. SCHNEIDER ELECTRIC EV Connectors Basic Information
Table 70. SCHNEIDER ELECTRIC EV Connectors Product Overview
Table 71. SCHNEIDER ELECTRIC EV Connectors Sales (K Units), Revenue (M USD), Price (USD/Unit) and Gross Margin (2019-2025)
Table 72. SCHNEIDER ELECTRIC Business Overview
Table 73. SCHNEIDER ELECTRIC Recent Developments
Table 74. HUBER+SUHNER EV Connectors Basic Information
Table 75. HUBER+SUHNER EV Connectors Product Overview
Table 76. HUBER+SUHNER EV Connectors Sales (K Units), Revenue (M USD), Price (USD/Unit) and Gross Margin (2019-2025)
Table 77. HUBER+SUHNER Business Overview
Table 78. HUBER+SUHNER Recent Developments
Table 79. TESLA EV Connectors Basic Information
Table 80. TESLA EV Connectors Product Overview
Table 81. TESLA EV Connectors Sales (K Units), Revenue (M USD), Price (USD/Unit) and Gross Margin (2019-2025)
Table 82. TESLA Business Overview
Table 83. TESLA Recent Developments
Table 84. BOSCH EV Connectors Basic Information
Table 85. BOSCH EV Connectors Product Overview
Table 86. BOSCH EV Connectors Sales (K Units), Revenue (M USD), Price (USD/Unit) and Gross Margin (2019-2025)
Table 87. BOSCH Business Overview
Table 88. BOSCH Recent Developments
Table 89. ITT EV Connectors Basic Information
Table 90. ITT EV Connectors Product Overview
Table 91. ITT EV Connectors Sales (K Units), Revenue (M USD), Price (USD/Unit) and Gross Margin (2019-2025)
Table 92. ITT Business Overview
Table 93. ITT Recent Developments
Table 94. AMPHENOL EV Connectors Basic Information
Table 95. AMPHENOL EV Connectors Product Overview
Table 96. AMPHENOL EV Connectors Sales (K Units), Revenue (M USD), Price (USD/Unit) and Gross Margin (2019-2025)
Table 97. AMPHENOL Business Overview
Table 98. AMPHENOL Recent Developments
Table 99. SIEMENS AG EV Connectors Basic Information
Table 100. SIEMENS AG EV Connectors Product Overview
Table 101. SIEMENS AG EV Connectors Sales (K Units), Revenue (M USD), Price (USD/Unit) and Gross Margin (2019-2025)
Table 102. SIEMENS AG Business Overview
Table 103. SIEMENS AG Recent Developments
Table 104. ABB EV Connectors Basic Information
Table 105. ABB EV Connectors Product Overview
Table 106. ABB EV Connectors Sales (K Units), Revenue (M USD), Price (USD/Unit) and Gross Margin (2019-2025)
Table 107. ABB Business Overview
Table 108. ABB Recent Developments
Table 109. Fujikura EV Connectors Basic Information
Table 110. Fujikura EV Connectors Product Overview
Table 111. Fujikura EV Connectors Sales (K Units), Revenue (M USD), Price (USD/Unit) and Gross Margin (2019-2025)
Table 112. Fujikura Business Overview
Table 113. Fujikura Recent Developments
Table 114. Global EV Connectors Sales Forecast by Region (2025-2032) & (K Units)
Table 115. Global EV Connectors Market Size Forecast by Region (2025-2032) & (M USD)
Table 116. North America EV Connectors Sales Forecast by Country (2025-2032) & (K Units)
Table 117. North America EV Connectors Market Size Forecast by Country (2025-2032) & (M USD)
Table 118. Europe EV Connectors Sales Forecast by Country (2025-2032) & (K Units)
Table 119. Europe EV Connectors Market Size Forecast by Country (2025-2032) & (M USD)
Table 120. Asia Pacific EV Connectors Sales Forecast by Region (2025-2032) & (K Units)
Table 121. Asia Pacific EV Connectors Market Size Forecast by Region (2025-2032) & (M USD)
Table 122. South America EV Connectors Sales Forecast by Country (2025-2032) & (K Units)
Table 123. South America EV Connectors Market Size Forecast by Country (2025-2032) & (M USD)
Table 124. Middle East and Africa EV Connectors Consumption Forecast by Country (2025-2032) & (Units)
Table 125. Middle East and Africa EV Connectors Market Size Forecast by Country (2025-2032) & (M USD)
Table 126. Global EV Connectors Sales Forecast by Type (2025-2032) & (K Units)
Table 127. Global EV Connectors Market Size Forecast by Type (2025-2032) & (M USD)
Table 128. Global EV Connectors Price Forecast by Type (2025-2032) & (USD/Unit)
Table 129. Global EV Connectors Sales (K Units) Forecast by Application (2025-2032)
Table 130. Global EV Connectors Market Size Forecast by Application (2025-2032) & (M USD)
List of Figures
Figure 1. Product Picture of EV Connectors
Figure 2. Data Triangulation
Figure 3. Key Caveats
Figure 4. Global EV Connectors Market Size (M USD), 2019-2032
Figure 5. Global EV Connectors Market Size (M USD) (2019-2032)
Figure 6. Global EV Connectors Sales (K Units) & (2019-2032)
Figure 7. Evaluation Matrix of Segment Market Development Potential (Type)
Figure 8. Evaluation Matrix of Segment Market Development Potential (Application)
Figure 9. Evaluation Matrix of Regional Market Development Potential
Figure 10. EV Connectors Market Size by Country (M USD)
Figure 11. EV Connectors Sales Share by Manufacturers in 2023
Figure 12. Global EV Connectors Revenue Share by Manufacturers in 2023
Figure 13. EV Connectors Market Share by Company Type (Tier 1, Tier 2 and Tier 3): 2023
Figure 14. Global Market EV Connectors Average Price (USD/Unit) of Key Manufacturers in 2023
Figure 15. The Global 5 and 10 Largest Players: Market Share by EV Connectors Revenue in 2023
Figure 16. Evaluation Matrix of Segment Market Development Potential (Type)
Figure 17. Global EV Connectors Market Share by Type
Figure 18. Sales Market Share of EV Connectors by Type (2019-2025)
Figure 19. Sales Market Share of EV Connectors by Type in 2023
Figure 20. Market Size Share of EV Connectors by Type (2019-2025)
Figure 21. Market Size Market Share of EV Connectors by Type in 2023
Figure 22. Evaluation Matrix of Segment Market Development Potential (Application)
Figure 23. Global EV Connectors Market Share by Application
Figure 24. Global EV Connectors Sales Market Share by Application (2019-2025)
Figure 25. Global EV Connectors Sales Market Share by Application in 2023
Figure 26. Global EV Connectors Market Share by Application (2019-2025)
Figure 27. Global EV Connectors Market Share by Application in 2023
Figure 28. Global EV Connectors Sales Growth Rate by Application (2019-2025)
Figure 29. Global EV Connectors Sales Market Share by Region (2019-2025)
Figure 30. North America EV Connectors Sales and Growth Rate (2019-2025) & (K Units)
Figure 31. North America EV Connectors Sales Market Share by Country in 2023
Figure 32. U.S. EV Connectors Sales and Growth Rate (2019-2025) & (K Units)
Figure 33. Canada EV Connectors Sales (K Units) and Growth Rate (2019-2025)
Figure 34. Mexico EV Connectors Sales (Units) and Growth Rate (2019-2025)
Figure 35. Europe EV Connectors Sales and Growth Rate (2019-2025) & (K Units)
Figure 36. Europe EV Connectors Sales Market Share by Country in 2023
Figure 37. Germany EV Connectors Sales and Growth Rate (2019-2025) & (K Units)
Figure 38. France EV Connectors Sales and Growth Rate (2019-2025) & (K Units)
Figure 39. U.K. EV Connectors Sales and Growth Rate (2019-2025) & (K Units)
Figure 40. Italy EV Connectors Sales and Growth Rate (2019-2025) & (K Units)
Figure 41. Russia EV Connectors Sales and Growth Rate (2019-2025) & (K Units)
Figure 42. Asia Pacific EV Connectors Sales and Growth Rate (K Units)
Figure 43. Asia Pacific EV Connectors Sales Market Share by Region in 2023
Figure 44. China EV Connectors Sales and Growth Rate (2019-2025) & (K Units)
Figure 45. Japan EV Connectors Sales and Growth Rate (2019-2025) & (K Units)
Figure 46. South Korea EV Connectors Sales and Growth Rate (2019-2025) & (K Units)
Figure 47. India EV Connectors Sales and Growth Rate (2019-2025) & (K Units)
Figure 48. Southeast Asia EV Connectors Sales and Growth Rate (2019-2025) & (K Units)
Figure 49. South America EV Connectors Sales and Growth Rate (K Units)
Figure 50. South America EV Connectors Sales Market Share by Country in 2023
Figure 51. Brazil EV Connectors Sales and Growth Rate (2019-2025) & (K Units)
Figure 52. Argentina EV Connectors Sales and Growth Rate (2019-2025) & (K Units)
Figure 53. Columbia EV Connectors Sales and Growth Rate (2019-2025) & (K Units)
Figure 54. Middle East and Africa EV Connectors Sales and Growth Rate (K Units)
Figure 55. Middle East and Africa EV Connectors Sales Market Share by Region in 2023
Figure 56. Saudi Arabia EV Connectors Sales and Growth Rate (2019-2025) & (K Units)
Figure 57. UAE EV Connectors Sales and Growth Rate (2019-2025) & (K Units)
Figure 58. Egypt EV Connectors Sales and Growth Rate (2019-2025) & (K Units)
Figure 59. Nigeria EV Connectors Sales and Growth Rate (2019-2025) & (K Units)
Figure 60. South Africa EV Connectors Sales and Growth Rate (2019-2025) & (K Units)
Figure 61. Global EV Connectors Production Market Share by Region (2019-2025)
Figure 62. North America EV Connectors Production (K Units) Growth Rate (2019-2025)
Figure 63. Europe EV Connectors Production (K Units) Growth Rate (2019-2025)
Figure 64. Japan EV Connectors Production (K Units) Growth Rate (2019-2025)
Figure 65. China EV Connectors Production (K Units) Growth Rate (2019-2025)
Figure 66. Global EV Connectors Sales Forecast by Volume (2019-2032) & (K Units)
Figure 67. Global EV Connectors Market Size Forecast by Value (2019-2032) & (M USD)
Figure 68. Global EV Connectors Sales Market Share Forecast by Type (2025-2032)
Figure 69. Global EV Connectors Market Share Forecast by Type (2025-2032)
Figure 70. Global EV Connectors Sales Forecast by Application (2025-2032)
Figure 71. Global EV Connectors Market Share Forecast by Application (2025-2032)