Endpoint and Chamber Health Monitors Market, Trends, Business Strategies 2026-2034

Global Endpoint and Chamber Health Monitors market was valued at USD 42.1 million in 2025 and is projected to reach USD 73.1 million by 2034, at a CAGR of 7.5% during the forecast period.

PDF Icon Download Sample Report PDF
  • Quick Dispatch

    All Orders

  • Secure Payment

    100% Secure Payment

Price range: $1,500.00 through $4,250.00

Clear

Endpoint and Chamber Health Monitors Market Insights

Global Endpoint and Chamber Health Monitors market size was valued at USD 42.1 million in 2025. The market is projected to grow from USD 45.3 million in 2026 to USD 73.1 million by 2034, exhibiting a CAGR of 7.5% during the forecast period.

Endpoint and Chamber Health Monitors are critical process control tools used primarily in semiconductor manufacturing and related high-precision industries like LED and photovoltaic production. These systems perform end-point detection (EPD) to precisely indicate when a specific wafer layer has been etched through or when a chamber cleaning cycle is complete, ensuring process repeatability and maximizing device yields. Incomplete processes can lead to cross-contamination and particle generation, which directly impacts production costs and product reliability.

The market growth is driven by the relentless demand for more advanced semiconductor nodes, the expansion of global wafer fabrication capacity, and the increasing complexity of deposition and etch processes that require finer control. Furthermore, the push towards Industry 4.0 and smart factory integration is fueling demand for advanced monitoring solutions that provide real-time data for predictive maintenance. Key technologies include Optical Emission Spectroscopy (OES) and Interferometry (INT). Leading players such as HORIBA, MKS Instruments, Impedans Ltd., and Inficon are actively innovating to offer more integrated and sensitive monitoring systems to meet these evolving industry demands.
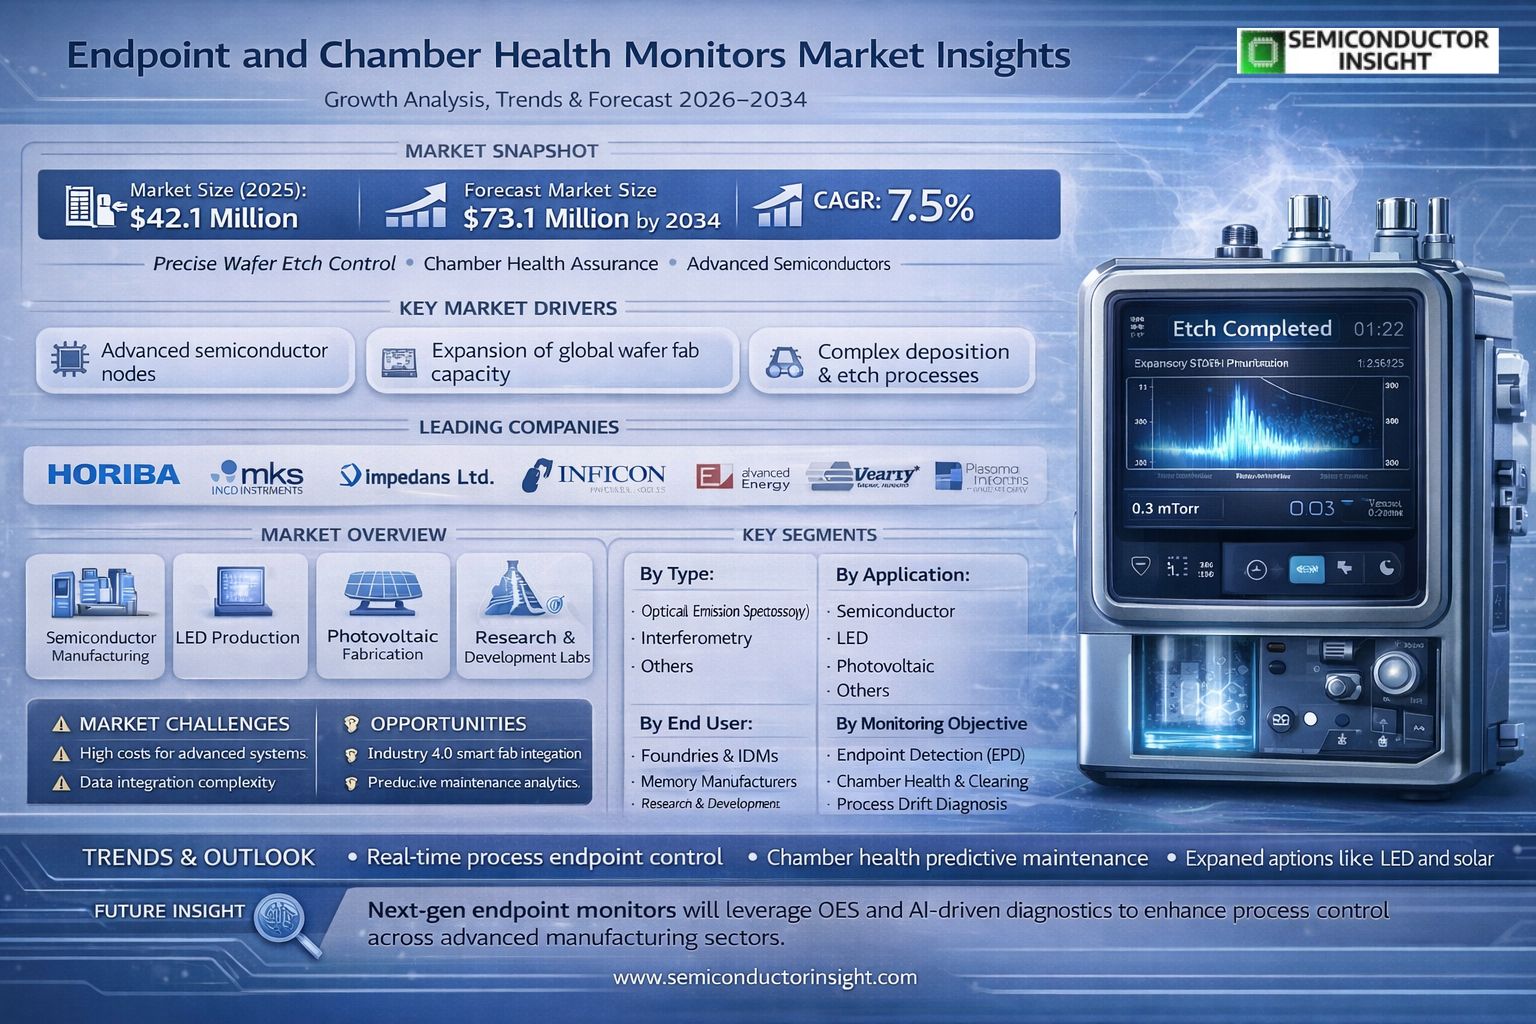
Chamber Health Monitors Market


MARKET DRIVERS

Stringent Regulatory Compliance and Quality Assurance Mandates

The primary driver for the Endpoint and Chamber Health Monitors Market is the intensifying global regulatory landscape. Agencies like the FDA and EMA enforce strict guidelines for pharmaceutical, biotechnology, and medical device manufacturing, where precise environmental control is critical. This necessitates continuous, validated monitoring of storage chambers and shipping endpoints to ensure product stability, efficacy, and safety, directly propelling demand for advanced monitoring solutions.

Expansion of Cold Chain Logistics for Biologics and Cell & Gene Therapies

The rapid growth of temperature-sensitive biologics, vaccines, and advanced therapeutic medicinal products (ATMPs) is a significant force. These high-value products often require ultra-low temperature storage and transport within narrow tolerances. The Endpoint and Chamber Health Monitors Market is expanding as companies invest in real-time monitoring systems to mitigate the substantial financial risks associated with product spoilage during transit and storage.

The integration of IoT and cloud-based platforms is revolutionizing the market, enabling predictive analytics and remote oversight of chamber conditions and shipment endpoints across global supply chains.

Furthermore, the increasing automation of laboratories and manufacturing facilities drives the adoption of networked monitoring systems. These systems provide centralized data logging, automated alerts, and comprehensive audit trails, which are essential for operational efficiency and regulatory documentation in the Endpoint and Chamber Health Monitors Market.

MARKET CHALLENGES

High Costs and Integration Complexities

A significant challenge in the Endpoint and Chamber Health Monitors Market is the substantial upfront investment required for enterprise-grade monitoring systems, coupled with ongoing calibration and maintenance costs. For small and mid-sized enterprises, this can be a barrier to adoption. Additionally, integrating new monitoring solutions with legacy laboratory information management systems (LIMS) and enterprise resource planning (ERP) platforms often presents technical and operational hurdles.

Other Challenges

Data Security and Regulatory Hurdles

As monitoring systems become more connected, ensuring robust cybersecurity for sensitive environmental and product data is paramount. Furthermore, navigating varying international regulations for medical devices and data privacy adds complexity for manufacturers operating in Global Endpoint and Chamber Health Monitors Market.

Fragmentation and Lack of Standardization

The market features a mix of sensor technologies, communication protocols, and software platforms. This fragmentation can lead to interoperability issues, making it difficult for end-users to create a seamless, unified monitoring network across different chamber types and geographic endpoints.

MARKET RESTRAINTS

Economic Volatility and Capital Expenditure Sensitivity

Budget constraints within research institutions and pharmaceutical companies during periods of economic uncertainty act as a key restraint. Capital expenditures for advanced Endpoint and Chamber Health Monitors are often scrutinized and may be deferred, favoring temporary manual logging methods over automated systems, which can slow market growth in certain regions and sectors.

Reluctance to Transition from Manual Processes

In some established facilities, a reliance on traditional, manual temperature chart recorders and periodic checks persists due to familiarity and perceived lower immediate cost. Overcoming this inertia and demonstrating the long-term ROI of digital, real-time Endpoint and Chamber Health Monitors in preventing costly deviations is an ongoing challenge for market penetration.

MARKET OPPORTUNITIES

Adoption of AI and Predictive Analytics

The integration of artificial intelligence and machine learning with monitoring data presents a major opportunity. These technologies can analyze trends from Endpoint and Chamber Health Monitors to predict equipment failures, optimize energy consumption in storage chambers, and provide actionable insights, transforming monitoring from a reactive to a proactive function.

Growth in Emerging Markets and Decentralized Trials

Increasing pharmaceutical R&D and clinical trial activity in emerging economies, along with the rise of decentralized clinical trials, creates demand for reliable, portable monitoring solutions. This expansion requires robust oversight of sample integrity at diverse endpoints and local storage chambers, opening new geographic and application avenues for market players.

Development of Multi-Parameter and Wireless Sensor Networks

There is significant opportunity in developing next-generation sensors that monitor a wider range of parameters,such as humidity, CO2, vibration, and door events,alongside temperature. Coupled with long-range, low-power wireless networks, these systems enable comprehensive, flexible, and scalable monitoring of chamber health and shipment endpoints with minimal infrastructure disruption.

Endpoint and Chamber Health Monitors Market Trends

Shift Towards Real-Time Process Control and Yield Optimization

The pivotal trend in the Endpoint and Chamber Health Monitors market is the increasing integration of these systems for real-time process control. Endpoint detection is critical for ensuring wafer etch processes achieve consistent results wafer-after-wafer, directly optimizing device yields. Manufacturers are deploying monitors to precisely signal the completion of cleaning cycles or layer etching, thereby eliminating process variability. This focus on real-time monitoring for the Endpoint and Chamber Health Monitors Market mitigates risks such as cross-contamination between plasma recipes and chamber arcing, which are major sources of particle creation and yield loss. The demand is driven by the semiconductor industry’s need for higher precision in advanced node manufacturing.

Other Trends

Dominance of Optical Emission Spectroscopy Technology

Optical Emission Spectroscopy remains the dominant technology segment within the Endpoint and Chamber Health Monitors Market. OES is favored for its ability to provide direct, in-situ analysis of plasma chemistry, offering reliable endpoint detection for a wide range of etch and deposition applications. Its continued evolution with higher sensitivity and faster data processing capabilities makes it indispensable. Alternative technologies like interferometry are applied in specific scenarios, but the versatility and proven track record of OES for chamber health monitoring solidify its leading market position for process diagnostic requirements.

Expansion into Diverse High-Tech Manufacturing Applications

While the semiconductor sector is the primary driver, significant growth for the Endpoint and Chamber Health Monitors Market is emerging from adjacent applications. The manufacturing of LEDs and photovoltaic cells relies on similar thin-film deposition and etching processes that require precise endpoint control to ensure device efficiency and longevity. This expansion beyond traditional semiconductor fabs represents a key trend, diversifying the customer base and driving innovation in monitor design to suit different process chemistries and production environments within the broader electronics supply chain.

Increasing Strategic Focus on Chamber Health and Predictive Maintenance

A significant trend is the strategic shift from merely detecting an endpoint to comprehensive chamber health monitoring. Modern Endpoint and Chamber Health Monitors are being used to track subtle shifts in process signatures over time, enabling predictive maintenance schedules. This proactive approach prevents unscheduled tool downtime by identifying chamber component degradation or seasoning issues before they impact yield. This evolution enhances overall equipment effectiveness and reduces cost of ownership, making the Endpoint and Chamber Health Monitors Market integral to fab productivity and operational intelligence strategies.

COMPETITIVE LANDSCAPE

Key Industry Players

Precision Process Control Drives Demand for Specialized Monitoring Solutions

Global Endpoint and Chamber Health Monitors market is characterized by a concentrated competitive environment with a few established leaders dominating a significant share of revenue. The market is driven by the critical need for precision in semiconductor, LED, and photovoltaic manufacturing, where Endpoint Detection (EPD) ensures process consistency, optimizes device yields, and prevents costly contamination or equipment damage. In 2025, Global top five players held a substantial collective revenue share, highlighting the market’s consolidation around companies with deep expertise in optical emission spectroscopy (OES), interferometry, and real-time plasma monitoring technologies. These key players compete on technological innovation, system reliability, integration capabilities with advanced fabrication tools, and global service networks.

Beyond the largest corporations, the landscape includes several significant niche and emerging players specializing in specific monitoring technologies or regional markets. These companies often compete by offering tailored solutions for particular etch or deposition applications, or by providing advanced diagnostics for chamber health and predictive maintenance. The competitive dynamics are further influenced by strategic mergers, acquisitions, and partnerships aimed at expanding technological portfolios and geographic reach. As the market progresses toward an estimated US$ 73.1 million by 2034, competition is intensifying not only on performance but also on providing comprehensive data analytics and connectivity for Industry 4.0 smart fab environments.

List of Key Endpoint and Chamber Health Monitors Companies Profiled

  • HORIBA
  • MKS Instruments
  • Impedans Ltd.
  • Inficon
  • Advanced Energy Industries, Inc.
  • Plasma-Therm LLC
  • Verity Instruments, Inc. (Part of Advanced Energy)
  • Nanometrics Incorporated (Now part of Onto Innovation)
  • Lasertec Corporation
  • Hitachi High-Tech Corporation
  • KLA Corporation
  • Applied Materials, Inc.
  • Lam Research Corporation
  • Tokyo Electron Limited
  • ASML Holding N.V.

Segment Analysis:

Segment Category Sub-Segments Key Insights
By Type
  • Optical Emission Spectroscopy (OES)
  • Interferometry (INT)
  • Others
Optical Emission Spectroscopy (OES) is the cornerstone technology due to its critical role in ensuring process control and yield optimization in advanced wafer fabrication.

  • Dominates as the primary method for real-time endpoint detection during etch and chamber cleaning processes, where signal sensitivity is paramount.
  • Its widespread adoption is fueled by proven reliability in preventing cross-contamination between plasma recipes, directly mitigating risks of chamber arcs and particle defects.
  • Continuous innovation by key players focuses on enhancing the spectral analysis algorithms to handle increasingly complex multi-layer semiconductor structures.
By Application
  • Semiconductor
  • LED
  • Photovoltaic
  • Others
Semiconductor manufacturing is the dominant and most technically demanding application segment, driving the majority of product development and innovation.

  • Serves as the primary market driver due to the non-negotiable requirement for precision in etching and deposition processes to achieve high device yields and consistent wafer-to-wafer results.
  • The transition to smaller process nodes and 3D architectures intensifies the need for sophisticated monitoring to detect endpoint variations invisible to less precise methods.
  • Demand is further reinforced by the critical function of chamber health monitoring in maintaining tool stability and minimizing costly unplanned maintenance in high-volume fabrication facilities.
By End User
  • Foundries & IDMs
  • Memory Manufacturers
  • Research & Development Institutes
Foundries & Integrated Device Manufacturers (IDMs) represent the core user base, characterized by high-volume production and stringent quality requirements.

  • These users have the highest adoption rate due to their large-scale operations where even minor improvements in process control translate to significant financial impact and competitive yield advantages.
  • They drive demand for integrated, robust monitoring solutions that can be seamlessly incorporated into existing and next-generation semiconductor fabrication equipment suites.
  • Their continuous investment in process technology scaling creates a persistent innovation feedback loop with monitor manufacturers, pushing the boundaries of detection sensitivity and data integration.
By Monitoring Objective
  • Endpoint Detection (EPD)
  • Chamber Health & Cleanliness
  • Process Drift & Diagnostics
Endpoint Detection (EPD) is the foundational and most critical monitoring objective, fundamentally enabling advanced semiconductor manufacturing.

  • EPD’s preeminence is directly linked to its role in signaling the completion of a precise etch step or chamber clean, which is indispensable for achieving consistent layer thickness and preventing under-or-over-etch defects.
  • This function is vital for managing complex process cycles involving chamber wall seasoning, wafer processing, and cleaning, thereby protecting product integrity and tool performance.
  • Advancements are increasingly focused on differentiating subtle spectral endpoints in multi-material stacks, which is crucial for next-generation device fabrication.
By System Integration
  • Integrated OEM Solutions
  • Retrofit & Aftermarket Systems
  • Standalone Laboratory Units
Integrated OEM Solutions are the preferred integration method for new fabrication lines, offering optimized performance and reliability.

  • This segment leads as major semiconductor equipment manufacturers increasingly bundle advanced monitoring capabilities directly into their etch and deposition tools to guarantee performance specifications.
  • Deep integration allows for superior data synchronization with the tool’s main controller, enabling faster real-time process adjustments and more sophisticated predictive maintenance algorithms.
  • The trend towards smart factories and Industry 4.0 in semiconductor fabs further solidifies the demand for natively integrated monitoring systems that feed into centralized process control frameworks.

Regional Analysis: Endpoint and Chamber Health Monitors Market

North America

The North American region, comprising the United States and Canada, is the established leader in the Endpoint and Chamber Health Monitors Market. This dominance is fueled by several interconnected factors that create a highly conducive environment for market growth and innovation. The region is characterized by a technologically advanced and highly integrated healthcare infrastructure. This sophistication drives substantial demand for precise environmental monitoring solutions in pharmaceutical manufacturing, advanced research laboratories, and high-tech hospital settings, where endpoint and chamber health monitors are critical for ensuring product quality, research integrity, and patient safety. Furthermore, the regulatory landscape is both a driver and a standard-setter; agencies enforce stringent guidelines that make detailed environmental monitoring not just a best practice but a strict compliance requirement. The concentration of leading global pharmaceutical, biotechnology, and medical device companies, alongside a culture of rapid adoption for novel technologies, provides a deep and stable customer base. This ecosystem is further supported by robust investment in research and development and the presence of key market players who continuously drive product evolution. The market is anticipated to evolve with a growing emphasis on connectivity and data analytics, integrating these monitoring systems with broader quality management and manufacturing execution systems.

Regulatory Stringency and Compliance
A primary pillar of the market in North America is the rigorous regulatory framework managed by the FDA and Health Canada. These regulations mandate continuous and validated monitoring of critical environments for temperature, humidity, particle count, and pressure. This creates a non-negotiable demand for reliable endpoint and chamber health monitoring systems within the life sciences and healthcare sectors.
Mature Pharma & Biotech Sector
The region is home to a dense concentration of major pharmaceutical and biotechnology firms engaged in complex manufacturing of biologics, vaccines, and cell therapies. These processes are exceptionally sensitive, requiring unparalleled environmental control, which makes sophisticated endpoint and chamber monitoring a core component of their production and quality assurance protocols.
Adoption of Advanced Technologies
There is an accelerated trend towards adopting smart, connected monitoring solutions. Market demand is shifting from standalone data loggers to wireless, cloud-connected systems that offer real-time alerts, predictive analytics, and seamless integration with Quality Management Systems, enhancing operational efficiency and proactive risk management.
Focus on Supply Chain Integrity
Heightened focus on the integrity of temperature-sensitive supply chains, especially for novel therapies and specialty drugs, is expanding the application of end point monitoring beyond fixed chambers. The need to monitor conditions during storage and transportation is creating new growth avenues for portable and robust monitoring devices.

Europe
Europe represents a major and highly sophisticated market for Endpoint and Chamber Health Monitors, driven by a strong pharmaceutical manufacturing base, stringent EU-wide regulatory standards, and a focus on R&D. The market is characterized by harmonized Good Manufacturing Practice guidelines that necessitate strict environmental monitoring. Key countries like Germany, France, the UK, and Switzerland, with their strong biopharma sectors, are significant contributors. A prominent trend is the integration of monitoring systems with Industry 4.0 and smart factory initiatives, aiming for fully automated and data-driven quality control. Sustainability and energy efficiency are also becoming important purchasing criteria, influencing product development. The region’s market dynamics are balanced by a mix of established multinational players and specialized local manufacturers offering tailored solutions.

Asia-Pacific
The Asia-Pacific region is the fastest-growing market for Endpoint and Chamber Health Monitors, exhibiting immense expansion potential. Growth is primarily fueled by the rapid development of pharmaceutical manufacturing capabilities, particularly in China, India, Japan, and South Korea. These countries are investing heavily in upgrading their healthcare and research infrastructure to meet both domestic and international quality standards. Increasing regulatory alignment with international norms is pushing local manufacturers to adopt sophisticated monitoring systems. Furthermore, rising investments in life sciences research, contract manufacturing, and biotechnology startups are creating new demand. The region presents a diverse landscape with varying levels of technological adoption, ranging from basic monitoring solutions to advanced connected systems in leading hubs.

South America
The South American market for Endpoint and Chamber Health Monitors is in a developing stage with steady, incremental growth. The region’s dynamics are influenced by a growing pharmaceutical industry in countries like Brazil and Argentina, which is driving the need for compliance with national and international quality standards. Market expansion is supported by government initiatives to modernize healthcare infrastructure and increase local production of medicines. However, adoption can be tempered by economic volatility and budget constraints, which sometimes prioritize essential medical equipment over advanced monitoring systems. The market currently shows higher demand for cost-effective and reliable standalone monitors, with gradual interest in networked solutions among larger, export-oriented manufacturers.

Middle East & Africa
The market in the Middle East and Africa is nascent but evolving, with growth concentrated in specific hubs and driven by strategic development plans. In the Gulf Cooperation Council countries, significant government investments are being made to establish biotech parks, advanced research centers, and pharmaceutical manufacturing zones, which are creating foundational demand for endpoint and chamber health monitoring. In other parts of Africa, the market is largely driven by the expansion of cold chain logistics for vaccines and essential medicines, highlighting the need for transport endpoint monitors. Overall, the regional market is characterized by potential for long-term growth, with current demand centered on establishing basic monitoring capabilities and building regulatory frameworks that will support future market sophistication.

Report Scope

This market research report provides a comprehensive analysis of the Endpoint and Chamber Health Monitors Market , covering the forecast period 2026–2034. It offers detailed insights into market dynamics, technological advancements, competitive landscape, and key trends shaping the industry.

Key focus areas of the report include:

  • Market Overview: The report begins with an overview outlining its current market scenario, key growth indicators, and industry transformation drivers. It discusses macroeconomic factors, demand–supply balance, regulatory landscape, and the strategic role of semiconductors in powering advancements across industries such as automotive, telecommunications, consumer electronics, and industrial automation.
  • Market Size & Forecast: Historical data and future projections for revenue, unit shipments, and market value across major regions and segments.
  • Segmentation Analysis: Detailed breakdown by product type, technology, application, and end-user industry to identify high-growth segments and investment opportunities.
  • Regional Insights: Insights into market performance across North America, Europe, Asia-Pacific, Latin America, and the Middle East & Africa, including country-level analysis where relevant.
  • Competitive Landscape: Profiles of leading market participants, including their product offerings, R&D focus, manufacturing capacity, pricing strategies, and recent developments such as mergers, acquisitions, and partnerships.
  • Technology Trends & Innovation: Assessment of emerging technologies, integration of AI/IoT, semiconductor design trends, fabrication techniques, and evolving industry standards.
  • Market Drivers & Restraints: Evaluation of factors driving market growth along with challenges, supply chain constraints, regulatory issues, and market-entry barriers.
  • Stakeholder Insights: Insights for component suppliers, OEMs, system integrators, investors, and policymakers regarding the evolving ecosystem and strategic opportunities.

Primary and secondary research methods are employed, including interviews with industry experts, data from verified sources, and real-time market intelligence to ensure the accuracy and reliability of the insights presented.

FREQUENTLY ASKED QUESTIONS:

What is the current market size of Endpoint and Chamber Health Monitors Market?

-> Global Endpoint and Chamber Health Monitors market was valued at USD 42.1 million in 2025 and is projected to reach USD 73.1 million by 2034, at a CAGR of 7.5% during the forecast period.

Which key companies operate in Endpoint and Chamber Health Monitors Market?

-> Key players include HORIBA, MKS Instruments, Impedans Ltd., and Inficon, among others.

What are the key growth drivers?

-> Key growth drivers include the essential role of end-point detection for ensuring precise wafer etch process control, preventing cross-contamination, optimizing device yields, and maintaining chamber health to avoid arcs and particle creation.

Which region dominates the market?

-> The U.S. holds a significant market size, while China is a key growing market in Global landscape.

What are the emerging trends?

-> Emerging trends include advanced monitoring technologies like Optical Emission Spectroscopy (OES) for endpoint detection and the increasing demand from semiconductor, LED, and photovoltaic manufacturing applications.

Endpoint and Chamber Health Monitors Market, Trends, Business Strategies 2026-2034

Get Sample Report PDF for Exclusive Insights

Report Sample Includes

  • Table of Contents
  • List of Tables & Figures
  • Charts, Research Methodology, and more...

PDF Icon Download Sample Report PDF
SKU: 947ba2660b51
Category:
License Type

Corporate License, Excel License, PDF and Excel Databook License

Download Sample Report

Table of Content

1 Introduction to Research & Analysis Reports
1.1 Endpoint and Chamber Health Monitors Market Definition
1.2 Market Segments
1.2.1 Segment by Type
1.2.2 Segment by Application
1.3 Global Endpoint and Chamber Health Monitors Market Overview
1.4 Features & Benefits of This Report
1.5 Methodology & Sources of Information
1.5.1 Research Methodology
1.5.2 Research Process
1.5.3 Base Year
1.5.4 Report Assumptions & Caveats
2 Global Endpoint and Chamber Health Monitors Overall Market Size
2.1 Global Endpoint and Chamber Health Monitors Market Size: 2025 VS 2034
2.2 Global Endpoint and Chamber Health Monitors Market Size, Prospects & Forecasts: 2020-2034
2.3 Global Endpoint and Chamber Health Monitors Sales: 2020-2034
3 Company Landscape
3.1 Top Endpoint and Chamber Health Monitors Players in Global Market
3.2 Top Global Endpoint and Chamber Health Monitors Companies Ranked by Revenue
3.3 Global Endpoint and Chamber Health Monitors Revenue by Companies
3.4 Global Endpoint and Chamber Health Monitors Sales by Companies
3.5 Global Endpoint and Chamber Health Monitors Price by Manufacturer (2020-2026)
3.6 Top 3 and Top 5 Endpoint and Chamber Health Monitors Companies in Global Market, by Revenue in 2025
3.7 Global Manufacturers Endpoint and Chamber Health Monitors Product Type
3.8 Tier 1, Tier 2, and Tier 3 Endpoint and Chamber Health Monitors Players in Global Market
3.8.1 List of Global Tier 1 Endpoint and Chamber Health Monitors Companies
3.8.2 List of Global Tier 2 and Tier 3 Endpoint and Chamber Health Monitors Companies
4 Sights by Product
4.1 Overview
4.1.1 Segment by Type – Global Endpoint and Chamber Health Monitors Market Size Markets, 2025 & 2034
4.1.2 Optical Emission Spectroscopy (OES)
4.1.3 Interferometry(INT)
4.1.4 Others
4.2 Segment by Type – Global Endpoint and Chamber Health Monitors Revenue & Forecasts
4.2.1 Segment by Type – Global Endpoint and Chamber Health Monitors Revenue, 2020-2026
4.2.2 Segment by Type – Global Endpoint and Chamber Health Monitors Revenue, 2026-2034
4.2.3 Segment by Type – Global Endpoint and Chamber Health Monitors Revenue Market Share, 2020-2034
4.3 Segment by Type – Global Endpoint and Chamber Health Monitors Sales & Forecasts
4.3.1 Segment by Type – Global Endpoint and Chamber Health Monitors Sales, 2020-2026
4.3.2 Segment by Type – Global Endpoint and Chamber Health Monitors Sales, 2026-2034
4.3.3 Segment by Type – Global Endpoint and Chamber Health Monitors Sales Market Share, 2020-2034
4.4 Segment by Type – Global Endpoint and Chamber Health Monitors Price (Manufacturers Selling Prices), 2020-2034
5 Sights by Application
5.1 Overview
5.1.1 Segment by Application – Global Endpoint and Chamber Health Monitors Market Size, 2025 & 2034
5.1.2 Semiconductor
5.1.3 LED
5.1.4 Photovoltaic
5.1.5 Others
5.2 Segment by Application – Global Endpoint and Chamber Health Monitors Revenue & Forecasts
5.2.1 Segment by Application – Global Endpoint and Chamber Health Monitors Revenue, 2020-2026
5.2.2 Segment by Application – Global Endpoint and Chamber Health Monitors Revenue, 2026-2034
5.2.3 Segment by Application – Global Endpoint and Chamber Health Monitors Revenue Market Share, 2020-2034
5.3 Segment by Application – Global Endpoint and Chamber Health Monitors Sales & Forecasts
5.3.1 Segment by Application – Global Endpoint and Chamber Health Monitors Sales, 2020-2026
5.3.2 Segment by Application – Global Endpoint and Chamber Health Monitors Sales, 2026-2034
5.3.3 Segment by Application – Global Endpoint and Chamber Health Monitors Sales Market Share, 2020-2034
5.4 Segment by Application – Global Endpoint and Chamber Health Monitors Price (Manufacturers Selling Prices), 2020-2034
6 Sights by Region
6.1 By Region – Global Endpoint and Chamber Health Monitors Market Size, 2025 & 2034
6.2 By Region – Global Endpoint and Chamber Health Monitors Revenue & Forecasts
6.2.1 By Region – Global Endpoint and Chamber Health Monitors Revenue, 2020-2026
6.2.2 By Region – Global Endpoint and Chamber Health Monitors Revenue, 2026-2034
6.2.3 By Region – Global Endpoint and Chamber Health Monitors Revenue Market Share, 2020-2034
6.3 By Region – Global Endpoint and Chamber Health Monitors Sales & Forecasts
6.3.1 By Region – Global Endpoint and Chamber Health Monitors Sales, 2020-2026
6.3.2 By Region – Global Endpoint and Chamber Health Monitors Sales, 2026-2034
6.3.3 By Region – Global Endpoint and Chamber Health Monitors Sales Market Share, 2020-2034
6.4 North America
6.4.1 By Country – North America Endpoint and Chamber Health Monitors Revenue, 2020-2034
6.4.2 By Country – North America Endpoint and Chamber Health Monitors Sales, 2020-2034
6.4.3 United States Endpoint and Chamber Health Monitors Market Size, 2020-2034
6.4.4 Canada Endpoint and Chamber Health Monitors Market Size, 2020-2034
6.4.5 Mexico Endpoint and Chamber Health Monitors Market Size, 2020-2034
6.5 Europe
6.5.1 By Country – Europe Endpoint and Chamber Health Monitors Revenue, 2020-2034
6.5.2 By Country – Europe Endpoint and Chamber Health Monitors Sales, 2020-2034
6.5.3 Germany Endpoint and Chamber Health Monitors Market Size, 2020-2034
6.5.4 France Endpoint and Chamber Health Monitors Market Size, 2020-2034
6.5.5 U.K. Endpoint and Chamber Health Monitors Market Size, 2020-2034
6.5.6 Italy Endpoint and Chamber Health Monitors Market Size, 2020-2034
6.5.7 Russia Endpoint and Chamber Health Monitors Market Size, 2020-2034
6.5.8 Nordic Countries Endpoint and Chamber Health Monitors Market Size, 2020-2034
6.5.9 Benelux Endpoint and Chamber Health Monitors Market Size, 2020-2034
6.6 Asia
6.6.1 By Region – Asia Endpoint and Chamber Health Monitors Revenue, 2020-2034
6.6.2 By Region – Asia Endpoint and Chamber Health Monitors Sales, 2020-2034
6.6.3 China Endpoint and Chamber Health Monitors Market Size, 2020-2034
6.6.4 Japan Endpoint and Chamber Health Monitors Market Size, 2020-2034
6.6.5 South Korea Endpoint and Chamber Health Monitors Market Size, 2020-2034
6.6.6 Southeast Asia Endpoint and Chamber Health Monitors Market Size, 2020-2034
6.6.7 India Endpoint and Chamber Health Monitors Market Size, 2020-2034
6.7 South America
6.7.1 By Country – South America Endpoint and Chamber Health Monitors Revenue, 2020-2034
6.7.2 By Country – South America Endpoint and Chamber Health Monitors Sales, 2020-2034
6.7.3 Brazil Endpoint and Chamber Health Monitors Market Size, 2020-2034
6.7.4 Argentina Endpoint and Chamber Health Monitors Market Size, 2020-2034
6.8 Middle East & Africa
6.8.1 By Country – Middle East & Africa Endpoint and Chamber Health Monitors Revenue, 2020-2034
6.8.2 By Country – Middle East & Africa Endpoint and Chamber Health Monitors Sales, 2020-2034
6.8.3 Turkey Endpoint and Chamber Health Monitors Market Size, 2020-2034
6.8.4 Israel Endpoint and Chamber Health Monitors Market Size, 2020-2034
6.8.5 Saudi Arabia Endpoint and Chamber Health Monitors Market Size, 2020-2034
6.8.6 UAE Endpoint and Chamber Health Monitors Market Size, 2020-2034
7 Manufacturers & Brands Profiles
7.1 HORIBA
7.1.1 HORIBA Company Summary
7.1.2 HORIBA Business Overview
7.1.3 HORIBA Endpoint and Chamber Health Monitors Major Product Offerings
7.1.4 HORIBA Endpoint and Chamber Health Monitors Sales and Revenue in Global (2020-2026)
7.1.5 HORIBA Key News & Latest Developments
7.2 MKS Instruments
7.2.1 MKS Instruments Company Summary
7.2.2 MKS Instruments Business Overview
7.2.3 MKS Instruments Endpoint and Chamber Health Monitors Major Product Offerings
7.2.4 MKS Instruments Endpoint and Chamber Health Monitors Sales and Revenue in Global (2020-2026)
7.2.5 MKS Instruments Key News & Latest Developments
7.3 Impedans Ltd.
7.3.1 Impedans Ltd. Company Summary
7.3.2 Impedans Ltd. Business Overview
7.3.3 Impedans Ltd. Endpoint and Chamber Health Monitors Major Product Offerings
7.3.4 Impedans Ltd. Endpoint and Chamber Health Monitors Sales and Revenue in Global (2020-2026)
7.3.5 Impedans Ltd. Key News & Latest Developments
7.4 Inficon
7.4.1 Inficon Company Summary
7.4.2 Inficon Business Overview
7.4.3 Inficon Endpoint and Chamber Health Monitors Major Product Offerings
7.4.4 Inficon Endpoint and Chamber Health Monitors Sales and Revenue in Global (2020-2026)
7.4.5 Inficon Key News & Latest Developments
8 Global Endpoint and Chamber Health Monitors Production Capacity, Analysis
8.1 Global Endpoint and Chamber Health Monitors Production Capacity, 2020-2034
8.2 Endpoint and Chamber Health Monitors Production Capacity of Key Manufacturers in Global Market
8.3 Global Endpoint and Chamber Health Monitors Production by Region
9 Key Market Trends, Opportunity, Drivers and Restraints
9.1 Market Opportunities & Trends
9.2 Market Drivers
9.3 Market Restraints
10 Endpoint and Chamber Health Monitors Supply Chain Analysis
10.1 Endpoint and Chamber Health Monitors Industry Value Chain
10.2 Endpoint and Chamber Health Monitors Upstream Market
10.3 Endpoint and Chamber Health Monitors Downstream and Clients
10.4 Marketing Channels Analysis
10.4.1 Marketing Channels
10.4.2 Endpoint and Chamber Health Monitors Distributors and Sales Agents in Global
11 Conclusion
12 Appendix
12.1 Note
12.2 Examples of Clients
12.3 DisclaimerList of Tables
Table 1. Key Players of Endpoint and Chamber Health Monitors in Global Market
Table 2. Top Endpoint and Chamber Health Monitors Players in Global Market, Ranking by Revenue (2025)
Table 3. Global Endpoint and Chamber Health Monitors Revenue by Companies, (US$, Mn), 2020-2026
Table 4. Global Endpoint and Chamber Health Monitors Revenue Share by Companies, 2020-2026
Table 5. Global Endpoint and Chamber Health Monitors Sales by Companies, (Units), 2020-2026
Table 6. Global Endpoint and Chamber Health Monitors Sales Share by Companies, 2020-2026
Table 7. Key Manufacturers Endpoint and Chamber Health Monitors Price (2020-2026) & (US$/Unit)
Table 8. Global Manufacturers Endpoint and Chamber Health Monitors Product Type
Table 9. List of Global Tier 1 Endpoint and Chamber Health Monitors Companies, Revenue (US$, Mn) in 2025 and Market Share
Table 10. List of Global Tier 2 and Tier 3 Endpoint and Chamber Health Monitors Companies, Revenue (US$, Mn) in 2025 and Market Share
Table 11. Segment by Type – Global Endpoint and Chamber Health Monitors Revenue, (US$, Mn), 2025 & 2034
Table 12. Segment by Type – Global Endpoint and Chamber Health Monitors Revenue (US$, Mn), 2020-2026
Table 13. Segment by Type – Global Endpoint and Chamber Health Monitors Revenue (US$, Mn), 2026-2034
Table 14. Segment by Type – Global Endpoint and Chamber Health Monitors Sales (Units), 2020-2026
Table 15. Segment by Type – Global Endpoint and Chamber Health Monitors Sales (Units), 2026-2034
Table 16. Segment by Application – Global Endpoint and Chamber Health Monitors Revenue, (US$, Mn), 2025 & 2034
Table 17. Segment by Application – Global Endpoint and Chamber Health Monitors Revenue, (US$, Mn), 2020-2026
Table 18. Segment by Application – Global Endpoint and Chamber Health Monitors Revenue, (US$, Mn), 2026-2034
Table 19. Segment by Application – Global Endpoint and Chamber Health Monitors Sales, (Units), 2020-2026
Table 20. Segment by Application – Global Endpoint and Chamber Health Monitors Sales, (Units), 2026-2034
Table 21. By Region – Global Endpoint and Chamber Health Monitors Revenue, (US$, Mn), 2026-2034
Table 22. By Region – Global Endpoint and Chamber Health Monitors Revenue, (US$, Mn), 2020-2026
Table 23. By Region – Global Endpoint and Chamber Health Monitors Revenue, (US$, Mn), 2026-2034
Table 24. By Region – Global Endpoint and Chamber Health Monitors Sales, (Units), 2020-2026
Table 25. By Region – Global Endpoint and Chamber Health Monitors Sales, (Units), 2026-2034
Table 26. By Country – North America Endpoint and Chamber Health Monitors Revenue, (US$, Mn), 2020-2026
Table 27. By Country – North America Endpoint and Chamber Health Monitors Revenue, (US$, Mn), 2026-2034
Table 28. By Country – North America Endpoint and Chamber Health Monitors Sales, (Units), 2020-2026
Table 29. By Country – North America Endpoint and Chamber Health Monitors Sales, (Units), 2026-2034
Table 30. By Country – Europe Endpoint and Chamber Health Monitors Revenue, (US$, Mn), 2020-2026
Table 31. By Country – Europe Endpoint and Chamber Health Monitors Revenue, (US$, Mn), 2026-2034
Table 32. By Country – Europe Endpoint and Chamber Health Monitors Sales, (Units), 2020-2026
Table 33. By Country – Europe Endpoint and Chamber Health Monitors Sales, (Units), 2026-2034
Table 34. By Region – Asia Endpoint and Chamber Health Monitors Revenue, (US$, Mn), 2020-2026
Table 35. By Region – Asia Endpoint and Chamber Health Monitors Revenue, (US$, Mn), 2026-2034
Table 36. By Region – Asia Endpoint and Chamber Health Monitors Sales, (Units), 2020-2026
Table 37. By Region – Asia Endpoint and Chamber Health Monitors Sales, (Units), 2026-2034
Table 38. By Country – South America Endpoint and Chamber Health Monitors Revenue, (US$, Mn), 2020-2026
Table 39. By Country – South America Endpoint and Chamber Health Monitors Revenue, (US$, Mn), 2026-2034
Table 40. By Country – South America Endpoint and Chamber Health Monitors Sales, (Units), 2020-2026
Table 41. By Country – South America Endpoint and Chamber Health Monitors Sales, (Units), 2026-2034
Table 42. By Country – Middle East & Africa Endpoint and Chamber Health Monitors Revenue, (US$, Mn), 2020-2026
Table 43. By Country – Middle East & Africa Endpoint and Chamber Health Monitors Revenue, (US$, Mn), 2026-2034
Table 44. By Country – Middle East & Africa Endpoint and Chamber Health Monitors Sales, (Units), 2020-2026
Table 45. By Country – Middle East & Africa Endpoint and Chamber Health Monitors Sales, (Units), 2026-2034
Table 46. HORIBA Company Summary
Table 47. HORIBA Endpoint and Chamber Health Monitors Product Offerings
Table 48. HORIBA Endpoint and Chamber Health Monitors Sales (Units), Revenue (US$, Mn) and Average Price (US$/Unit) & (2020-2026)
Table 49. HORIBA Key News & Latest Developments
Table 50. MKS Instruments Company Summary
Table 51. MKS Instruments Endpoint and Chamber Health Monitors Product Offerings
Table 52. MKS Instruments Endpoint and Chamber Health Monitors Sales (Units), Revenue (US$, Mn) and Average Price (US$/Unit) & (2020-2026)
Table 53. MKS Instruments Key News & Latest Developments
Table 54. Impedans Ltd. Company Summary
Table 55. Impedans Ltd. Endpoint and Chamber Health Monitors Product Offerings
Table 56. Impedans Ltd. Endpoint and Chamber Health Monitors Sales (Units), Revenue (US$, Mn) and Average Price (US$/Unit) & (2020-2026)
Table 57. Impedans Ltd. Key News & Latest Developments
Table 58. Inficon Company Summary
Table 59. Inficon Endpoint and Chamber Health Monitors Product Offerings
Table 60. Inficon Endpoint and Chamber Health Monitors Sales (Units), Revenue (US$, Mn) and Average Price (US$/Unit) & (2020-2026)
Table 61. Inficon Key News & Latest Developments
Table 62. Endpoint and Chamber Health Monitors Capacity of Key Manufacturers in Global Market, 2023-2026 (Units)
Table 63. Global Endpoint and Chamber Health Monitors Capacity Market Share of Key Manufacturers, 2023-2026
Table 64. Global Endpoint and Chamber Health Monitors Production by Region, 2020-2026 (Units)
Table 65. Global Endpoint and Chamber Health Monitors Production by Region, 2026-2034 (Units)
Table 66. Endpoint and Chamber Health Monitors Market Opportunities & Trends in Global Market
Table 67. Endpoint and Chamber Health Monitors Market Drivers in Global Market
Table 68. Endpoint and Chamber Health Monitors Market Restraints in Global Market
Table 69. Endpoint and Chamber Health Monitors Raw Materials
Table 70. Endpoint and Chamber Health Monitors Raw Materials Suppliers in Global Market
Table 71. Typical Endpoint and Chamber Health Monitors Downstream
Table 72. Endpoint and Chamber Health Monitors Downstream Clients in Global Market
Table 73. Endpoint and Chamber Health Monitors Distributors and Sales Agents in Global Market

List of Figures
Figure 1. Endpoint and Chamber Health Monitors Product Picture
Figure 2. Endpoint and Chamber Health Monitors Segment by Type in 2025
Figure 3. Endpoint and Chamber Health Monitors Segment by Application in 2025
Figure 4. Global Endpoint and Chamber Health Monitors Market Overview: 2025
Figure 5. Key Caveats
Figure 6. Global Endpoint and Chamber Health Monitors Market Size: 2025 VS 2034 (US$, Mn)
Figure 7. Global Endpoint and Chamber Health Monitors Revenue: 2020-2034 (US$, Mn)
Figure 8. Endpoint and Chamber Health Monitors Sales in Global Market: 2020-2034 (Units)
Figure 9. The Top 3 and 5 Players Market Share by Endpoint and Chamber Health Monitors Revenue in 2025
Figure 10. Segment by Type – Global Endpoint and Chamber Health Monitors Revenue, (US$, Mn), 2025 & 2034
Figure 11. Segment by Type – Global Endpoint and Chamber Health Monitors Revenue Market Share, 2020-2034
Figure 12. Segment by Type – Global Endpoint and Chamber Health Monitors Sales Market Share, 2020-2034
Figure 13. Segment by Type – Global Endpoint and Chamber Health Monitors Price (US$/Unit), 2020-2034
Figure 14. Segment by Application – Global Endpoint and Chamber Health Monitors Revenue, (US$, Mn), 2025 & 2034
Figure 15. Segment by Application – Global Endpoint and Chamber Health Monitors Revenue Market Share, 2020-2034
Figure 16. Segment by Application – Global Endpoint and Chamber Health Monitors Sales Market Share, 2020-2034
Figure 17. Segment by Application -Global Endpoint and Chamber Health Monitors Price (US$/Unit), 2020-2034
Figure 18. By Region – Global Endpoint and Chamber Health Monitors Revenue, (US$, Mn), 2026 & 2034
Figure 19. By Region – Global Endpoint and Chamber Health Monitors Revenue Market Share, 2020 VS 2025 VS 2034
Figure 20. By Region – Global Endpoint and Chamber Health Monitors Revenue Market Share, 2020-2034
Figure 21. By Region – Global Endpoint and Chamber Health Monitors Sales Market Share, 2020-2034
Figure 22. By Country – North America Endpoint and Chamber Health Monitors Revenue Market Share, 2020-2034
Figure 23. By Country – North America Endpoint and Chamber Health Monitors Sales Market Share, 2020-2034
Figure 24. United States Endpoint and Chamber Health Monitors Revenue, (US$, Mn), 2020-2034
Figure 25. Canada Endpoint and Chamber Health Monitors Revenue, (US$, Mn), 2020-2034
Figure 26. Mexico Endpoint and Chamber Health Monitors Revenue, (US$, Mn), 2020-2034
Figure 27. By Country – Europe Endpoint and Chamber Health Monitors Revenue Market Share, 2020-2034
Figure 28. By Country – Europe Endpoint and Chamber Health Monitors Sales Market Share, 2020-2034
Figure 29. Germany Endpoint and Chamber Health Monitors Revenue, (US$, Mn), 2020-2034
Figure 30. France Endpoint and Chamber Health Monitors Revenue, (US$, Mn), 2020-2034
Figure 31. U.K. Endpoint and Chamber Health Monitors Revenue, (US$, Mn), 2020-2034
Figure 32. Italy Endpoint and Chamber Health Monitors Revenue, (US$, Mn), 2020-2034
Figure 33. Russia Endpoint and Chamber Health Monitors Revenue, (US$, Mn), 2020-2034
Figure 34. Nordic Countries Endpoint and Chamber Health Monitors Revenue, (US$, Mn), 2020-2034
Figure 35. Benelux Endpoint and Chamber Health Monitors Revenue, (US$, Mn), 2020-2034
Figure 36. By Region – Asia Endpoint and Chamber Health Monitors Revenue Market Share, 2020-2034
Figure 37. By Region – Asia Endpoint and Chamber Health Monitors Sales Market Share, 2020-2034
Figure 38. China Endpoint and Chamber Health Monitors Revenue, (US$, Mn), 2020-2034
Figure 39. Japan Endpoint and Chamber Health Monitors Revenue, (US$, Mn), 2020-2034
Figure 40. South Korea Endpoint and Chamber Health Monitors Revenue, (US$, Mn), 2020-2034
Figure 41. Southeast Asia Endpoint and Chamber Health Monitors Revenue, (US$, Mn), 2020-2034
Figure 42. India Endpoint and Chamber Health Monitors Revenue, (US$, Mn), 2020-2034
Figure 43. By Country – South America Endpoint and Chamber Health Monitors Revenue Market Share, 2020-2034
Figure 44. By Country – South America Endpoint and Chamber Health Monitors Sales, Market Share, 2020-2034
Figure 45. Brazil Endpoint and Chamber Health Monitors Revenue, (US$, Mn), 2020-2034
Figure 46. Argentina Endpoint and Chamber Health Monitors Revenue, (US$, Mn), 2020-2034
Figure 47. By Country – Middle East & Africa Endpoint and Chamber Health Monitors Revenue, Market Share, 2020-2034
Figure 48. By Country – Middle East & Africa Endpoint and Chamber Health Monitors Sales, Market Share, 2020-2034
Figure 49. Turkey Endpoint and Chamber Health Monitors Revenue, (US$, Mn), 2020-2034
Figure 50. Israel Endpoint and Chamber Health Monitors Revenue, (US$, Mn), 2020-2034
Figure 51. Saudi Arabia Endpoint and Chamber Health Monitors Revenue, (US$, Mn), 2020-2034
Figure 52. UAE Endpoint and Chamber Health Monitors Revenue, (US$, Mn), 2020-2034
Figure 53. Global Endpoint and Chamber Health Monitors Production Capacity (Units), 2020-2034
Figure 54. The Percentage of Production Endpoint and Chamber Health Monitors by Region, 2025 VS 2034
Figure 55. Endpoint and Chamber Health Monitors Industry Value Chain
Figure 56. Marketing Channels
