Emerging Display Technology Market, Trends, Business Strategies 2025-2032

Global Emerging Display Technology market size was estimated at USD 20890 million in 2023 and is projected to reach USD 105386.70 million by 2032, exhibiting a CAGR of 19.70% during the forecast period.

PDF Icon Download Sample Report PDF
  • Quick Dispatch

    All Orders

  • Secure Payment

    100% Secure Payment

Compare

$1,500.00$4,250.00

Clear

Emerging Display Technology Market Overview

High growth of the flexible display market and rising demand for OLED-based devices are the major drivers for the display market.

This report provides a deep insight into the global Emerging Display Technology market covering all its essential aspects. This ranges from a macro overview of the market to micro details of the market size, competitive landscape, development trend, niche market, key market drivers and challenges, SWOT analysis, value chain analysis, etc.

The analysis helps the reader to shape the competition within the industries and strategies for the competitive environment to enhance the potential profit. Furthermore, it provides a simple framework for evaluating and accessing the position of the business organization. The report structure also focuses on the competitive landscape of the Global Emerging Display Technology Market, this report introduces in detail the market share, market performance, product situation, operation situation, etc. of the main players, which helps the readers in the industry to identify the main competitors and deeply understand the competition pattern of the market.
In a word, this report is a must-read for industry players, investors, researchers, consultants, business strategists, and all those who have any kind of stake or are planning to foray into the Emerging Display Technology market in any manner.

Emerging Display Technology Market Analysis:

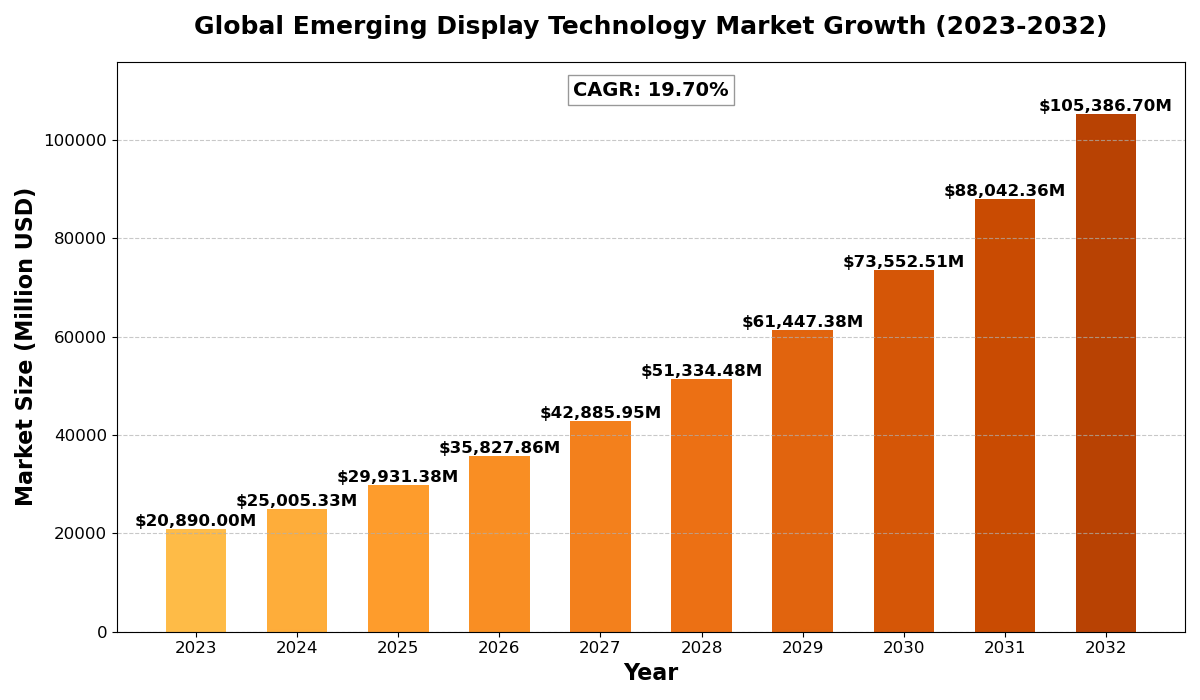
The global Emerging Display Technology market size was estimated at USD 20890 million in 2023 and is projected to reach USD 105386.70 million by 2032, exhibiting a CAGR of 19.70% during the forecast period.

North America Emerging Display Technology market size was estimated at USD 7436.83 million in 2023, at a CAGR of 16.89% during the forecast period of 2025 through 2032.

Emerging Display Technology Key Market Trends  

  1. Rise of OLED Displays
    OLED technology is leading the market due to its superior contrast, flexibility, and energy efficiency. It is widely used in smartphones, TVs, and wearable devices.

  2. Expansion of Digital Holography
    Digital holography is gaining traction in medical imaging, automotive HUDs, and entertainment, offering realistic 3D visualization without the need for special glasses.

  3. Growth of VRD and True 3D Displays
    Virtual retinal displays and true 3D display technologies are revolutionizing AR/VR applications, military simulations, and gaming by providing immersive experiences.

  4. Adoption of Flexible and Transparent Displays
    Innovations in bendable, rollable, and see-through displays are enabling futuristic applications in smart wearables and automotive dashboards.

  5. Advancements in Quantum Dot and MicroLED Technology
    Quantum dot and MicroLED displays are emerging as strong competitors to OLED, offering better brightness, longer lifespan, and improved energy efficiency.

Emerging Display Technology Market Regional Analysis :

semi insight

  • North America:Strong demand driven by EVs, 5G infrastructure, and renewable energy, with the U.S. leading the market.
  • Europe:Growth fueled by automotive electrification, renewable energy, and strong regulatory support, with Germany as a key player.
  • Asia-Pacific:Dominates the market due to large-scale manufacturing in China and Japan, with growing demand from EVs, 5G, and semiconductors.
  • South America:Emerging market, driven by renewable energy and EV adoption, with Brazil leading growth.
  • Middle East & Africa:Gradual growth, mainly due to investments in renewable energy and EV infrastructure, with Saudi Arabia and UAE as key contributors.

Emerging Display Technology Market Segmentation

The research report includes specific segments by region (country), manufacturers, Type, and Application. Market segmentation creates subsets of a market based on product type, end-user or application, Geographic, and other factors. By understanding the market segments, the decision-maker can leverage this targeting in the product, sales, and marketing strategies. Market segments can power your product development cycles by informing how you create product offerings for different segments.

Key Company

  • Ritdisplay
  • Samsung
  • Pioneer
  • Segme
  • EON Reality
  • Lyncee Tec
  • RealView Imaging
  • LEIA
  • Holoxica
  • Zebra Imaging
  • Ovizio Imaging Systems
  • Avegant
  • MicroVision

Market Segmentation (by Type)

  • OLED
  • Digital Holography
  • VRD
  • True 3D

Market Segmentation (by Application)

  • Mobile Devices
  • TVs
  • PCs

Drivers

  • Growing Demand for High-Resolution and Immersive Displays
    The rise of 4K, 8K, and 3D display technologies is fueling the demand for emerging display solutions in consumer electronics and gaming.

  • Increasing Adoption of AR and VR
    The widespread use of AR/VR in gaming, healthcare, and training simulations is driving innovations in display technology.

  • Rising Investments in Display R&D
    Companies are investing heavily in next-generation displays, including MicroLED, holographic, and quantum dot displays, to enhance performance and user experience.

Restraints

  • High Production Costs
    Advanced display technologies like OLED and digital holography involve expensive materials and complex manufacturing processes, making them costly for consumers.

  • Limited Availability of True 3D Displays
    True 3D display technology is still in its early stages, with challenges in commercialization and widespread adoption.

  • Power Consumption and Longevity Issues
    While OLED displays offer superior visuals, they can suffer from burn-in issues and shorter lifespans compared to LCD alternatives.

Opportunities

  • Expansion in Medical Imaging and Automotive Applications
    Emerging display technologies are finding applications in 3D medical imaging, heads-up displays (HUDs) for cars, and wearable health devices.

  • Growing Demand for Smart Wearables and IoT Devices
    Flexible and transparent displays are opening new possibilities for smartwatches, fitness trackers, and next-gen IoT devices.

  • Advancements in AI-Driven Display Enhancements
    AI-powered display optimization, real-time rendering, and adaptive brightness control are improving user experience across various industries.

Challenges

  • Technical Complexities in Mass Production
    Scaling up VRD, digital holography, and quantum dot displays remains a challenge due to high defect rates and production inefficiencies.

  • Intense Market Competition
    The display industry is highly competitive, with OLED, MicroLED, and quantum dot technologies competing for dominance.

  • Regulatory and Environmental Concerns
    The use of rare earth elements and hazardous materials in some display technologies raises environmental and regulatory concerns.

Key Benefits of This Market Research

  • Industry drivers, restraints, and opportunities covered in the study
  • Neutral perspective on the market performance
  • Recent industry trends and developments
  • Competitive landscape & strategies of key players
  • Potential & niche segments and regions exhibiting promising growth covered
  • Historical, current, and projected market size, in terms of value
  • In-depth analysis of the Emerging Display Technology Market
  • Overview of the regional outlook of the Emerging Display Technology Market:

Key Reasons to Buy this Report:

  • Access to date statistics compiled by our researchers. These provide you with historical and forecast data, which is analyzed to tell you why your market is set to change
  • This enables you to anticipate market changes to remain ahead of your competitors
  • You will be able to copy data from the Excel spreadsheet straight into your marketing plans, business presentations, or other strategic documents
  • The concise analysis, clear graph, and table format will enable you to pinpoint the information you require quickly
  • Provision of market value data for each segment and sub-segment
  • Indicates the region and segment that is expected to witness the fastest growth as well as to dominate the market
  • Provides insight into the market through Value Chain
  • Market dynamics scenario, along with growth opportunities of the market in the years to come
  • 6-month post-sales analyst support

Customization of the Report
In case of any queries or customization requirements, please connect with our sales team, who will ensure that your requirements are met.

FAQs

Q: What are the key driving factors and opportunities in the emerging display technology market?
A: The market is driven by demand for high-resolution displays, AR/VR adoption, and advancements in OLED, holography, and 3D display technologies. Opportunities exist in medical imaging, automotive HUDs, and AI-driven display enhancements.


Q: Which region is projected to have the largest market share?
A: Asia-Pacific is expected to dominate, driven by strong consumer electronics demand, rapid industrial growth, and major players like Samsung and LG.


Q: Who are the top players in the global emerging display technology market?
A: Key companies include Samsung, Pioneer, Ritdisplay, EON Reality, MicroVision, LEIA, and Lyncee Tec.


Q: What are the latest technological advancements in the industry?
A: Innovations include OLED advancements, MicroLED development, digital holography, true 3D display solutions, and AI-driven display optimization.


Q: What is the current size of the global emerging display technology market?
A: The market is experiencing rapid expansion, with projections indicating strong growth in OLED, holographic displays, and quantum dot technologies through 2032.

Emerging Display Technology Market, Trends, Business Strategies 2025-2032

Get Sample Report PDF for Exclusive Insights

Report Sample Includes

  • Table of Contents
  • List of Tables & Figures
  • Charts, Research Methodology, and more...
PDF Icon Download Sample Report PDF

Download Sample Report

Table of Content

Table of Contents
1 Research Methodology and Statistical Scope
1.1 Market Definition and Statistical Scope of Emerging Display Technology
1.2 Key Market Segments
1.2.1 Emerging Display Technology Segment by Type
1.2.2 Emerging Display Technology Segment by Application
1.3 Methodology & Sources of Information
1.3.1 Research Methodology
1.3.2 Research Process
1.3.3 Market Breakdown and Data Triangulation
1.3.4 Base Year
1.3.5 Report Assumptions & Caveats
2 Emerging Display Technology Market Overview
2.1 Global Market Overview
2.1.1 Global Emerging Display Technology Market Size (M USD) Estimates and Forecasts (2019-2032)
2.1.2 Global Emerging Display Technology Sales Estimates and Forecasts (2019-2032)
2.2 Market Segment Executive Summary
2.3 Global Market Size by Region
3 Emerging Display Technology Market Competitive Landscape
3.1 Global Emerging Display Technology Sales by Manufacturers (2019-2025)
3.2 Global Emerging Display Technology Revenue Market Share by Manufacturers (2019-2025)
3.3 Emerging Display Technology Market Share by Company Type (Tier 1, Tier 2, and Tier 3)
3.4 Global Emerging Display Technology Average Price by Manufacturers (2019-2025)
3.5 Manufacturers Emerging Display Technology Sales Sites, Area Served, Product Type
3.6 Emerging Display Technology Market Competitive Situation and Trends
3.6.1 Emerging Display Technology Market Concentration Rate
3.6.2 Global 5 and 10 Largest Emerging Display Technology Players Market Share by Revenue
3.6.3 Mergers & Acquisitions, Expansion
4 Emerging Display Technology Industry Chain Analysis
4.1 Emerging Display Technology Industry Chain Analysis
4.2 Market Overview of Key Raw Materials
4.3 Midstream Market Analysis
4.4 Downstream Customer Analysis
5 The Development and Dynamics of Emerging Display Technology Market
5.1 Key Development Trends
5.2 Driving Factors
5.3 Market Challenges
5.4 Market Restraints
5.5 Industry News
5.5.1 New Product Developments
5.5.2 Mergers & Acquisitions
5.5.3 Expansions
5.5.4 Collaboration/Supply Contracts
5.6 Industry Policies
6 Emerging Display Technology Market Segmentation by Type
6.1 Evaluation Matrix of Segment Market Development Potential (Type)
6.2 Global Emerging Display Technology Sales Market Share by Type (2019-2025)
6.3 Global Emerging Display Technology Market Size Market Share by Type (2019-2025)
6.4 Global Emerging Display Technology Price by Type (2019-2025)
7 Emerging Display Technology Market Segmentation by Application
7.1 Evaluation Matrix of Segment Market Development Potential (Application)
7.2 Global Emerging Display Technology Market Sales by Application (2019-2025)
7.3 Global Emerging Display Technology Market Size (M USD) by Application (2019-2025)
7.4 Global Emerging Display Technology Sales Growth Rate by Application (2019-2025)
8 Emerging Display Technology Market Consumption by Region
8.1 Global Emerging Display Technology Sales by Region
8.1.1 Global Emerging Display Technology Sales by Region
8.1.2 Global Emerging Display Technology Sales Market Share by Region
8.2 North America
8.2.1 North America Emerging Display Technology Sales by Country
8.2.2 U.S.
8.2.3 Canada
8.2.4 Mexico
8.3 Europe
8.3.1 Europe Emerging Display Technology Sales by Country
8.3.2 Germany
8.3.3 France
8.3.4 U.K.
8.3.5 Italy
8.3.6 Russia
8.4 Asia Pacific
8.4.1 Asia Pacific Emerging Display Technology Sales by Region
8.4.2 China
8.4.3 Japan
8.4.4 South Korea
8.4.5 India
8.4.6 Southeast Asia
8.5 South America
8.5.1 South America Emerging Display Technology Sales by Country
8.5.2 Brazil
8.5.3 Argentina
8.5.4 Columbia
8.6 Middle East and Africa
8.6.1 Middle East and Africa Emerging Display Technology Sales by Region
8.6.2 Saudi Arabia
8.6.3 UAE
8.6.4 Egypt
8.6.5 Nigeria
8.6.6 South Africa
9 Emerging Display Technology Market Production by Region
9.1 Global Production of Emerging Display Technology by Region (2019-2025)
9.2 Global Emerging Display Technology Revenue Market Share by Region (2019-2025)
9.3 Global Emerging Display Technology Production, Revenue, Price and Gross Margin (2019-2025)
9.4 North America Emerging Display Technology Production
9.4.1 North America Emerging Display Technology Production Growth Rate (2019-2025)
9.4.2 North America Emerging Display Technology Production, Revenue, Price and Gross Margin (2019-2025)
9.5 Europe Emerging Display Technology Production
9.5.1 Europe Emerging Display Technology Production Growth Rate (2019-2025)
9.5.2 Europe Emerging Display Technology Production, Revenue, Price and Gross Margin (2019-2025)
9.6 Japan Emerging Display Technology Production (2019-2025)
9.6.1 Japan Emerging Display Technology Production Growth Rate (2019-2025)
9.6.2 Japan Emerging Display Technology Production, Revenue, Price and Gross Margin (2019-2025)
9.7 China Emerging Display Technology Production (2019-2025)
9.7.1 China Emerging Display Technology Production Growth Rate (2019-2025)
9.7.2 China Emerging Display Technology Production, Revenue, Price and Gross Margin (2019-2025)
10 Key Companies Profile
10.1 Ritdisplay
10.1.1 Ritdisplay Emerging Display Technology Basic Information
10.1.2 Ritdisplay Emerging Display Technology Product Overview
10.1.3 Ritdisplay Emerging Display Technology Product Market Performance
10.1.4 Ritdisplay Business Overview
10.1.5 Ritdisplay Emerging Display Technology SWOT Analysis
10.1.6 Ritdisplay Recent Developments
10.2 Samsung
10.2.1 Samsung Emerging Display Technology Basic Information
10.2.2 Samsung Emerging Display Technology Product Overview
10.2.3 Samsung Emerging Display Technology Product Market Performance
10.2.4 Samsung Business Overview
10.2.5 Samsung Emerging Display Technology SWOT Analysis
10.2.6 Samsung Recent Developments
10.3 Pioneer
10.3.1 Pioneer Emerging Display Technology Basic Information
10.3.2 Pioneer Emerging Display Technology Product Overview
10.3.3 Pioneer Emerging Display Technology Product Market Performance
10.3.4 Pioneer Emerging Display Technology SWOT Analysis
10.3.5 Pioneer Business Overview
10.3.6 Pioneer Recent Developments
10.4 Segme
10.4.1 Segme Emerging Display Technology Basic Information
10.4.2 Segme Emerging Display Technology Product Overview
10.4.3 Segme Emerging Display Technology Product Market Performance
10.4.4 Segme Business Overview
10.4.5 Segme Recent Developments
10.5 EON Reality
10.5.1 EON Reality Emerging Display Technology Basic Information
10.5.2 EON Reality Emerging Display Technology Product Overview
10.5.3 EON Reality Emerging Display Technology Product Market Performance
10.5.4 EON Reality Business Overview
10.5.5 EON Reality Recent Developments
10.6 Lyncee Tec
10.6.1 Lyncee Tec Emerging Display Technology Basic Information
10.6.2 Lyncee Tec Emerging Display Technology Product Overview
10.6.3 Lyncee Tec Emerging Display Technology Product Market Performance
10.6.4 Lyncee Tec Business Overview
10.6.5 Lyncee Tec Recent Developments
10.7 RealView Imaging
10.7.1 RealView Imaging Emerging Display Technology Basic Information
10.7.2 RealView Imaging Emerging Display Technology Product Overview
10.7.3 RealView Imaging Emerging Display Technology Product Market Performance
10.7.4 RealView Imaging Business Overview
10.7.5 RealView Imaging Recent Developments
10.8 LEIA
10.8.1 LEIA Emerging Display Technology Basic Information
10.8.2 LEIA Emerging Display Technology Product Overview
10.8.3 LEIA Emerging Display Technology Product Market Performance
10.8.4 LEIA Business Overview
10.8.5 LEIA Recent Developments
10.9 Holoxica
10.9.1 Holoxica Emerging Display Technology Basic Information
10.9.2 Holoxica Emerging Display Technology Product Overview
10.9.3 Holoxica Emerging Display Technology Product Market Performance
10.9.4 Holoxica Business Overview
10.9.5 Holoxica Recent Developments
10.10 Zebra Imaging
10.10.1 Zebra Imaging Emerging Display Technology Basic Information
10.10.2 Zebra Imaging Emerging Display Technology Product Overview
10.10.3 Zebra Imaging Emerging Display Technology Product Market Performance
10.10.4 Zebra Imaging Business Overview
10.10.5 Zebra Imaging Recent Developments
10.11 Ovizio Imaging Systems
10.11.1 Ovizio Imaging Systems Emerging Display Technology Basic Information
10.11.2 Ovizio Imaging Systems Emerging Display Technology Product Overview
10.11.3 Ovizio Imaging Systems Emerging Display Technology Product Market Performance
10.11.4 Ovizio Imaging Systems Business Overview
10.11.5 Ovizio Imaging Systems Recent Developments
10.12 Avegant
10.12.1 Avegant Emerging Display Technology Basic Information
10.12.2 Avegant Emerging Display Technology Product Overview
10.12.3 Avegant Emerging Display Technology Product Market Performance
10.12.4 Avegant Business Overview
10.12.5 Avegant Recent Developments
10.13 MicroVision
10.13.1 MicroVision Emerging Display Technology Basic Information
10.13.2 MicroVision Emerging Display Technology Product Overview
10.13.3 MicroVision Emerging Display Technology Product Market Performance
10.13.4 MicroVision Business Overview
10.13.5 MicroVision Recent Developments
11 Emerging Display Technology Market Forecast by Region
11.1 Global Emerging Display Technology Market Size Forecast
11.2 Global Emerging Display Technology Market Forecast by Region
11.2.1 North America Market Size Forecast by Country
11.2.2 Europe Emerging Display Technology Market Size Forecast by Country
11.2.3 Asia Pacific Emerging Display Technology Market Size Forecast by Region
11.2.4 South America Emerging Display Technology Market Size Forecast by Country
11.2.5 Middle East and Africa Forecasted Consumption of Emerging Display Technology by Country
12 Forecast Market by Type and by Application (2025-2032)
12.1 Global Emerging Display Technology Market Forecast by Type (2025-2032)
12.1.1 Global Forecasted Sales of Emerging Display Technology by Type (2025-2032)
12.1.2 Global Emerging Display Technology Market Size Forecast by Type (2025-2032)
12.1.3 Global Forecasted Price of Emerging Display Technology by Type (2025-2032)
12.2 Global Emerging Display Technology Market Forecast by Application (2025-2032)
12.2.1 Global Emerging Display Technology Sales (K Units) Forecast by Application
12.2.2 Global Emerging Display Technology Market Size (M USD) Forecast by Application (2025-2032)
13 Conclusion and Key FindingsList of Tables
Table 1. Introduction of the Type
Table 2. Introduction of the Application
Table 3. Market Size (M USD) Segment Executive Summary
Table 4. Emerging Display Technology Market Size Comparison by Region (M USD)
Table 5. Global Emerging Display Technology Sales (K Units) by Manufacturers (2019-2025)
Table 6. Global Emerging Display Technology Sales Market Share by Manufacturers (2019-2025)
Table 7. Global Emerging Display Technology Revenue (M USD) by Manufacturers (2019-2025)
Table 8. Global Emerging Display Technology Revenue Share by Manufacturers (2019-2025)
Table 9. Company Type (Tier 1, Tier 2, and Tier 3) & (based on the Revenue in Emerging Display Technology as of 2022)
Table 10. Global Market Emerging Display Technology Average Price (USD/Unit) of Key Manufacturers (2019-2025)
Table 11. Manufacturers Emerging Display Technology Sales Sites and Area Served
Table 12. Manufacturers Emerging Display Technology Product Type
Table 13. Global Emerging Display Technology Manufacturers Market Concentration Ratio (CR5 and HHI)
Table 14. Mergers & Acquisitions, Expansion Plans
Table 15. Industry Chain Map of Emerging Display Technology
Table 16. Market Overview of Key Raw Materials
Table 17. Midstream Market Analysis
Table 18. Downstream Customer Analysis
Table 19. Key Development Trends
Table 20. Driving Factors
Table 21. Emerging Display Technology Market Challenges
Table 22. Global Emerging Display Technology Sales by Type (K Units)
Table 23. Global Emerging Display Technology Market Size by Type (M USD)
Table 24. Global Emerging Display Technology Sales (K Units) by Type (2019-2025)
Table 25. Global Emerging Display Technology Sales Market Share by Type (2019-2025)
Table 26. Global Emerging Display Technology Market Size (M USD) by Type (2019-2025)
Table 27. Global Emerging Display Technology Market Size Share by Type (2019-2025)
Table 28. Global Emerging Display Technology Price (USD/Unit) by Type (2019-2025)
Table 29. Global Emerging Display Technology Sales (K Units) by Application
Table 30. Global Emerging Display Technology Market Size by Application
Table 31. Global Emerging Display Technology Sales by Application (2019-2025) & (K Units)
Table 32. Global Emerging Display Technology Sales Market Share by Application (2019-2025)
Table 33. Global Emerging Display Technology Sales by Application (2019-2025) & (M USD)
Table 34. Global Emerging Display Technology Market Share by Application (2019-2025)
Table 35. Global Emerging Display Technology Sales Growth Rate by Application (2019-2025)
Table 36. Global Emerging Display Technology Sales by Region (2019-2025) & (K Units)
Table 37. Global Emerging Display Technology Sales Market Share by Region (2019-2025)
Table 38. North America Emerging Display Technology Sales by Country (2019-2025) & (K Units)
Table 39. Europe Emerging Display Technology Sales by Country (2019-2025) & (K Units)
Table 40. Asia Pacific Emerging Display Technology Sales by Region (2019-2025) & (K Units)
Table 41. South America Emerging Display Technology Sales by Country (2019-2025) & (K Units)
Table 42. Middle East and Africa Emerging Display Technology Sales by Region (2019-2025) & (K Units)
Table 43. Global Emerging Display Technology Production (K Units) by Region (2019-2025)
Table 44. Global Emerging Display Technology Revenue (US$ Million) by Region (2019-2025)
Table 45. Global Emerging Display Technology Revenue Market Share by Region (2019-2025)
Table 46. Global Emerging Display Technology Production (K Units), Revenue (US$ Million), Price (USD/Unit) and Gross Margin (2019-2025)
Table 47. North America Emerging Display Technology Production (K Units), Revenue (US$ Million), Price (USD/Unit) and Gross Margin (2019-2025)
Table 48. Europe Emerging Display Technology Production (K Units), Revenue (US$ Million), Price (USD/Unit) and Gross Margin (2019-2025)
Table 49. Japan Emerging Display Technology Production (K Units), Revenue (US$ Million), Price (USD/Unit) and Gross Margin (2019-2025)
Table 50. China Emerging Display Technology Production (K Units), Revenue (US$ Million), Price (USD/Unit) and Gross Margin (2019-2025)
Table 51. Ritdisplay Emerging Display Technology Basic Information
Table 52. Ritdisplay Emerging Display Technology Product Overview
Table 53. Ritdisplay Emerging Display Technology Sales (K Units), Revenue (M USD), Price (USD/Unit) and Gross Margin (2019-2025)
Table 54. Ritdisplay Business Overview
Table 55. Ritdisplay Emerging Display Technology SWOT Analysis
Table 56. Ritdisplay Recent Developments
Table 57. Samsung Emerging Display Technology Basic Information
Table 58. Samsung Emerging Display Technology Product Overview
Table 59. Samsung Emerging Display Technology Sales (K Units), Revenue (M USD), Price (USD/Unit) and Gross Margin (2019-2025)
Table 60. Samsung Business Overview
Table 61. Samsung Emerging Display Technology SWOT Analysis
Table 62. Samsung Recent Developments
Table 63. Pioneer Emerging Display Technology Basic Information
Table 64. Pioneer Emerging Display Technology Product Overview
Table 65. Pioneer Emerging Display Technology Sales (K Units), Revenue (M USD), Price (USD/Unit) and Gross Margin (2019-2025)
Table 66. Pioneer Emerging Display Technology SWOT Analysis
Table 67. Pioneer Business Overview
Table 68. Pioneer Recent Developments
Table 69. Segme Emerging Display Technology Basic Information
Table 70. Segme Emerging Display Technology Product Overview
Table 71. Segme Emerging Display Technology Sales (K Units), Revenue (M USD), Price (USD/Unit) and Gross Margin (2019-2025)
Table 72. Segme Business Overview
Table 73. Segme Recent Developments
Table 74. EON Reality Emerging Display Technology Basic Information
Table 75. EON Reality Emerging Display Technology Product Overview
Table 76. EON Reality Emerging Display Technology Sales (K Units), Revenue (M USD), Price (USD/Unit) and Gross Margin (2019-2025)
Table 77. EON Reality Business Overview
Table 78. EON Reality Recent Developments
Table 79. Lyncee Tec Emerging Display Technology Basic Information
Table 80. Lyncee Tec Emerging Display Technology Product Overview
Table 81. Lyncee Tec Emerging Display Technology Sales (K Units), Revenue (M USD), Price (USD/Unit) and Gross Margin (2019-2025)
Table 82. Lyncee Tec Business Overview
Table 83. Lyncee Tec Recent Developments
Table 84. RealView Imaging Emerging Display Technology Basic Information
Table 85. RealView Imaging Emerging Display Technology Product Overview
Table 86. RealView Imaging Emerging Display Technology Sales (K Units), Revenue (M USD), Price (USD/Unit) and Gross Margin (2019-2025)
Table 87. RealView Imaging Business Overview
Table 88. RealView Imaging Recent Developments
Table 89. LEIA Emerging Display Technology Basic Information
Table 90. LEIA Emerging Display Technology Product Overview
Table 91. LEIA Emerging Display Technology Sales (K Units), Revenue (M USD), Price (USD/Unit) and Gross Margin (2019-2025)
Table 92. LEIA Business Overview
Table 93. LEIA Recent Developments
Table 94. Holoxica Emerging Display Technology Basic Information
Table 95. Holoxica Emerging Display Technology Product Overview
Table 96. Holoxica Emerging Display Technology Sales (K Units), Revenue (M USD), Price (USD/Unit) and Gross Margin (2019-2025)
Table 97. Holoxica Business Overview
Table 98. Holoxica Recent Developments
Table 99. Zebra Imaging Emerging Display Technology Basic Information
Table 100. Zebra Imaging Emerging Display Technology Product Overview
Table 101. Zebra Imaging Emerging Display Technology Sales (K Units), Revenue (M USD), Price (USD/Unit) and Gross Margin (2019-2025)
Table 102. Zebra Imaging Business Overview
Table 103. Zebra Imaging Recent Developments
Table 104. Ovizio Imaging Systems Emerging Display Technology Basic Information
Table 105. Ovizio Imaging Systems Emerging Display Technology Product Overview
Table 106. Ovizio Imaging Systems Emerging Display Technology Sales (K Units), Revenue (M USD), Price (USD/Unit) and Gross Margin (2019-2025)
Table 107. Ovizio Imaging Systems Business Overview
Table 108. Ovizio Imaging Systems Recent Developments
Table 109. Avegant Emerging Display Technology Basic Information
Table 110. Avegant Emerging Display Technology Product Overview
Table 111. Avegant Emerging Display Technology Sales (K Units), Revenue (M USD), Price (USD/Unit) and Gross Margin (2019-2025)
Table 112. Avegant Business Overview
Table 113. Avegant Recent Developments
Table 114. MicroVision Emerging Display Technology Basic Information
Table 115. MicroVision Emerging Display Technology Product Overview
Table 116. MicroVision Emerging Display Technology Sales (K Units), Revenue (M USD), Price (USD/Unit) and Gross Margin (2019-2025)
Table 117. MicroVision Business Overview
Table 118. MicroVision Recent Developments
Table 119. Global Emerging Display Technology Sales Forecast by Region (2025-2032) & (K Units)
Table 120. Global Emerging Display Technology Market Size Forecast by Region (2025-2032) & (M USD)
Table 121. North America Emerging Display Technology Sales Forecast by Country (2025-2032) & (K Units)
Table 122. North America Emerging Display Technology Market Size Forecast by Country (2025-2032) & (M USD)
Table 123. Europe Emerging Display Technology Sales Forecast by Country (2025-2032) & (K Units)
Table 124. Europe Emerging Display Technology Market Size Forecast by Country (2025-2032) & (M USD)
Table 125. Asia Pacific Emerging Display Technology Sales Forecast by Region (2025-2032) & (K Units)
Table 126. Asia Pacific Emerging Display Technology Market Size Forecast by Region (2025-2032) & (M USD)
Table 127. South America Emerging Display Technology Sales Forecast by Country (2025-2032) & (K Units)
Table 128. South America Emerging Display Technology Market Size Forecast by Country (2025-2032) & (M USD)
Table 129. Middle East and Africa Emerging Display Technology Consumption Forecast by Country (2025-2032) & (Units)
Table 130. Middle East and Africa Emerging Display Technology Market Size Forecast by Country (2025-2032) & (M USD)
Table 131. Global Emerging Display Technology Sales Forecast by Type (2025-2032) & (K Units)
Table 132. Global Emerging Display Technology Market Size Forecast by Type (2025-2032) & (M USD)
Table 133. Global Emerging Display Technology Price Forecast by Type (2025-2032) & (USD/Unit)
Table 134. Global Emerging Display Technology Sales (K Units) Forecast by Application (2025-2032)
Table 135. Global Emerging Display Technology Market Size Forecast by Application (2025-2032) & (M USD)
List of Figures
Figure 1. Product Picture of Emerging Display Technology
Figure 2. Data Triangulation
Figure 3. Key Caveats
Figure 4. Global Emerging Display Technology Market Size (M USD), 2019-2032
Figure 5. Global Emerging Display Technology Market Size (M USD) (2019-2032)
Figure 6. Global Emerging Display Technology Sales (K Units) & (2019-2032)
Figure 7. Evaluation Matrix of Segment Market Development Potential (Type)
Figure 8. Evaluation Matrix of Segment Market Development Potential (Application)
Figure 9. Evaluation Matrix of Regional Market Development Potential
Figure 10. Emerging Display Technology Market Size by Country (M USD)
Figure 11. Emerging Display Technology Sales Share by Manufacturers in 2023
Figure 12. Global Emerging Display Technology Revenue Share by Manufacturers in 2023
Figure 13. Emerging Display Technology Market Share by Company Type (Tier 1, Tier 2 and Tier 3): 2023
Figure 14. Global Market Emerging Display Technology Average Price (USD/Unit) of Key Manufacturers in 2023
Figure 15. The Global 5 and 10 Largest Players: Market Share by Emerging Display Technology Revenue in 2023
Figure 16. Evaluation Matrix of Segment Market Development Potential (Type)
Figure 17. Global Emerging Display Technology Market Share by Type
Figure 18. Sales Market Share of Emerging Display Technology by Type (2019-2025)
Figure 19. Sales Market Share of Emerging Display Technology by Type in 2023
Figure 20. Market Size Share of Emerging Display Technology by Type (2019-2025)
Figure 21. Market Size Market Share of Emerging Display Technology by Type in 2023
Figure 22. Evaluation Matrix of Segment Market Development Potential (Application)
Figure 23. Global Emerging Display Technology Market Share by Application
Figure 24. Global Emerging Display Technology Sales Market Share by Application (2019-2025)
Figure 25. Global Emerging Display Technology Sales Market Share by Application in 2023
Figure 26. Global Emerging Display Technology Market Share by Application (2019-2025)
Figure 27. Global Emerging Display Technology Market Share by Application in 2023
Figure 28. Global Emerging Display Technology Sales Growth Rate by Application (2019-2025)
Figure 29. Global Emerging Display Technology Sales Market Share by Region (2019-2025)
Figure 30. North America Emerging Display Technology Sales and Growth Rate (2019-2025) & (K Units)
Figure 31. North America Emerging Display Technology Sales Market Share by Country in 2023
Figure 32. U.S. Emerging Display Technology Sales and Growth Rate (2019-2025) & (K Units)
Figure 33. Canada Emerging Display Technology Sales (K Units) and Growth Rate (2019-2025)
Figure 34. Mexico Emerging Display Technology Sales (Units) and Growth Rate (2019-2025)
Figure 35. Europe Emerging Display Technology Sales and Growth Rate (2019-2025) & (K Units)
Figure 36. Europe Emerging Display Technology Sales Market Share by Country in 2023
Figure 37. Germany Emerging Display Technology Sales and Growth Rate (2019-2025) & (K Units)
Figure 38. France Emerging Display Technology Sales and Growth Rate (2019-2025) & (K Units)
Figure 39. U.K. Emerging Display Technology Sales and Growth Rate (2019-2025) & (K Units)
Figure 40. Italy Emerging Display Technology Sales and Growth Rate (2019-2025) & (K Units)
Figure 41. Russia Emerging Display Technology Sales and Growth Rate (2019-2025) & (K Units)
Figure 42. Asia Pacific Emerging Display Technology Sales and Growth Rate (K Units)
Figure 43. Asia Pacific Emerging Display Technology Sales Market Share by Region in 2023
Figure 44. China Emerging Display Technology Sales and Growth Rate (2019-2025) & (K Units)
Figure 45. Japan Emerging Display Technology Sales and Growth Rate (2019-2025) & (K Units)
Figure 46. South Korea Emerging Display Technology Sales and Growth Rate (2019-2025) & (K Units)
Figure 47. India Emerging Display Technology Sales and Growth Rate (2019-2025) & (K Units)
Figure 48. Southeast Asia Emerging Display Technology Sales and Growth Rate (2019-2025) & (K Units)
Figure 49. South America Emerging Display Technology Sales and Growth Rate (K Units)
Figure 50. South America Emerging Display Technology Sales Market Share by Country in 2023
Figure 51. Brazil Emerging Display Technology Sales and Growth Rate (2019-2025) & (K Units)
Figure 52. Argentina Emerging Display Technology Sales and Growth Rate (2019-2025) & (K Units)
Figure 53. Columbia Emerging Display Technology Sales and Growth Rate (2019-2025) & (K Units)
Figure 54. Middle East and Africa Emerging Display Technology Sales and Growth Rate (K Units)
Figure 55. Middle East and Africa Emerging Display Technology Sales Market Share by Region in 2023
Figure 56. Saudi Arabia Emerging Display Technology Sales and Growth Rate (2019-2025) & (K Units)
Figure 57. UAE Emerging Display Technology Sales and Growth Rate (2019-2025) & (K Units)
Figure 58. Egypt Emerging Display Technology Sales and Growth Rate (2019-2025) & (K Units)
Figure 59. Nigeria Emerging Display Technology Sales and Growth Rate (2019-2025) & (K Units)
Figure 60. South Africa Emerging Display Technology Sales and Growth Rate (2019-2025) & (K Units)
Figure 61. Global Emerging Display Technology Production Market Share by Region (2019-2025)
Figure 62. North America Emerging Display Technology Production (K Units) Growth Rate (2019-2025)
Figure 63. Europe Emerging Display Technology Production (K Units) Growth Rate (2019-2025)
Figure 64. Japan Emerging Display Technology Production (K Units) Growth Rate (2019-2025)
Figure 65. China Emerging Display Technology Production (K Units) Growth Rate (2019-2025)
Figure 66. Global Emerging Display Technology Sales Forecast by Volume (2019-2032) & (K Units)
Figure 67. Global Emerging Display Technology Market Size Forecast by Value (2019-2032) & (M USD)
Figure 68. Global Emerging Display Technology Sales Market Share Forecast by Type (2025-2032)
Figure 69. Global Emerging Display Technology Market Share Forecast by Type (2025-2032)
Figure 70. Global Emerging Display Technology Sales Forecast by Application (2025-2032)
Figure 71. Global Emerging Display Technology Market Share Forecast by Application (2025-2032)