Electronic Shelf Label for Drug Track Market, Emerging Trends, Business Strategies 2025-2032

Global Electronic Shelf Label for Drug Track market size was estimated at USD 71 million in 2023 and is projected to reach USD 113.01 million by 2032, exhibiting a CAGR of 5.30% during the forecast period.

PDF Icon Download Sample Report PDF
  • Quick Dispatch

    All Orders

  • Secure Payment

    100% Secure Payment

Compare

$1,500.00$4,250.00

Clear

Electronic Shelf Label for Drug Track Overview

Electronic Shelf Label, also known by the acronym ESL. It is the latest solution for inventory and price management in the retail sector, based on the use of advanced IT technology. ESL replaces conventional paper price tags attached to the shelves of supermarkets and department stores with, for example, LCDs and electronic paper (E-paper) that show information on product price, sales promotions, etc.

This report provides a deep insight into the global Electronic Shelf Label for Drug Track market covering all its essential aspects. This ranges from a macro overview of the market to micro details of the market size, competitive landscape, development trend, niche market, key market drivers and challenges, SWOT analysis, value chain analysis, etc.

The analysis helps the reader to shape the competition within the industries and strategies for the competitive environment to enhance the potential profit. Furthermore, it provides a simple framework for evaluating and accessing the position of the business organization. The report structure also focuses on the competitive landscape of the Global Electronic Shelf Label for Drug Track Market, this report introduces in detail the market share, market performance, product situation, operation situation, etc. of the main players, which helps the readers in the industry to identify the main competitors and deeply understand the competition pattern of the market.
In a word, this report is a must-read for industry players, investors, researchers, consultants, business strategists, and all those who have any kind of stake or are planning to foray into the Electronic Shelf Label for Drug Track market in any manner.

Electronic Shelf Label for Drug Track Market Analysis:

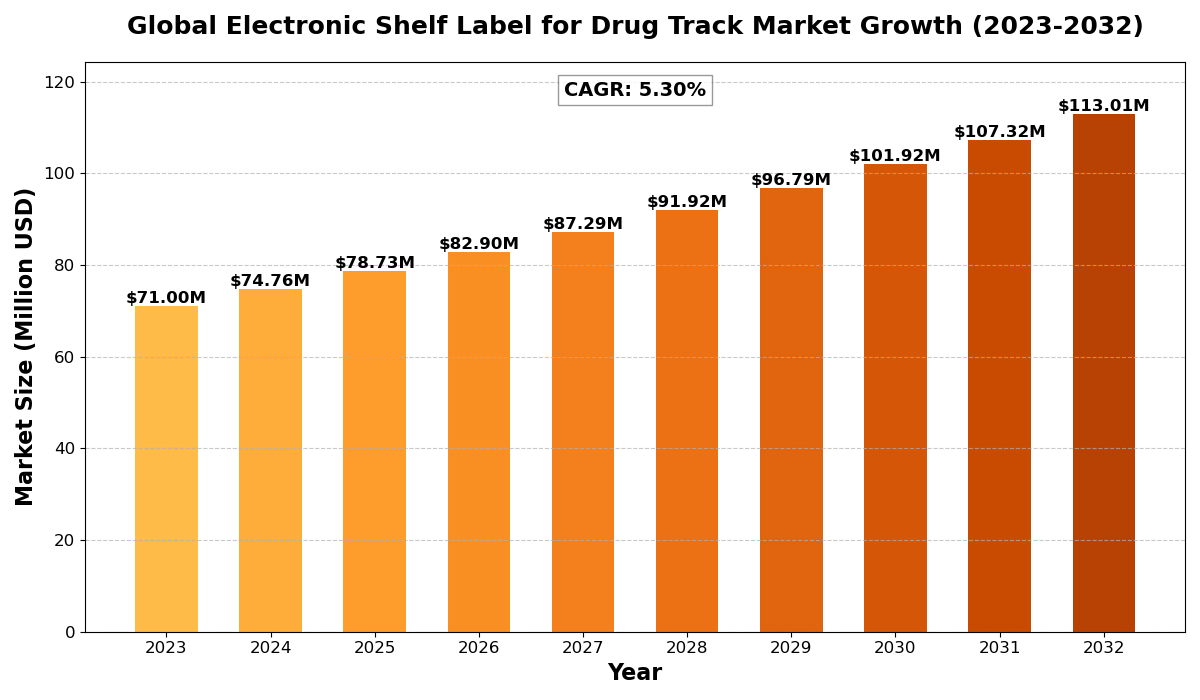
The global Electronic Shelf Label for Drug Track market size was estimated at USD 71 million in 2023 and is projected to reach USD 113.01 million by 2032, exhibiting a CAGR of 5.30% during the forecast period.

North America Electronic Shelf Label for Drug Track market size was estimated at USD 20.22 million in 2023, at a CAGR of 4.54% during the forecast period of 2025 through 2032.

Electronic Shelf Label for Drug Track Key Market Trends  

  1. Integration with RFID and IoT Technologies
    ESL systems are increasingly integrated with RFID and IoT technologies to enable real-time tracking and efficient inventory management in pharmacies.
  2. Adoption of E-Paper Displays for Clarity
    E-paper displays are gaining traction due to their readability, low power consumption, and ability to display critical drug information clearly.
  3. Focus on Regulatory Compliance
    Pharmacies and healthcare facilities are adopting ESLs to meet stringent regulatory standards for drug labeling and tracking.
  4. Enhanced Patient Safety Measures
    ESL systems help reduce medication errors by providing accurate and up-to-date drug information at the point of sale.
  5. Sustainability and Energy Efficiency
    Energy-efficient ESL systems are being prioritized to lower operational costs and support environmental sustainability goals.

Electronic Shelf Label for Drug Track Regional Analysis :

semi insight

  • North America:Strong demand driven by EVs, 5G infrastructure, and renewable energy, with the U.S. leading the market.
  • Europe:Growth fueled by automotive electrification, renewable energy, and strong regulatory support, with Germany as a key player.
  • Asia-Pacific:Dominates the market due to large-scale manufacturing in China and Japan, with growing demand from EVs, 5G, and semiconductors.
  • South America:Emerging market, driven by renewable energy and EV adoption, with Brazil leading growth.
  • Middle East & Africa:Gradual growth, mainly due to investments in renewable energy and EV infrastructure, with Saudi Arabia and UAE as key contributors.

Electronic Shelf Label for Drug Track Segmentation

The research report includes specific segments by region (country), manufacturers, Type, and Application. Market segmentation creates subsets of a market based on product type, end-user or application, Geographic, and other factors. By understanding the market segments, the decision-maker can leverage this targeting in the product, sales, and marketing strategies. Market segments can power your product development cycles by informing how you create product offerings for different segments.

Key Company

  • BOE (SES-imagotag)
  • Pricer
  • SoluM
  • E Ink
  • Displaydata
  • Opticon Sensors Europe B.V
  • DIGI
  • Hanshow
  • LG innotek
  • Panasonic
  • Altierre

Market Segmentation (by Type)

  • Liquid Crystal Display (LCD) Displays
  • E papers Displays

Market Segmentation (by Application)

  • Drug Stores
  • Supermarket
  • Other

Drivers

  • Growing Need for Accurate Drug Tracking
    The demand for precise drug tracking systems is driving the adoption of ESLs in pharmacies and healthcare facilities.
  • Compliance with Pharmaceutical Regulations
    Stringent regulations on drug labeling and tracking are pushing the healthcare sector to implement ESL systems.
  • Improved Inventory Management
    ESLs streamline inventory processes, reducing stockouts and ensuring the availability of critical medications.

Restraints

  • High Initial Implementation Costs
    The cost of installing ESL systems can be a barrier for small and independent pharmacies.
  • Technical Integration Challenges
    Integrating ESL systems with existing pharmacy management software can be complex and time-consuming.
  • Data Security Concerns
    The reliance on wireless networks raises concerns about data security and potential cyber threats.

Opportunities

  • Expansion into Emerging Markets
    Growing healthcare infrastructure in emerging economies presents significant opportunities for ESL market growth.
  • Advancements in Display and Tracking Technologies
    Innovations in display technologies and tracking solutions offer new possibilities for enhancing ESL systems.
  • Increased Adoption in Hospital Pharmacies
    Hospitals are increasingly adopting ESL systems to improve drug management and patient safety.

Challenges

  • Ensuring System Reliability
    Maintaining consistent and error-free operation of ESL systems remains a key challenge.
  • Scalability Issues
    Expanding ESL deployments across large pharmacy chains can be complex and resource-intensive.
  • Adapting to Rapid Technological Changes
    Continuous updates are required to keep ESL systems aligned with evolving technologies.

Key Benefits of This Market Research:

  • Industry drivers, restraints, and opportunities covered in the study
  • Neutral perspective on the market performance
  • Recent industry trends and developments
  • Competitive landscape & strategies of key players
  • Potential & niche segments and regions exhibiting promising growth covered
  • Historical, current, and projected market size, in terms of value
  • In-depth analysis of the Electronic Shelf Label for Drug Track
  • Overview of the regional outlook of the Electronic Shelf Label for Drug Track:

Key Reasons to Buy this Report:

  • Access to date statistics compiled by our researchers. These provide you with historical and forecast data, which is analyzed to tell you why your market is set to change
  • This enables you to anticipate market changes to remain ahead of your competitors
  • You will be able to copy data from the Excel spreadsheet straight into your marketing plans, business presentations, or other strategic documents
  • The concise analysis, clear graph, and table format will enable you to pinpoint the information you require quickly
  • Provision of market value data for each segment and sub-segment
  • Indicates the region and segment that is expected to witness the fastest growth as well as to dominate the market
  • Provides insight into the market through Value Chain
  • Market dynamics scenario, along with growth opportunities of the market in the years to come
  • 6-month post-sales analyst support

Customization of the Report
In case of any queries or customization requirements, please connect with our sales team, who will ensure that your requirements are met.

FAQs

Q: What are the key driving factors and opportunities in the global Electronic Shelf Label for Drug Track market?
A: Key drivers include the growing need for accurate drug tracking, compliance with pharmaceutical regulations, and improved inventory management. Opportunities lie in emerging markets, advancements in display and tracking technologies, and increased adoption in hospital pharmacies.


Q: Which region is projected to have the largest market share?
A: North America is expected to lead the market due to its advanced healthcare infrastructure and strict regulatory requirements.


Q: Who are the top players in the global Electronic Shelf Label for Drug Track market?
A: Leading companies include SES-imagotag, Pricer AB, Displaydata, E Ink Holdings, and Opticon.


Q: What are the latest technological advancements in the industry?
A: Recent advancements include RFID-integrated ESL systems, ultra-low-power e-paper displays, and AI-driven inventory management solutions.


Q: What is the current size of the global Electronic Shelf Label for Drug Track market?
A: The market is projected to experience significant growth from 2025 to 2032, driven by increasing adoption in pharmacies and advancements in tracking technologies.


Electronic Shelf Label for Drug Track Market, Emerging Trends, Business Strategies 2025-2032

Get Sample Report PDF for Exclusive Insights

Report Sample Includes

  • Table of Contents
  • List of Tables & Figures
  • Charts, Research Methodology, and more...
PDF Icon Download Sample Report PDF

Download Sample Report

Table of Content

Table of Contents
1 Research Methodology and Statistical Scope
1.1 Market Definition and Statistical Scope of Electronic Shelf Label for Drug Track
1.2 Key Market Segments
1.2.1 Electronic Shelf Label for Drug Track Segment by Type
1.2.2 Electronic Shelf Label for Drug Track Segment by Application
1.3 Methodology & Sources of Information
1.3.1 Research Methodology
1.3.2 Research Process
1.3.3 Market Breakdown and Data Triangulation
1.3.4 Base Year
1.3.5 Report Assumptions & Caveats
2 Electronic Shelf Label for Drug Track Market Overview
2.1 Global Market Overview
2.1.1 Global Electronic Shelf Label for Drug Track Market Size (M USD) Estimates and Forecasts (2019-2032)
2.1.2 Global Electronic Shelf Label for Drug Track Sales Estimates and Forecasts (2019-2032)
2.2 Market Segment Executive Summary
2.3 Global Market Size by Region
3 Electronic Shelf Label for Drug Track Market Competitive Landscape
3.1 Global Electronic Shelf Label for Drug Track Sales by Manufacturers (2019-2025)
3.2 Global Electronic Shelf Label for Drug Track Revenue Market Share by Manufacturers (2019-2025)
3.3 Electronic Shelf Label for Drug Track Market Share by Company Type (Tier 1, Tier 2, and Tier 3)
3.4 Global Electronic Shelf Label for Drug Track Average Price by Manufacturers (2019-2025)
3.5 Manufacturers Electronic Shelf Label for Drug Track Sales Sites, Area Served, Product Type
3.6 Electronic Shelf Label for Drug Track Market Competitive Situation and Trends
3.6.1 Electronic Shelf Label for Drug Track Market Concentration Rate
3.6.2 Global 5 and 10 Largest Electronic Shelf Label for Drug Track Players Market Share by Revenue
3.6.3 Mergers & Acquisitions, Expansion
4 Electronic Shelf Label for Drug Track Industry Chain Analysis
4.1 Electronic Shelf Label for Drug Track Industry Chain Analysis
4.2 Market Overview of Key Raw Materials
4.3 Midstream Market Analysis
4.4 Downstream Customer Analysis
5 The Development and Dynamics of Electronic Shelf Label for Drug Track Market
5.1 Key Development Trends
5.2 Driving Factors
5.3 Market Challenges
5.4 Market Restraints
5.5 Industry News
5.5.1 New Product Developments
5.5.2 Mergers & Acquisitions
5.5.3 Expansions
5.5.4 Collaboration/Supply Contracts
5.6 Industry Policies
6 Electronic Shelf Label for Drug Track Market Segmentation by Type
6.1 Evaluation Matrix of Segment Market Development Potential (Type)
6.2 Global Electronic Shelf Label for Drug Track Sales Market Share by Type (2019-2025)
6.3 Global Electronic Shelf Label for Drug Track Market Size Market Share by Type (2019-2025)
6.4 Global Electronic Shelf Label for Drug Track Price by Type (2019-2025)
7 Electronic Shelf Label for Drug Track Market Segmentation by Application
7.1 Evaluation Matrix of Segment Market Development Potential (Application)
7.2 Global Electronic Shelf Label for Drug Track Market Sales by Application (2019-2025)
7.3 Global Electronic Shelf Label for Drug Track Market Size (M USD) by Application (2019-2025)
7.4 Global Electronic Shelf Label for Drug Track Sales Growth Rate by Application (2019-2025)
8 Electronic Shelf Label for Drug Track Market Consumption by Region
8.1 Global Electronic Shelf Label for Drug Track Sales by Region
8.1.1 Global Electronic Shelf Label for Drug Track Sales by Region
8.1.2 Global Electronic Shelf Label for Drug Track Sales Market Share by Region
8.2 North America
8.2.1 North America Electronic Shelf Label for Drug Track Sales by Country
8.2.2 U.S.
8.2.3 Canada
8.2.4 Mexico
8.3 Europe
8.3.1 Europe Electronic Shelf Label for Drug Track Sales by Country
8.3.2 Germany
8.3.3 France
8.3.4 U.K.
8.3.5 Italy
8.3.6 Russia
8.4 Asia Pacific
8.4.1 Asia Pacific Electronic Shelf Label for Drug Track Sales by Region
8.4.2 China
8.4.3 Japan
8.4.4 South Korea
8.4.5 India
8.4.6 Southeast Asia
8.5 South America
8.5.1 South America Electronic Shelf Label for Drug Track Sales by Country
8.5.2 Brazil
8.5.3 Argentina
8.5.4 Columbia
8.6 Middle East and Africa
8.6.1 Middle East and Africa Electronic Shelf Label for Drug Track Sales by Region
8.6.2 Saudi Arabia
8.6.3 UAE
8.6.4 Egypt
8.6.5 Nigeria
8.6.6 South Africa
9 Electronic Shelf Label for Drug Track Market Production by Region
9.1 Global Production of Electronic Shelf Label for Drug Track by Region (2019-2025)
9.2 Global Electronic Shelf Label for Drug Track Revenue Market Share by Region (2019-2025)
9.3 Global Electronic Shelf Label for Drug Track Production, Revenue, Price and Gross Margin (2019-2025)
9.4 North America Electronic Shelf Label for Drug Track Production
9.4.1 North America Electronic Shelf Label for Drug Track Production Growth Rate (2019-2025)
9.4.2 North America Electronic Shelf Label for Drug Track Production, Revenue, Price and Gross Margin (2019-2025)
9.5 Europe Electronic Shelf Label for Drug Track Production
9.5.1 Europe Electronic Shelf Label for Drug Track Production Growth Rate (2019-2025)
9.5.2 Europe Electronic Shelf Label for Drug Track Production, Revenue, Price and Gross Margin (2019-2025)
9.6 Japan Electronic Shelf Label for Drug Track Production (2019-2025)
9.6.1 Japan Electronic Shelf Label for Drug Track Production Growth Rate (2019-2025)
9.6.2 Japan Electronic Shelf Label for Drug Track Production, Revenue, Price and Gross Margin (2019-2025)
9.7 China Electronic Shelf Label for Drug Track Production (2019-2025)
9.7.1 China Electronic Shelf Label for Drug Track Production Growth Rate (2019-2025)
9.7.2 China Electronic Shelf Label for Drug Track Production, Revenue, Price and Gross Margin (2019-2025)
10 Key Companies Profile
10.1 BOE (SES-imagotag)
10.1.1 BOE (SES-imagotag) Electronic Shelf Label for Drug Track Basic Information
10.1.2 BOE (SES-imagotag) Electronic Shelf Label for Drug Track Product Overview
10.1.3 BOE (SES-imagotag) Electronic Shelf Label for Drug Track Product Market Performance
10.1.4 BOE (SES-imagotag) Business Overview
10.1.5 BOE (SES-imagotag) Electronic Shelf Label for Drug Track SWOT Analysis
10.1.6 BOE (SES-imagotag) Recent Developments
10.2 Pricer
10.2.1 Pricer Electronic Shelf Label for Drug Track Basic Information
10.2.2 Pricer Electronic Shelf Label for Drug Track Product Overview
10.2.3 Pricer Electronic Shelf Label for Drug Track Product Market Performance
10.2.4 Pricer Business Overview
10.2.5 Pricer Electronic Shelf Label for Drug Track SWOT Analysis
10.2.6 Pricer Recent Developments
10.3 SoluM
10.3.1 SoluM Electronic Shelf Label for Drug Track Basic Information
10.3.2 SoluM Electronic Shelf Label for Drug Track Product Overview
10.3.3 SoluM Electronic Shelf Label for Drug Track Product Market Performance
10.3.4 SoluM Electronic Shelf Label for Drug Track SWOT Analysis
10.3.5 SoluM Business Overview
10.3.6 SoluM Recent Developments
10.4 E Ink
10.4.1 E Ink Electronic Shelf Label for Drug Track Basic Information
10.4.2 E Ink Electronic Shelf Label for Drug Track Product Overview
10.4.3 E Ink Electronic Shelf Label for Drug Track Product Market Performance
10.4.4 E Ink Business Overview
10.4.5 E Ink Recent Developments
10.5 Displaydata
10.5.1 Displaydata Electronic Shelf Label for Drug Track Basic Information
10.5.2 Displaydata Electronic Shelf Label for Drug Track Product Overview
10.5.3 Displaydata Electronic Shelf Label for Drug Track Product Market Performance
10.5.4 Displaydata Business Overview
10.5.5 Displaydata Recent Developments
10.6 Opticon Sensors Europe B.V
10.6.1 Opticon Sensors Europe B.V Electronic Shelf Label for Drug Track Basic Information
10.6.2 Opticon Sensors Europe B.V Electronic Shelf Label for Drug Track Product Overview
10.6.3 Opticon Sensors Europe B.V Electronic Shelf Label for Drug Track Product Market Performance
10.6.4 Opticon Sensors Europe B.V Business Overview
10.6.5 Opticon Sensors Europe B.V Recent Developments
10.7 DIGI
10.7.1 DIGI Electronic Shelf Label for Drug Track Basic Information
10.7.2 DIGI Electronic Shelf Label for Drug Track Product Overview
10.7.3 DIGI Electronic Shelf Label for Drug Track Product Market Performance
10.7.4 DIGI Business Overview
10.7.5 DIGI Recent Developments
10.8 Hanshow
10.8.1 Hanshow Electronic Shelf Label for Drug Track Basic Information
10.8.2 Hanshow Electronic Shelf Label for Drug Track Product Overview
10.8.3 Hanshow Electronic Shelf Label for Drug Track Product Market Performance
10.8.4 Hanshow Business Overview
10.8.5 Hanshow Recent Developments
10.9 LG innotek
10.9.1 LG innotek Electronic Shelf Label for Drug Track Basic Information
10.9.2 LG innotek Electronic Shelf Label for Drug Track Product Overview
10.9.3 LG innotek Electronic Shelf Label for Drug Track Product Market Performance
10.9.4 LG innotek Business Overview
10.9.5 LG innotek Recent Developments
10.10 Panasonic
10.10.1 Panasonic Electronic Shelf Label for Drug Track Basic Information
10.10.2 Panasonic Electronic Shelf Label for Drug Track Product Overview
10.10.3 Panasonic Electronic Shelf Label for Drug Track Product Market Performance
10.10.4 Panasonic Business Overview
10.10.5 Panasonic Recent Developments
10.11 Altierre
10.11.1 Altierre Electronic Shelf Label for Drug Track Basic Information
10.11.2 Altierre Electronic Shelf Label for Drug Track Product Overview
10.11.3 Altierre Electronic Shelf Label for Drug Track Product Market Performance
10.11.4 Altierre Business Overview
10.11.5 Altierre Recent Developments
11 Electronic Shelf Label for Drug Track Market Forecast by Region
11.1 Global Electronic Shelf Label for Drug Track Market Size Forecast
11.2 Global Electronic Shelf Label for Drug Track Market Forecast by Region
11.2.1 North America Market Size Forecast by Country
11.2.2 Europe Electronic Shelf Label for Drug Track Market Size Forecast by Country
11.2.3 Asia Pacific Electronic Shelf Label for Drug Track Market Size Forecast by Region
11.2.4 South America Electronic Shelf Label for Drug Track Market Size Forecast by Country
11.2.5 Middle East and Africa Forecasted Consumption of Electronic Shelf Label for Drug Track by Country
12 Forecast Market by Type and by Application (2025-2032)
12.1 Global Electronic Shelf Label for Drug Track Market Forecast by Type (2025-2032)
12.1.1 Global Forecasted Sales of Electronic Shelf Label for Drug Track by Type (2025-2032)
12.1.2 Global Electronic Shelf Label for Drug Track Market Size Forecast by Type (2025-2032)
12.1.3 Global Forecasted Price of Electronic Shelf Label for Drug Track by Type (2025-2032)
12.2 Global Electronic Shelf Label for Drug Track Market Forecast by Application (2025-2032)
12.2.1 Global Electronic Shelf Label for Drug Track Sales (K Units) Forecast by Application
12.2.2 Global Electronic Shelf Label for Drug Track Market Size (M USD) Forecast by Application (2025-2032)
13 Conclusion and Key FindingsList of Tables
Table 1. Introduction of the Type
Table 2. Introduction of the Application
Table 3. Market Size (M USD) Segment Executive Summary
Table 4. Electronic Shelf Label for Drug Track Market Size Comparison by Region (M USD)
Table 5. Global Electronic Shelf Label for Drug Track Sales (K Units) by Manufacturers (2019-2025)
Table 6. Global Electronic Shelf Label for Drug Track Sales Market Share by Manufacturers (2019-2025)
Table 7. Global Electronic Shelf Label for Drug Track Revenue (M USD) by Manufacturers (2019-2025)
Table 8. Global Electronic Shelf Label for Drug Track Revenue Share by Manufacturers (2019-2025)
Table 9. Company Type (Tier 1, Tier 2, and Tier 3) & (based on the Revenue in Electronic Shelf Label for Drug Track as of 2022)
Table 10. Global Market Electronic Shelf Label for Drug Track Average Price (USD/Unit) of Key Manufacturers (2019-2025)
Table 11. Manufacturers Electronic Shelf Label for Drug Track Sales Sites and Area Served
Table 12. Manufacturers Electronic Shelf Label for Drug Track Product Type
Table 13. Global Electronic Shelf Label for Drug Track Manufacturers Market Concentration Ratio (CR5 and HHI)
Table 14. Mergers & Acquisitions, Expansion Plans
Table 15. Industry Chain Map of Electronic Shelf Label for Drug Track
Table 16. Market Overview of Key Raw Materials
Table 17. Midstream Market Analysis
Table 18. Downstream Customer Analysis
Table 19. Key Development Trends
Table 20. Driving Factors
Table 21. Electronic Shelf Label for Drug Track Market Challenges
Table 22. Global Electronic Shelf Label for Drug Track Sales by Type (K Units)
Table 23. Global Electronic Shelf Label for Drug Track Market Size by Type (M USD)
Table 24. Global Electronic Shelf Label for Drug Track Sales (K Units) by Type (2019-2025)
Table 25. Global Electronic Shelf Label for Drug Track Sales Market Share by Type (2019-2025)
Table 26. Global Electronic Shelf Label for Drug Track Market Size (M USD) by Type (2019-2025)
Table 27. Global Electronic Shelf Label for Drug Track Market Size Share by Type (2019-2025)
Table 28. Global Electronic Shelf Label for Drug Track Price (USD/Unit) by Type (2019-2025)
Table 29. Global Electronic Shelf Label for Drug Track Sales (K Units) by Application
Table 30. Global Electronic Shelf Label for Drug Track Market Size by Application
Table 31. Global Electronic Shelf Label for Drug Track Sales by Application (2019-2025) & (K Units)
Table 32. Global Electronic Shelf Label for Drug Track Sales Market Share by Application (2019-2025)
Table 33. Global Electronic Shelf Label for Drug Track Sales by Application (2019-2025) & (M USD)
Table 34. Global Electronic Shelf Label for Drug Track Market Share by Application (2019-2025)
Table 35. Global Electronic Shelf Label for Drug Track Sales Growth Rate by Application (2019-2025)
Table 36. Global Electronic Shelf Label for Drug Track Sales by Region (2019-2025) & (K Units)
Table 37. Global Electronic Shelf Label for Drug Track Sales Market Share by Region (2019-2025)
Table 38. North America Electronic Shelf Label for Drug Track Sales by Country (2019-2025) & (K Units)
Table 39. Europe Electronic Shelf Label for Drug Track Sales by Country (2019-2025) & (K Units)
Table 40. Asia Pacific Electronic Shelf Label for Drug Track Sales by Region (2019-2025) & (K Units)
Table 41. South America Electronic Shelf Label for Drug Track Sales by Country (2019-2025) & (K Units)
Table 42. Middle East and Africa Electronic Shelf Label for Drug Track Sales by Region (2019-2025) & (K Units)
Table 43. Global Electronic Shelf Label for Drug Track Production (K Units) by Region (2019-2025)
Table 44. Global Electronic Shelf Label for Drug Track Revenue (US$ Million) by Region (2019-2025)
Table 45. Global Electronic Shelf Label for Drug Track Revenue Market Share by Region (2019-2025)
Table 46. Global Electronic Shelf Label for Drug Track Production (K Units), Revenue (US$ Million), Price (USD/Unit) and Gross Margin (2019-2025)
Table 47. North America Electronic Shelf Label for Drug Track Production (K Units), Revenue (US$ Million), Price (USD/Unit) and Gross Margin (2019-2025)
Table 48. Europe Electronic Shelf Label for Drug Track Production (K Units), Revenue (US$ Million), Price (USD/Unit) and Gross Margin (2019-2025)
Table 49. Japan Electronic Shelf Label for Drug Track Production (K Units), Revenue (US$ Million), Price (USD/Unit) and Gross Margin (2019-2025)
Table 50. China Electronic Shelf Label for Drug Track Production (K Units), Revenue (US$ Million), Price (USD/Unit) and Gross Margin (2019-2025)
Table 51. BOE (SES-imagotag) Electronic Shelf Label for Drug Track Basic Information
Table 52. BOE (SES-imagotag) Electronic Shelf Label for Drug Track Product Overview
Table 53. BOE (SES-imagotag) Electronic Shelf Label for Drug Track Sales (K Units), Revenue (M USD), Price (USD/Unit) and Gross Margin (2019-2025)
Table 54. BOE (SES-imagotag) Business Overview
Table 55. BOE (SES-imagotag) Electronic Shelf Label for Drug Track SWOT Analysis
Table 56. BOE (SES-imagotag) Recent Developments
Table 57. Pricer Electronic Shelf Label for Drug Track Basic Information
Table 58. Pricer Electronic Shelf Label for Drug Track Product Overview
Table 59. Pricer Electronic Shelf Label for Drug Track Sales (K Units), Revenue (M USD), Price (USD/Unit) and Gross Margin (2019-2025)
Table 60. Pricer Business Overview
Table 61. Pricer Electronic Shelf Label for Drug Track SWOT Analysis
Table 62. Pricer Recent Developments
Table 63. SoluM Electronic Shelf Label for Drug Track Basic Information
Table 64. SoluM Electronic Shelf Label for Drug Track Product Overview
Table 65. SoluM Electronic Shelf Label for Drug Track Sales (K Units), Revenue (M USD), Price (USD/Unit) and Gross Margin (2019-2025)
Table 66. SoluM Electronic Shelf Label for Drug Track SWOT Analysis
Table 67. SoluM Business Overview
Table 68. SoluM Recent Developments
Table 69. E Ink Electronic Shelf Label for Drug Track Basic Information
Table 70. E Ink Electronic Shelf Label for Drug Track Product Overview
Table 71. E Ink Electronic Shelf Label for Drug Track Sales (K Units), Revenue (M USD), Price (USD/Unit) and Gross Margin (2019-2025)
Table 72. E Ink Business Overview
Table 73. E Ink Recent Developments
Table 74. Displaydata Electronic Shelf Label for Drug Track Basic Information
Table 75. Displaydata Electronic Shelf Label for Drug Track Product Overview
Table 76. Displaydata Electronic Shelf Label for Drug Track Sales (K Units), Revenue (M USD), Price (USD/Unit) and Gross Margin (2019-2025)
Table 77. Displaydata Business Overview
Table 78. Displaydata Recent Developments
Table 79. Opticon Sensors Europe B.V Electronic Shelf Label for Drug Track Basic Information
Table 80. Opticon Sensors Europe B.V Electronic Shelf Label for Drug Track Product Overview
Table 81. Opticon Sensors Europe B.V Electronic Shelf Label for Drug Track Sales (K Units), Revenue (M USD), Price (USD/Unit) and Gross Margin (2019-2025)
Table 82. Opticon Sensors Europe B.V Business Overview
Table 83. Opticon Sensors Europe B.V Recent Developments
Table 84. DIGI Electronic Shelf Label for Drug Track Basic Information
Table 85. DIGI Electronic Shelf Label for Drug Track Product Overview
Table 86. DIGI Electronic Shelf Label for Drug Track Sales (K Units), Revenue (M USD), Price (USD/Unit) and Gross Margin (2019-2025)
Table 87. DIGI Business Overview
Table 88. DIGI Recent Developments
Table 89. Hanshow Electronic Shelf Label for Drug Track Basic Information
Table 90. Hanshow Electronic Shelf Label for Drug Track Product Overview
Table 91. Hanshow Electronic Shelf Label for Drug Track Sales (K Units), Revenue (M USD), Price (USD/Unit) and Gross Margin (2019-2025)
Table 92. Hanshow Business Overview
Table 93. Hanshow Recent Developments
Table 94. LG innotek Electronic Shelf Label for Drug Track Basic Information
Table 95. LG innotek Electronic Shelf Label for Drug Track Product Overview
Table 96. LG innotek Electronic Shelf Label for Drug Track Sales (K Units), Revenue (M USD), Price (USD/Unit) and Gross Margin (2019-2025)
Table 97. LG innotek Business Overview
Table 98. LG innotek Recent Developments
Table 99. Panasonic Electronic Shelf Label for Drug Track Basic Information
Table 100. Panasonic Electronic Shelf Label for Drug Track Product Overview
Table 101. Panasonic Electronic Shelf Label for Drug Track Sales (K Units), Revenue (M USD), Price (USD/Unit) and Gross Margin (2019-2025)
Table 102. Panasonic Business Overview
Table 103. Panasonic Recent Developments
Table 104. Altierre Electronic Shelf Label for Drug Track Basic Information
Table 105. Altierre Electronic Shelf Label for Drug Track Product Overview
Table 106. Altierre Electronic Shelf Label for Drug Track Sales (K Units), Revenue (M USD), Price (USD/Unit) and Gross Margin (2019-2025)
Table 107. Altierre Business Overview
Table 108. Altierre Recent Developments
Table 109. Global Electronic Shelf Label for Drug Track Sales Forecast by Region (2025-2032) & (K Units)
Table 110. Global Electronic Shelf Label for Drug Track Market Size Forecast by Region (2025-2032) & (M USD)
Table 111. North America Electronic Shelf Label for Drug Track Sales Forecast by Country (2025-2032) & (K Units)
Table 112. North America Electronic Shelf Label for Drug Track Market Size Forecast by Country (2025-2032) & (M USD)
Table 113. Europe Electronic Shelf Label for Drug Track Sales Forecast by Country (2025-2032) & (K Units)
Table 114. Europe Electronic Shelf Label for Drug Track Market Size Forecast by Country (2025-2032) & (M USD)
Table 115. Asia Pacific Electronic Shelf Label for Drug Track Sales Forecast by Region (2025-2032) & (K Units)
Table 116. Asia Pacific Electronic Shelf Label for Drug Track Market Size Forecast by Region (2025-2032) & (M USD)
Table 117. South America Electronic Shelf Label for Drug Track Sales Forecast by Country (2025-2032) & (K Units)
Table 118. South America Electronic Shelf Label for Drug Track Market Size Forecast by Country (2025-2032) & (M USD)
Table 119. Middle East and Africa Electronic Shelf Label for Drug Track Consumption Forecast by Country (2025-2032) & (Units)
Table 120. Middle East and Africa Electronic Shelf Label for Drug Track Market Size Forecast by Country (2025-2032) & (M USD)
Table 121. Global Electronic Shelf Label for Drug Track Sales Forecast by Type (2025-2032) & (K Units)
Table 122. Global Electronic Shelf Label for Drug Track Market Size Forecast by Type (2025-2032) & (M USD)
Table 123. Global Electronic Shelf Label for Drug Track Price Forecast by Type (2025-2032) & (USD/Unit)
Table 124. Global Electronic Shelf Label for Drug Track Sales (K Units) Forecast by Application (2025-2032)
Table 125. Global Electronic Shelf Label for Drug Track Market Size Forecast by Application (2025-2032) & (M USD)
List of Figures
Figure 1. Product Picture of Electronic Shelf Label for Drug Track
Figure 2. Data Triangulation
Figure 3. Key Caveats
Figure 4. Global Electronic Shelf Label for Drug Track Market Size (M USD), 2019-2032
Figure 5. Global Electronic Shelf Label for Drug Track Market Size (M USD) (2019-2032)
Figure 6. Global Electronic Shelf Label for Drug Track Sales (K Units) & (2019-2032)
Figure 7. Evaluation Matrix of Segment Market Development Potential (Type)
Figure 8. Evaluation Matrix of Segment Market Development Potential (Application)
Figure 9. Evaluation Matrix of Regional Market Development Potential
Figure 10. Electronic Shelf Label for Drug Track Market Size by Country (M USD)
Figure 11. Electronic Shelf Label for Drug Track Sales Share by Manufacturers in 2023
Figure 12. Global Electronic Shelf Label for Drug Track Revenue Share by Manufacturers in 2023
Figure 13. Electronic Shelf Label for Drug Track Market Share by Company Type (Tier 1, Tier 2 and Tier 3): 2023
Figure 14. Global Market Electronic Shelf Label for Drug Track Average Price (USD/Unit) of Key Manufacturers in 2023
Figure 15. The Global 5 and 10 Largest Players: Market Share by Electronic Shelf Label for Drug Track Revenue in 2023
Figure 16. Evaluation Matrix of Segment Market Development Potential (Type)
Figure 17. Global Electronic Shelf Label for Drug Track Market Share by Type
Figure 18. Sales Market Share of Electronic Shelf Label for Drug Track by Type (2019-2025)
Figure 19. Sales Market Share of Electronic Shelf Label for Drug Track by Type in 2023
Figure 20. Market Size Share of Electronic Shelf Label for Drug Track by Type (2019-2025)
Figure 21. Market Size Market Share of Electronic Shelf Label for Drug Track by Type in 2023
Figure 22. Evaluation Matrix of Segment Market Development Potential (Application)
Figure 23. Global Electronic Shelf Label for Drug Track Market Share by Application
Figure 24. Global Electronic Shelf Label for Drug Track Sales Market Share by Application (2019-2025)
Figure 25. Global Electronic Shelf Label for Drug Track Sales Market Share by Application in 2023
Figure 26. Global Electronic Shelf Label for Drug Track Market Share by Application (2019-2025)
Figure 27. Global Electronic Shelf Label for Drug Track Market Share by Application in 2023
Figure 28. Global Electronic Shelf Label for Drug Track Sales Growth Rate by Application (2019-2025)
Figure 29. Global Electronic Shelf Label for Drug Track Sales Market Share by Region (2019-2025)
Figure 30. North America Electronic Shelf Label for Drug Track Sales and Growth Rate (2019-2025) & (K Units)
Figure 31. North America Electronic Shelf Label for Drug Track Sales Market Share by Country in 2023
Figure 32. U.S. Electronic Shelf Label for Drug Track Sales and Growth Rate (2019-2025) & (K Units)
Figure 33. Canada Electronic Shelf Label for Drug Track Sales (K Units) and Growth Rate (2019-2025)
Figure 34. Mexico Electronic Shelf Label for Drug Track Sales (Units) and Growth Rate (2019-2025)
Figure 35. Europe Electronic Shelf Label for Drug Track Sales and Growth Rate (2019-2025) & (K Units)
Figure 36. Europe Electronic Shelf Label for Drug Track Sales Market Share by Country in 2023
Figure 37. Germany Electronic Shelf Label for Drug Track Sales and Growth Rate (2019-2025) & (K Units)
Figure 38. France Electronic Shelf Label for Drug Track Sales and Growth Rate (2019-2025) & (K Units)
Figure 39. U.K. Electronic Shelf Label for Drug Track Sales and Growth Rate (2019-2025) & (K Units)
Figure 40. Italy Electronic Shelf Label for Drug Track Sales and Growth Rate (2019-2025) & (K Units)
Figure 41. Russia Electronic Shelf Label for Drug Track Sales and Growth Rate (2019-2025) & (K Units)
Figure 42. Asia Pacific Electronic Shelf Label for Drug Track Sales and Growth Rate (K Units)
Figure 43. Asia Pacific Electronic Shelf Label for Drug Track Sales Market Share by Region in 2023
Figure 44. China Electronic Shelf Label for Drug Track Sales and Growth Rate (2019-2025) & (K Units)
Figure 45. Japan Electronic Shelf Label for Drug Track Sales and Growth Rate (2019-2025) & (K Units)
Figure 46. South Korea Electronic Shelf Label for Drug Track Sales and Growth Rate (2019-2025) & (K Units)
Figure 47. India Electronic Shelf Label for Drug Track Sales and Growth Rate (2019-2025) & (K Units)
Figure 48. Southeast Asia Electronic Shelf Label for Drug Track Sales and Growth Rate (2019-2025) & (K Units)
Figure 49. South America Electronic Shelf Label for Drug Track Sales and Growth Rate (K Units)
Figure 50. South America Electronic Shelf Label for Drug Track Sales Market Share by Country in 2023
Figure 51. Brazil Electronic Shelf Label for Drug Track Sales and Growth Rate (2019-2025) & (K Units)
Figure 52. Argentina Electronic Shelf Label for Drug Track Sales and Growth Rate (2019-2025) & (K Units)
Figure 53. Columbia Electronic Shelf Label for Drug Track Sales and Growth Rate (2019-2025) & (K Units)
Figure 54. Middle East and Africa Electronic Shelf Label for Drug Track Sales and Growth Rate (K Units)
Figure 55. Middle East and Africa Electronic Shelf Label for Drug Track Sales Market Share by Region in 2023
Figure 56. Saudi Arabia Electronic Shelf Label for Drug Track Sales and Growth Rate (2019-2025) & (K Units)
Figure 57. UAE Electronic Shelf Label for Drug Track Sales and Growth Rate (2019-2025) & (K Units)
Figure 58. Egypt Electronic Shelf Label for Drug Track Sales and Growth Rate (2019-2025) & (K Units)
Figure 59. Nigeria Electronic Shelf Label for Drug Track Sales and Growth Rate (2019-2025) & (K Units)
Figure 60. South Africa Electronic Shelf Label for Drug Track Sales and Growth Rate (2019-2025) & (K Units)
Figure 61. Global Electronic Shelf Label for Drug Track Production Market Share by Region (2019-2025)
Figure 62. North America Electronic Shelf Label for Drug Track Production (K Units) Growth Rate (2019-2025)
Figure 63. Europe Electronic Shelf Label for Drug Track Production (K Units) Growth Rate (2019-2025)
Figure 64. Japan Electronic Shelf Label for Drug Track Production (K Units) Growth Rate (2019-2025)
Figure 65. China Electronic Shelf Label for Drug Track Production (K Units) Growth Rate (2019-2025)
Figure 66. Global Electronic Shelf Label for Drug Track Sales Forecast by Volume (2019-2032) & (K Units)
Figure 67. Global Electronic Shelf Label for Drug Track Market Size Forecast by Value (2019-2032) & (M USD)
Figure 68. Global Electronic Shelf Label for Drug Track Sales Market Share Forecast by Type (2025-2032)
Figure 69. Global Electronic Shelf Label for Drug Track Market Share Forecast by Type (2025-2032)
Figure 70. Global Electronic Shelf Label for Drug Track Sales Forecast by Application (2025-2032)
Figure 71. Global Electronic Shelf Label for Drug Track Market Share Forecast by Application (2025-2032)