Electronic Shelf Label (ESL) for Department Stores and Supermarket Market Overview
Electronic Shelf Labels (ESLs) are digital devices used in department stores and supermarkets to display product information and pricing on store shelves. These labels replace traditional paper price tags and offer a range of benefits for retailers and shoppers alike.
This report provides a deep insight into the global Electronic Shelf Label (ESL) for Department Stores and Supermarket market covering all its essential aspects. This ranges from a macro overview of the market to micro details of the market size, competitive landscape, development trend, niche market, key market drivers and challenges, SWOT analysis, value chain analysis, etc.
The analysis helps the reader to shape the competition within the industries and strategies for the competitive environment to enhance the potential profit. Furthermore, it provides a simple framework for evaluating and accessing the position of the business organization. The report structure also focuses on the competitive landscape of the Global Electronic Shelf Label (ESL) for Department Stores and Supermarket Market, this report introduces in detail the market share, market performance, product situation, operation situation, etc. of the main players, which helps the readers in the industry to identify the main competitors and deeply understand the competition pattern of the market.
In a word, this report is a must-read for industry players, investors, researchers, consultants, business strategists, and all those who have any kind of stake or are planning to foray into the Electronic Shelf Label (ESL) for Department Stores and Supermarket market in any manner.
Electronic Shelf Label (ESL) for Department Stores and Supermarket Market Analysis:
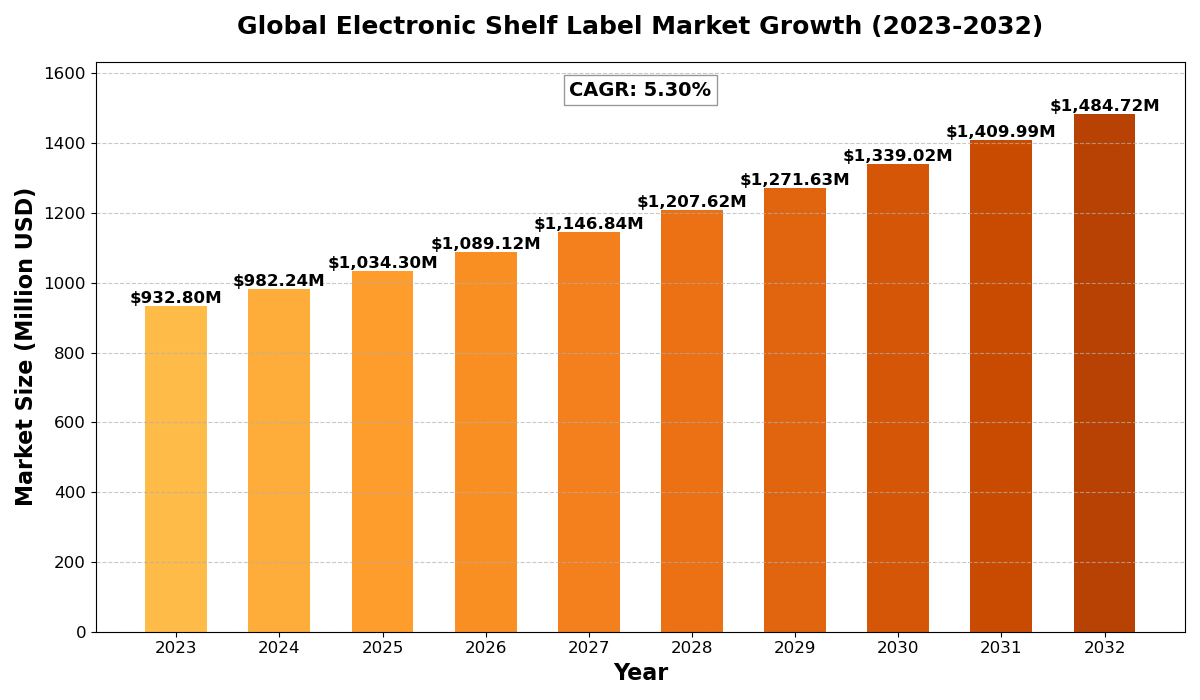
The global Electronic Shelf Label (ESL) for Department Stores and Supermarket Market size was estimated at USD 932.80 million in 2023 and is projected to reach USD 1484.72 million by 2032, exhibiting a CAGR of 5.30% during the forecast period.
North America Electronic Shelf Label (ESL) for Department Stores and Supermarket market size was estimated at USD 265.65 million in 2023, at a CAGR of 4.54% during the forecast period of 2025 through 2032.
Electronic Shelf Label (ESL) for Department Stores and Supermarket Key Market Trends :
- Growing Adoption of Automation
Retailers are rapidly adopting ESL technology to automate pricing and inventory management, reducing human error and labor costs. - Integration with IoT and AI
Smart ESLs with IoT connectivity and AI-powered analytics are enhancing customer experiences by enabling personalized pricing and real-time updates. - Rising Demand for E-paper Displays
E-paper displays are gaining traction due to their low power consumption, high visibility, and sustainability benefits over traditional LCD displays. - Expansion in Emerging Markets
Rapid urbanization and digital transformation in Asia-Pacific and Latin America are driving ESL adoption, offering significant growth opportunities. - Sustainability and Energy Efficiency
With retailers focusing on reducing their carbon footprint, ESLs are being designed with energy-efficient technology and recyclable materials.
Electronic Shelf Label (ESL) for Department Stores and Supermarket Market Regional Analysis :

-
North America:
Strong demand driven by EVs, 5G infrastructure, and renewable energy, with the U.S. leading the market.
-
Europe:
Growth fueled by automotive electrification, renewable energy, and strong regulatory support, with Germany as a key player.
-
Asia-Pacific:
Dominates the market due to large-scale manufacturing in China and Japan, with growing demand from EVs, 5G, and semiconductors.
-
South America:
Emerging market, driven by renewable energy and EV adoption, with Brazil leading growth.
-
Middle East & Africa:
Gradual growth, mainly due to investments in renewable energy and EV infrastructure, with Saudi Arabia and UAE as key contributors.
Electronic Shelf Label (ESL) for Department Stores and Supermarket Market Segmentation :
The research report includes specific segments by region (country), manufacturers, Type, and Application. Market segmentation creates subsets of a market based on product type, end-user or application, Geographic, and other factors. By understanding the market segments, the decision-maker can leverage this targeting in the product, sales, and marketing strategies. Market segments can power your product development cycles by informing how you create product offerings for different segments.
Key Company
- BOC (SES-imagotag)
- Pricer
- SoluM
- E Ink
- Displaydata
- Opticon Sensors Europe B.V
- DIGI
- Hanshow
- LG innotek
- Altierre
- Panasonic
Market Segmentation (by Type)
- Liquid Crystal Display (LCD) Displays
- E-papers Displays
Market Segmentation (by Application)
- Department Stores
- Supermarket
Market Drivers
- Increasing Demand for Real-time Pricing Updates
ESLs enable retailers to update prices instantly, reducing pricing errors and ensuring competitive pricing strategies. - Labor Cost Reduction and Efficiency
Automated pricing reduces reliance on manual labor, saving operational costs and improving efficiency in retail management. - Rising E-commerce Competition
With online shopping on the rise, brick-and-mortar stores are leveraging ESLs to offer dynamic pricing and enhance in-store customer experiences.
Market Restraints
- High Initial Investment Costs
The implementation of ESLs requires significant capital, which can be a barrier for small and mid-sized retailers. - Integration and Compatibility Issues
ESL systems must integrate with existing retail software, which can be complex and time-consuming. - Limited Awareness in Developing Regions
Many retailers in emerging markets lack awareness of ESL benefits, slowing adoption rates.
Market Opportunities
- Advancements in Display Technology
Innovations in e-paper and flexible display technology are making ESLs more efficient and cost-effective. - Expansion of Smart Retail Solutions
The rise of smart stores with AI, IoT, and automated checkout systems is creating new opportunities for ESL providers. - Government Support for Digital Transformation
Various government initiatives promoting digital retail infrastructure are expected to boost ESL adoption.
Market Challenges
- Data Security and Cyber Risks
The digital nature of ESLs makes them vulnerable to cyber threats and data breaches. - Power Consumption and Battery Life
While e-paper displays consume less power, managing battery life in large-scale deployments remains a challenge. - Resistance to Technological Change
Traditional retailers may hesitate to transition from paper labels to digital ESLs due to lack of technical expertise.
Key Benefits of This Market Research:
- Industry drivers, restraints, and opportunities covered in the study
- Neutral perspective on the market performance
- Recent industry trends and developments
- Competitive landscape & strategies of key players
- Potential & niche segments and regions exhibiting promising growth covered
- Historical, current, and projected market size, in terms of value
- In-depth analysis of the Electronic Shelf Label (ESL) for Department Stores and Supermarket Market
- Overview of the regional outlook of the Electronic Shelf Label (ESL) for Department Stores and Supermarket Market:
Key Reasons to Buy this Report:
- Access to date statistics compiled by our researchers. These provide you with historical and forecast data, which is analyzed to tell you why your market is set to change
- This enables you to anticipate market changes to remain ahead of your competitors
- You will be able to copy data from the Excel spreadsheet straight into your marketing plans, business presentations, or other strategic documents
- The concise analysis, clear graph, and table format will enable you to pinpoint the information you require quickly
- Provision of market value data for each segment and sub-segment
- Indicates the region and segment that is expected to witness the fastest growth as well as to dominate the market
- Provides insight into the market through Value Chain
- Market dynamics scenario, along with growth opportunities of the market in the years to come
- 6-month post-sales analyst support
Customization of the Report
In case of any queries or customization requirements, please connect with our sales team, who will ensure that your requirements are met.
FAQs
Q: What are the key driving factors and opportunities in the ESL market?
A: The key drivers include demand for real-time pricing, labor cost reduction, and competition from e-commerce. Opportunities lie in smart retail integration, government initiatives, and advancements in display technology.
Q: Which region is projected to have the largest market share?
A: North America is expected to dominate due to early adoption of ESLs, followed by Europe and Asia-Pacific, which are experiencing rapid growth.
Q: Who are the top players in the global ESL market?
A: Leading companies include SES-imagotag, Pricer, SoluM, E Ink, Displaydata, Hanshow, and LG Innotek.
Q: What are the latest technological advancements in the industry?
A: Key advancements include IoT-enabled ESLs, AI-powered price optimization, and energy-efficient e-paper displays.
Q: What is the current size of the global ESL market?
A: The market was valued at USD 932.80 million in 2023 and is projected to reach USD 1484.72 million by 2032, growing at a CAGR of 5.30%.

Get Sample Report PDF for Exclusive Insights
Report Sample Includes
- Table of Contents
- List of Tables & Figures
- Charts, Research Methodology, and more...