Electronic Luggage Tag Market, Trends, Business Strategies 2025-2032

Electronic Luggage Tag Market size was valued at US$ 267 million in 2024 and is projected to reach US$ 512 million by 2032, at a CAGR of 8.7% during the forecast period 2025-2032

PDF Icon Download Sample Report PDF
  • Quick Dispatch

    All Orders

  • Secure Payment

    100% Secure Payment

Price range: $1,500.00 through $4,250.00

Clear

MARKET INSIGHTS

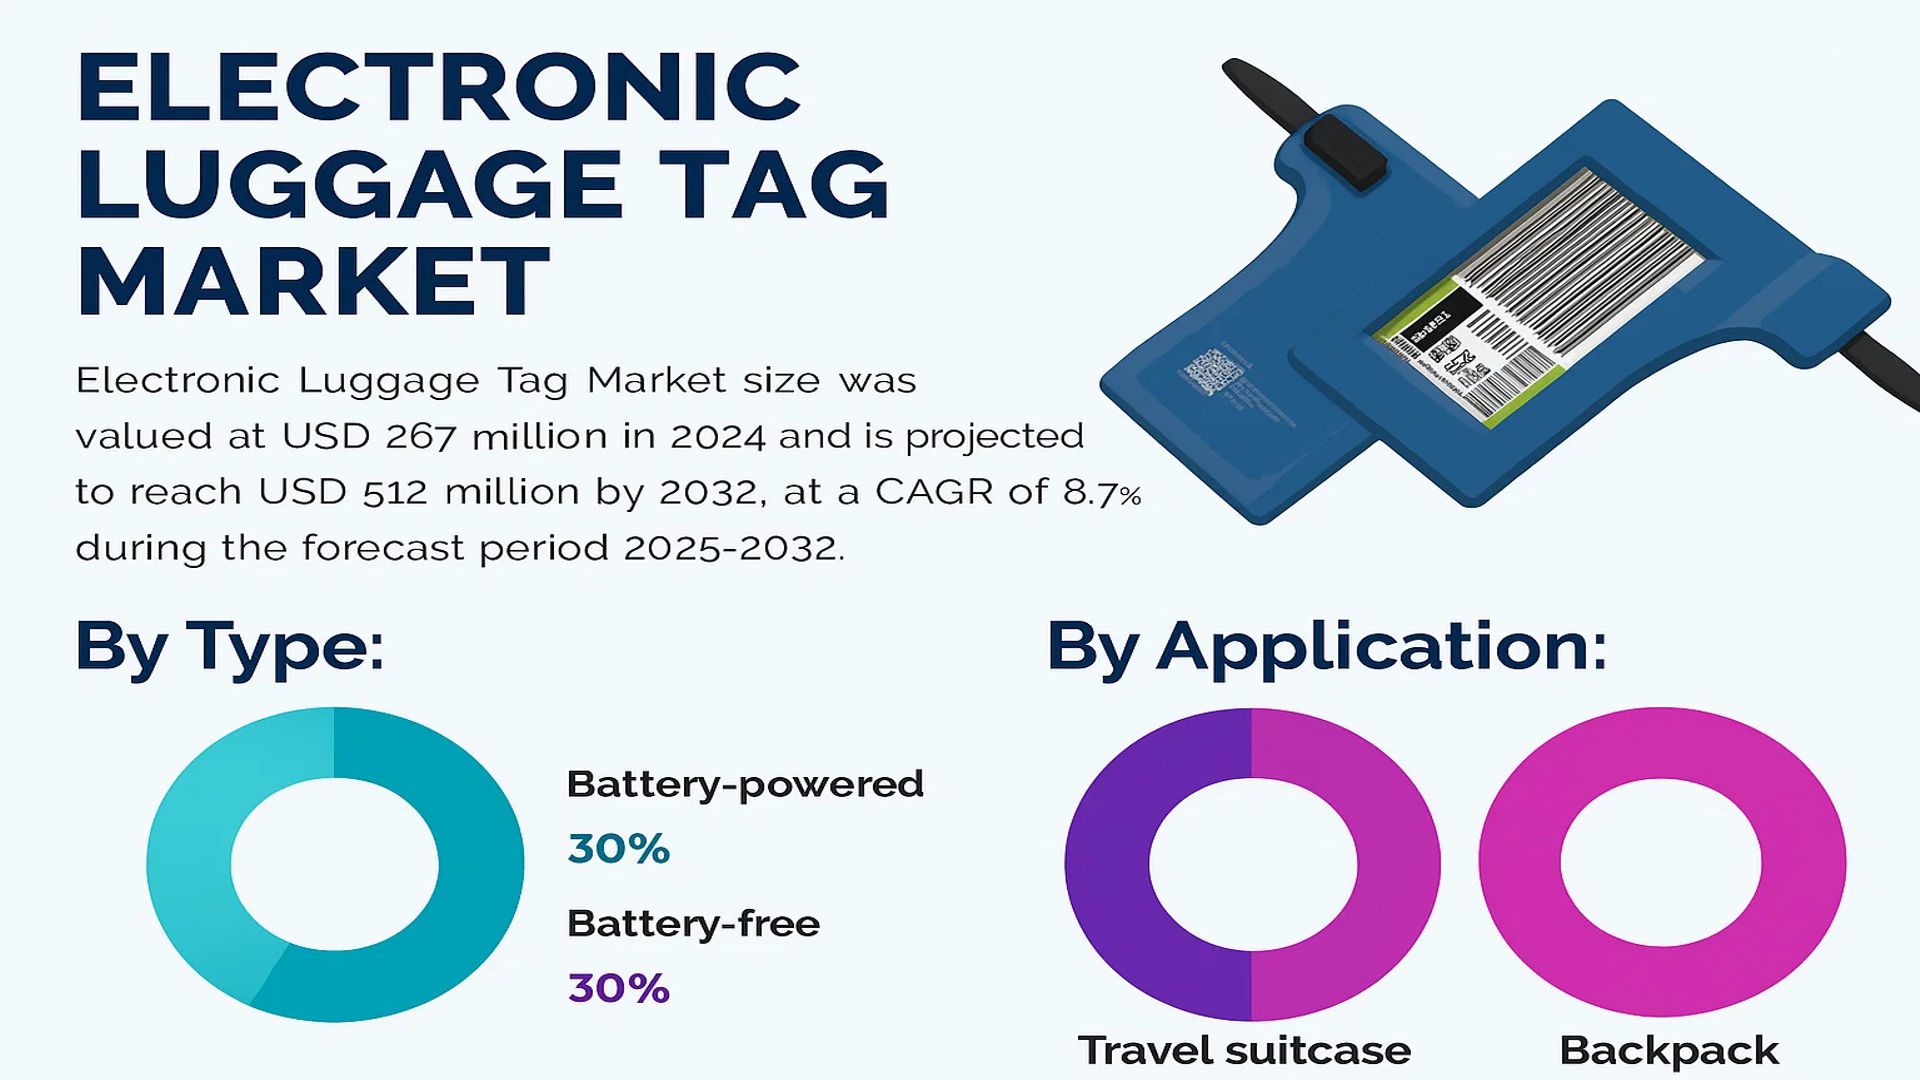
The global Electronic Luggage Tag Market size was valued at US$ 267 million in 2024 and is projected to reach US$ 512 million by 2032, at a CAGR of 8.7% during the forecast period 2025-2032. The U.S. market accounted for 35% of global revenue share in 2024, while China is expected to witness the fastest growth with a projected CAGR of 15.2% through 2032.

Electronic Luggage Tag Market


Electronic luggage tags are smart tracking devices that utilize electronic paper (e-paper) displays to showcase flight information. These IoT-enabled devices streamline baggage handling by enabling remote check-in, reducing airport wait times by an estimated 40%. They serve as digital alternatives to traditional paper tags, offering features like real-time tracking, lost baggage prevention, and contactless processing – particularly valuable in post-pandemic travel environments.

The market growth is primarily driven by increasing air passenger traffic, which reached 4.35 billion globally in 2023 according to IATA, alongside rising adoption of smart luggage solutions. While battery-powered tags currently dominate with 68% market share, battery-free alternatives are gaining traction due to sustainability concerns. Key players including BAGTAG and RIMOWA are investing in NFC and Bluetooth-enabled solutions, with recent partnerships between airlines and tech providers accelerating commercialization. However, high unit costs (averaging USD 50-150) and lack of universal standards remain adoption barriers in emerging markets.

MARKET DYNAMICS

MARKET DRIVERS

Rising Air Travel and Contactless Solutions to Propel Market Growth

The global electronic luggage tag market is experiencing significant growth driven by the resurgence of air travel post-pandemic, with passenger traffic projected to reach 4 billion annually by 2024. Airlines and airports are actively seeking contactless solutions to streamline operations while maintaining hygiene standards. Electronic luggage tags reduce checkout time by up to 40% while eliminating physical contact between passengers and staff. Major airlines including Lufthansa, British Airways, and Emirates have already implemented electronic tagging systems across key hubs, creating a domino effect across the industry.

Technological Advancements in E-paper Displays Accelerate Adoption

Recent breakthroughs in e-paper technology have transformed electronic luggage tags from niche products to mainstream solutions. Modern e-paper displays now offer superior readability, ultra-low power consumption (some models operate for years on a single battery), and exceptional durability – withstanding temperatures from -15°C to 60°C. These technological improvements address previous limitations while meeting stringent aviation requirements. The integration of NFC and Bluetooth connectivity further enhances functionality, allowing real-time baggage tracking through mobile apps.

Furthermore, industry collaborations are accelerating standardization efforts. The International Air Transport Association (IATA) has established guidelines for electronic tagging systems, providing clarity for manufacturers and airlines alike. This regulatory support is crucial for widespread implementation across global aviation networks.

Market data indicates electronic luggage tags can reduce airline baggage handling costs by 15-20%, making them financially attractive beyond just passenger convenience.

Additionally, the growing penetration of smart luggage solutions among premium travelers is creating a halo effect, increasing awareness and demand for electronic tagging options across all traveler segments.

MARKET RESTRAINTS

High Initial Costs and Infrastructure Limitations Hinder Widespread Adoption

Despite their advantages, electronic luggage tags face adoption barriers due to significant upfront costs. The current price point of $40-$150 per unit presents a psychological barrier for many travelers, particularly in price-sensitive markets. Airlines face substantial capital expenditure to retrofit existing baggage handling systems with compatible readers, with full airport implementation costs running into millions of dollars. This financial hurdle makes phased rollouts more likely than immediate widespread adoption.

Operational Challenges
The lack of standardized global infrastructure creates interoperability issues. Not all airports currently support electronic tagging, forcing travelers to use traditional tags for connecting flights at non-equipped facilities. This fragmentation reduces the value proposition for frequent flyers who require consistent solutions across their travel networks.

Technology Limitations
While e-paper technology has improved, some durability concerns remain regarding extreme baggage handling conditions. Cases of screen damage during rough handling have been reported, though this is being addressed through reinforced designs and protective casings in newer models.

MARKET OPPORTUNITIES

Expansion into Emerging Markets and Travel Retail Channels Presents Significant Growth Potential

The Asia-Pacific region represents a major untapped opportunity, with its rapidly growing middle class and increasing air travel penetration. Countries like China and India, projected to account for 40% of global air passenger growth through 2030, are ideal markets for electronic tagging solutions. Local manufacturers are developing cost-optimized versions specifically for these markets, with prices expected to fall below $30 within two years as production scales.

Travel retail channels including airport stores and airline loyalty programs are emerging as key distribution avenues. Several prominent airlines now offer electronic tags as premium add-ons or elite status benefits, effectively subsidizing adoption costs while enhancing customer experience. This strategy has proven successful in converting high-value frequent flyers.

Furthermore, integration with broader smart travel ecosystems – combining electronic tags with digital boarding passes, biometric systems, and baggage tracking – creates opportunities for premium service offerings. The potential to monetize through ancillary services could significantly improve the business case for both airlines and manufacturers.

MARKET CHALLENGES

Regulatory Fragmentation and Security Concerns Pose Implementation Hurdles

The electronic luggage tag market faces complex regulatory challenges as aviation authorities in different regions develop varying technical standards and approval processes. Current regulations in some markets require physical tags as backup, negating some efficiency benefits. The lack of global harmonization creates compliance burdens for manufacturers and slows cross-border implementation.

Security Considerations
Cybersecurity vulnerabilities in some early-generation electronic tags raised concerns about potential spoofing or data interception. While newer versions incorporate advanced encryption,


ELECTRONIC LUGGAGE TAG MARKET TRENDS

Digital Transformation in Travel to Drive Adoption of Electronic Luggage Tags

The global electronic luggage tag market is experiencing robust growth, projected to expand at a compound annual growth rate (CAGR) of approximately 14% from 2024 to 2032. This surge is primarily driven by increasing digitization in the travel sector, where airlines and airports are investing heavily in smart baggage handling solutions. Electronic luggage tags utilize e-paper display technology to automatically update flight details, reducing passenger check-in times by an estimated 40% compared to traditional paper tags. Major airports in Europe and North America have begun adopting these solutions at scale, with adoption rates exceeding 25% among premium travelers. The technology’s ability to integrate with mobile boarding passes and airline apps has positioned it as a critical component of seamless travel experiences.

Other Trends

Contactless Solutions Post-Pandemic

The pandemic accelerated demand for touchless travel technologies, with electronic luggage tags emerging as a key solution for minimizing physical contact during baggage check-in. Airlines report that implementation of these tags has reduced staff-baggage interactions by over 60%, addressing both health concerns and operational efficiency. While adoption was initially concentrated in business-class travelers, recent price reductions have expanded accessibility to economy passengers. The average price per unit decreased by 18% between 2021 and 2023, making the technology more viable for mass-market deployment.

Technological Convergence with IoT Ecosystems

Leading manufacturers are integrating IoT capabilities into electronic luggage tags, enabling real-time tracking through airport networks. This innovation addresses the longstanding issue of lost baggage, which currently costs the aviation industry nearly $2.5 billion annually. Next-generation tags now incorporate Bluetooth Low Energy and RFID technologies, providing travelers with live updates on their luggage location via smartphone apps. Some premium models even feature geofencing alerts and temperature sensors, particularly valuable for pharmaceutical or perishable cargo transport. The market for IoT-enabled tags is growing three times faster than basic e-tag models, signaling strong demand for advanced functionality.

COMPETITIVE LANDSCAPE

Key Industry Players

Technological Innovation and Strategic Partnerships Drive Market Leadership

The global electronic luggage tag market exhibits a dynamic competitive landscape, characterized by both established brands and emerging innovators. BAGTAG currently dominates the sector, holding approximately 25% market share in 2024, thanks to its early-mover advantage and partnerships with major airlines like Lufthansa and Emirates. Their e-ink display technology has become an industry benchmark, setting the standard for reliability and energy efficiency.

RIMOWA and OneBagTag follow closely, collectively accounting for 30% of global revenues. RIMOWA’s integration of electronic tags into premium luggage lines gives it a strong position in the luxury segment, while OneBagTag focuses on affordability and cross-airline compatibility – a strategy that resonates well with frequent flyers using multiple carriers.

What makes this market particularly intriguing is how regional players are gaining traction. ViewTa (South Korea) and TeamUC (China) have captured 15% combined market share in the Asia-Pacific region by tailoring products to local airline requirements and offering NFC-enabled solutions that work seamlessly with mobile boarding passes prevalent in Asian markets.

List of Key Electronic Luggage Tag Companies Profiled

  • BAGTAG (Netherlands)
  • OneBagTag (U.S.)
  • ViewTa (South Korea)
  • TeamUC (China)
  • Bagtap (U.K.)
  • RIMOWA (Germany)
  • Groen&Boothman (Netherlands)

Segment Analysis:

By Type

Battery-Powered Segment Leads Due to Wireless Connectivity Features

The market is segmented based on type into:

  • Battery-powered
    • Subtypes: Rechargeable, replaceable
  • Battery-free
    • Subtypes: RFID-enabled, NFC-enabled

By Application

Travel Suitcase Segment Dominates Owing to Frequent Business Travel Needs

The market is segmented based on application into:

  • Travel suitcase
  • Backpack
  • Sports equipment
  • Musical instruments

By Technology

RFID Technology Dominates for Efficient Baggage Tracking

The market is segmented based on technology into:

  • RFID
  • Bluetooth
  • NFC
  • GPS

By End User

Business Travelers Segment Leads Due to Frequent Travel Requirements

The market is segmented based on end user into:

  • Business travelers
  • Frequent flyers
  • Leisure travelers

Regional Analysis: Electronic Luggage Tag Market

North America
North America, particularly the U.S., is a key market for electronic luggage tags, driven by the region’s emphasis on smart travel solutions and advanced airport infrastructure. The U.S. leads adoption due to high-tech consumer preferences and airline investments in digital baggage tracking systems. Major carriers such as Delta and American Airlines have piloted e-tag programs to streamline baggage handling, reducing passenger wait times by up to 40%. Canada is gradually catching up, with Toronto Pearson International Airport testing electronic tags to enhance efficiency. However, the high initial cost of adoption for both airlines and passengers remains a barrier to mainstream use.

Europe
Europe is at the forefront of electronic luggage tag adoption, propelled by stringent regulations on baggage handling efficiency and sustainability. Airlines like Lufthansa and Air France have integrated e-tags into frequent flyer programs, leveraging RFID technology for seamless check-ins. The EU’s push for contactless travel solutions post-pandemic has further accelerated demand. The region also benefits from strong partnerships between tech providers (e.g., BAGTAG) and luggage manufacturers (e.g., RIMOWA). However, fragmented regulatory frameworks across countries and resistance from budget airlines due to cost concerns temper growth.

Asia-Pacific
APAC is the fastest-growing market, with China and Japan leading due to rising air passenger traffic and government-backed digital transformation initiatives. Chinese airlines, including China Southern, are aggressively promoting e-tags to reduce congestion in major hubs like Beijing Capital Airport. Meanwhile, Japan’s tech-savvy consumers drive demand for luggage equipped with battery-free RFID tags. India presents untapped potential, though adoption lags due to price sensitivity and reliance on traditional baggage systems. Southeast Asia’s growing middle class and tourism sector offer long-term opportunities, particularly in Singapore and Thailand.

South America
The market here is nascent, with Brazil and Argentina witnessing slow but steady adoption. Airlines such as LATAM have introduced electronic tags for premium passengers, but economic instability and limited airport modernization restrict broader implementation. Investment in smart airport projects, like São Paulo’s GRU Airport, could catalyze growth. Cost remains a critical hurdle, as most travelers prioritize affordability over advanced baggage solutions. Nonetheless, increasing business travel and tourism signal gradual uptake in the coming years.

Middle East & Africa
The region shows promise, particularly in the UAE and Saudi Arabia, where luxury travel trends and mega-airport projects (e.g., Dubai’s Al Maktoum International) drive demand. Emirates has been a regional pioneer, offering e-tags for first-class passengers. Africa’s market is hindered by underdeveloped aviation infrastructure, though South Africa’s OR Tambo Airport has begun trials. While high disposable incomes in GCC nations support adoption, broader regional growth depends on improving airport connectivity and reducing technology costs.

Report Scope

This market research report provides a comprehensive analysis of the global and regional Electronic Luggage Tag markets, covering the forecast period 2024–2032. It offers detailed insights into market dynamics, technological advancements, competitive landscape, and key trends shaping the industry.

Key focus areas of the report include:

  • Market Size & Forecast: Historical data and future projections for revenue, unit shipments, and market value across major regions and segments. The global Electronic Luggage Tag market was valued at US$ 267 million in 2024 and is projected to reach US$ 512 million by 2032, growing at a CAGR of 8.7% during the forecast period.
  • Segmentation Analysis: Detailed breakdown by product type (battery-powered vs. battery-free), application (travel suitcases vs. backpacks), and end-user to identify high-growth segments and investment opportunities. The battery segment is expected to grow at 8.2% CAGR through 2032.
  • Regional Outlook: Insights into market performance across North America (estimated at USD 65 million in 2024), Europe, Asia-Pacific (China projected to reach USD 95 million by 2032), Latin America, and the Middle East & Africa, including country-level analysis.
  • Competitive Landscape: Profiles of leading market participants including BAGTAG, RIMOWA, OneBagTag, and ViewTa, covering their product offerings, R&D focus, manufacturing capacity, and recent developments. The top five players accounted for approximately 58% market share in 2024.
  • Technology Trends & Innovation: Assessment of emerging technologies including NFC integration, IoT connectivity, and advanced e-paper displays in luggage tag solutions.
  • Market Drivers & Restraints: Evaluation of factors driving market growth including increasing air passenger traffic (projected to reach 4 billion annually by 2024) along with challenges like high product costs and battery life limitations.
  • Stakeholder Analysis: Insights for luggage manufacturers, airlines, technology providers, investors, and policymakers regarding the evolving smart luggage ecosystem.

Primary and secondary research methods are employed, including interviews with industry experts, data from aviation authorities, and market intelligence from verified sources to ensure the accuracy and reliability of the insights presented.

FREQUENTLY ASKED QUESTIONS:

What is the current market size of Global Electronic Luggage Tag Market?

-> Electronic Luggage Tag Market size was valued at US$ 267 million in 2024 and is projected to reach US$ 512 million by 2032, at a CAGR of 8.7% during the forecast period 2025-2032.

Which key companies operate in Global Electronic Luggage Tag Market?

-> Key players include BAGTAG, RIMOWA, OneBagTag, ViewTa, TeamUC, Bagtap, and Groen&Boothman, among others.

What are the key growth drivers?

-> Key growth drivers include increasing air travel demand, digital transformation in aviation, and demand for contactless baggage solutions.

Which region dominates the market?

-> North America currently leads the market, while Asia-Pacific is projected to be the fastest-growing region.

What are the emerging trends?

-> Emerging trends include integration with airline apps, solar-powered tags, and blockchain-based baggage tracking.

Electronic Luggage Tag Market, Trends, Business Strategies 2025-2032

Get Sample Report PDF for Exclusive Insights

Report Sample Includes

  • Table of Contents
  • List of Tables & Figures
  • Charts, Research Methodology, and more...
PDF Icon Download Sample Report PDF

Download Sample Report

Table of Content

1 Introduction to Research & Analysis Reports
1.1 Electronic Luggage Tag Market Definition
1.2 Market Segments
1.2.1 Segment by Type
1.2.2 Segment by Application
1.3 Global Electronic Luggage Tag Market Overview
1.4 Features & Benefits of This Report
1.5 Methodology & Sources of Information
1.5.1 Research Methodology
1.5.2 Research Process
1.5.3 Base Year
1.5.4 Report Assumptions & Caveats
2 Global Electronic Luggage Tag Overall Market Size
2.1 Global Electronic Luggage Tag Market Size: 2024 VS 2032
2.2 Global Electronic Luggage Tag Market Size, Prospects & Forecasts: 2020-2032
2.3 Global Electronic Luggage Tag Sales: 2020-2032
3 Company Landscape
3.1 Top Electronic Luggage Tag Players in Global Market
3.2 Top Global Electronic Luggage Tag Companies Ranked by Revenue
3.3 Global Electronic Luggage Tag Revenue by Companies
3.4 Global Electronic Luggage Tag Sales by Companies
3.5 Global Electronic Luggage Tag Price by Manufacturer (2020-2025)
3.6 Top 3 and Top 5 Electronic Luggage Tag Companies in Global Market, by Revenue in 2024
3.7 Global Manufacturers Electronic Luggage Tag Product Type
3.8 Tier 1, Tier 2, and Tier 3 Electronic Luggage Tag Players in Global Market
3.8.1 List of Global Tier 1 Electronic Luggage Tag Companies
3.8.2 List of Global Tier 2 and Tier 3 Electronic Luggage Tag Companies
4 Sights by Product
4.1 Overview
4.1.1 Segment by Type – Global Electronic Luggage Tag Market Size Markets, 2024 & 2032
4.1.2 Battery
4.1.3 No Battery
4.2 Segment by Type – Global Electronic Luggage Tag Revenue & Forecasts
4.2.1 Segment by Type – Global Electronic Luggage Tag Revenue, 2020-2025
4.2.2 Segment by Type – Global Electronic Luggage Tag Revenue, 2026-2032
4.2.3 Segment by Type – Global Electronic Luggage Tag Revenue Market Share, 2020-2032
4.3 Segment by Type – Global Electronic Luggage Tag Sales & Forecasts
4.3.1 Segment by Type – Global Electronic Luggage Tag Sales, 2020-2025
4.3.2 Segment by Type – Global Electronic Luggage Tag Sales, 2026-2032
4.3.3 Segment by Type – Global Electronic Luggage Tag Sales Market Share, 2020-2032
4.4 Segment by Type – Global Electronic Luggage Tag Price (Manufacturers Selling Prices), 2020-2032
5 Sights by Application
5.1 Overview
5.1.1 Segment by Application – Global Electronic Luggage Tag Market Size, 2024 & 2032
5.1.2 Travel Suitcase
5.1.3 Backpack
5.2 Segment by Application – Global Electronic Luggage Tag Revenue & Forecasts
5.2.1 Segment by Application – Global Electronic Luggage Tag Revenue, 2020-2025
5.2.2 Segment by Application – Global Electronic Luggage Tag Revenue, 2026-2032
5.2.3 Segment by Application – Global Electronic Luggage Tag Revenue Market Share, 2020-2032
5.3 Segment by Application – Global Electronic Luggage Tag Sales & Forecasts
5.3.1 Segment by Application – Global Electronic Luggage Tag Sales, 2020-2025
5.3.2 Segment by Application – Global Electronic Luggage Tag Sales, 2026-2032
5.3.3 Segment by Application – Global Electronic Luggage Tag Sales Market Share, 2020-2032
5.4 Segment by Application – Global Electronic Luggage Tag Price (Manufacturers Selling Prices), 2020-2032
6 Sights by Region
6.1 By Region – Global Electronic Luggage Tag Market Size, 2024 & 2032
6.2 By Region – Global Electronic Luggage Tag Revenue & Forecasts
6.2.1 By Region – Global Electronic Luggage Tag Revenue, 2020-2025
6.2.2 By Region – Global Electronic Luggage Tag Revenue, 2026-2032
6.2.3 By Region – Global Electronic Luggage Tag Revenue Market Share, 2020-2032
6.3 By Region – Global Electronic Luggage Tag Sales & Forecasts
6.3.1 By Region – Global Electronic Luggage Tag Sales, 2020-2025
6.3.2 By Region – Global Electronic Luggage Tag Sales, 2026-2032
6.3.3 By Region – Global Electronic Luggage Tag Sales Market Share, 2020-2032
6.4 North America
6.4.1 By Country – North America Electronic Luggage Tag Revenue, 2020-2032
6.4.2 By Country – North America Electronic Luggage Tag Sales, 2020-2032
6.4.3 United States Electronic Luggage Tag Market Size, 2020-2032
6.4.4 Canada Electronic Luggage Tag Market Size, 2020-2032
6.4.5 Mexico Electronic Luggage Tag Market Size, 2020-2032
6.5 Europe
6.5.1 By Country – Europe Electronic Luggage Tag Revenue, 2020-2032
6.5.2 By Country – Europe Electronic Luggage Tag Sales, 2020-2032
6.5.3 Germany Electronic Luggage Tag Market Size, 2020-2032
6.5.4 France Electronic Luggage Tag Market Size, 2020-2032
6.5.5 U.K. Electronic Luggage Tag Market Size, 2020-2032
6.5.6 Italy Electronic Luggage Tag Market Size, 2020-2032
6.5.7 Russia Electronic Luggage Tag Market Size, 2020-2032
6.5.8 Nordic Countries Electronic Luggage Tag Market Size, 2020-2032
6.5.9 Benelux Electronic Luggage Tag Market Size, 2020-2032
6.6 Asia
6.6.1 By Region – Asia Electronic Luggage Tag Revenue, 2020-2032
6.6.2 By Region – Asia Electronic Luggage Tag Sales, 2020-2032
6.6.3 China Electronic Luggage Tag Market Size, 2020-2032
6.6.4 Japan Electronic Luggage Tag Market Size, 2020-2032
6.6.5 South Korea Electronic Luggage Tag Market Size, 2020-2032
6.6.6 Southeast Asia Electronic Luggage Tag Market Size, 2020-2032
6.6.7 India Electronic Luggage Tag Market Size, 2020-2032
6.7 South America
6.7.1 By Country – South America Electronic Luggage Tag Revenue, 2020-2032
6.7.2 By Country – South America Electronic Luggage Tag Sales, 2020-2032
6.7.3 Brazil Electronic Luggage Tag Market Size, 2020-2032
6.7.4 Argentina Electronic Luggage Tag Market Size, 2020-2032
6.8 Middle East & Africa
6.8.1 By Country – Middle East & Africa Electronic Luggage Tag Revenue, 2020-2032
6.8.2 By Country – Middle East & Africa Electronic Luggage Tag Sales, 2020-2032
6.8.3 Turkey Electronic Luggage Tag Market Size, 2020-2032
6.8.4 Israel Electronic Luggage Tag Market Size, 2020-2032
6.8.5 Saudi Arabia Electronic Luggage Tag Market Size, 2020-2032
6.8.6 UAE Electronic Luggage Tag Market Size, 2020-2032
7 Manufacturers & Brands Profiles
7.1 BAGTAG
7.1.1 BAGTAG Company Summary
7.1.2 BAGTAG Business Overview
7.1.3 BAGTAG Electronic Luggage Tag Major Product Offerings
7.1.4 BAGTAG Electronic Luggage Tag Sales and Revenue in Global (2020-2025)
7.1.5 BAGTAG Key News & Latest Developments
7.2 OneBagTag
7.2.1 OneBagTag Company Summary
7.2.2 OneBagTag Business Overview
7.2.3 OneBagTag Electronic Luggage Tag Major Product Offerings
7.2.4 OneBagTag Electronic Luggage Tag Sales and Revenue in Global (2020-2025)
7.2.5 OneBagTag Key News & Latest Developments
7.3 ViewTa
7.3.1 ViewTa Company Summary
7.3.2 ViewTa Business Overview
7.3.3 ViewTa Electronic Luggage Tag Major Product Offerings
7.3.4 ViewTa Electronic Luggage Tag Sales and Revenue in Global (2020-2025)
7.3.5 ViewTa Key News & Latest Developments
7.4 TeamUC
7.4.1 TeamUC Company Summary
7.4.2 TeamUC Business Overview
7.4.3 TeamUC Electronic Luggage Tag Major Product Offerings
7.4.4 TeamUC Electronic Luggage Tag Sales and Revenue in Global (2020-2025)
7.4.5 TeamUC Key News & Latest Developments
7.5 Bagtap
7.5.1 Bagtap Company Summary
7.5.2 Bagtap Business Overview
7.5.3 Bagtap Electronic Luggage Tag Major Product Offerings
7.5.4 Bagtap Electronic Luggage Tag Sales and Revenue in Global (2020-2025)
7.5.5 Bagtap Key News & Latest Developments
7.6 Groen&Boothman
7.6.1 Groen&Boothman Company Summary
7.6.2 Groen&Boothman Business Overview
7.6.3 Groen&Boothman Electronic Luggage Tag Major Product Offerings
7.6.4 Groen&Boothman Electronic Luggage Tag Sales and Revenue in Global (2020-2025)
7.6.5 Groen&Boothman Key News & Latest Developments
7.7 RIMOWA
7.7.1 RIMOWA Company Summary
7.7.2 RIMOWA Business Overview
7.7.3 RIMOWA Electronic Luggage Tag Major Product Offerings
7.7.4 RIMOWA Electronic Luggage Tag Sales and Revenue in Global (2020-2025)
7.7.5 RIMOWA Key News & Latest Developments
8 Global Electronic Luggage Tag Production Capacity, Analysis
8.1 Global Electronic Luggage Tag Production Capacity, 2020-2032
8.2 Electronic Luggage Tag Production Capacity of Key Manufacturers in Global Market
8.3 Global Electronic Luggage Tag Production by Region
9 Key Market Trends, Opportunity, Drivers and Restraints
9.1 Market Opportunities & Trends
9.2 Market Drivers
9.3 Market Restraints
10 Electronic Luggage Tag Supply Chain Analysis
10.1 Electronic Luggage Tag Industry Value Chain
10.2 Electronic Luggage Tag Upstream Market
10.3 Electronic Luggage Tag Downstream and Clients
10.4 Marketing Channels Analysis
10.4.1 Marketing Channels
10.4.2 Electronic Luggage Tag Distributors and Sales Agents in Global
11 Conclusion
12 Appendix
12.1 Note
12.2 Examples of Clients
12.3 DisclaimerList of Tables
Table 1. Key Players of Electronic Luggage Tag in Global Market
Table 2. Top Electronic Luggage Tag Players in Global Market, Ranking by Revenue (2024)
Table 3. Global Electronic Luggage Tag Revenue by Companies, (US$, Mn), 2020-2025
Table 4. Global Electronic Luggage Tag Revenue Share by Companies, 2020-2025
Table 5. Global Electronic Luggage Tag Sales by Companies, (M Units), 2020-2025
Table 6. Global Electronic Luggage Tag Sales Share by Companies, 2020-2025
Table 7. Key Manufacturers Electronic Luggage Tag Price (2020-2025) & (US$/K Unit)
Table 8. Global Manufacturers Electronic Luggage Tag Product Type
Table 9. List of Global Tier 1 Electronic Luggage Tag Companies, Revenue (US$, Mn) in 2024 and Market Share
Table 10. List of Global Tier 2 and Tier 3 Electronic Luggage Tag Companies, Revenue (US$, Mn) in 2024 and Market Share
Table 11. Segment by Type – Global Electronic Luggage Tag Revenue, (US$, Mn), 2024 & 2032
Table 12. Segment by Type – Global Electronic Luggage Tag Revenue (US$, Mn), 2020-2025
Table 13. Segment by Type – Global Electronic Luggage Tag Revenue (US$, Mn), 2026-2032
Table 14. Segment by Type – Global Electronic Luggage Tag Sales (M Units), 2020-2025
Table 15. Segment by Type – Global Electronic Luggage Tag Sales (M Units), 2026-2032
Table 16. Segment by Application – Global Electronic Luggage Tag Revenue, (US$, Mn), 2024 & 2032
Table 17. Segment by Application – Global Electronic Luggage Tag Revenue, (US$, Mn), 2020-2025
Table 18. Segment by Application – Global Electronic Luggage Tag Revenue, (US$, Mn), 2026-2032
Table 19. Segment by Application – Global Electronic Luggage Tag Sales, (M Units), 2020-2025
Table 20. Segment by Application – Global Electronic Luggage Tag Sales, (M Units), 2026-2032
Table 21. By Region – Global Electronic Luggage Tag Revenue, (US$, Mn), 2025-2032
Table 22. By Region – Global Electronic Luggage Tag Revenue, (US$, Mn), 2020-2025
Table 23. By Region – Global Electronic Luggage Tag Revenue, (US$, Mn), 2026-2032
Table 24. By Region – Global Electronic Luggage Tag Sales, (M Units), 2020-2025
Table 25. By Region – Global Electronic Luggage Tag Sales, (M Units), 2026-2032
Table 26. By Country – North America Electronic Luggage Tag Revenue, (US$, Mn), 2020-2025
Table 27. By Country – North America Electronic Luggage Tag Revenue, (US$, Mn), 2026-2032
Table 28. By Country – North America Electronic Luggage Tag Sales, (M Units), 2020-2025
Table 29. By Country – North America Electronic Luggage Tag Sales, (M Units), 2026-2032
Table 30. By Country – Europe Electronic Luggage Tag Revenue, (US$, Mn), 2020-2025
Table 31. By Country – Europe Electronic Luggage Tag Revenue, (US$, Mn), 2026-2032
Table 32. By Country – Europe Electronic Luggage Tag Sales, (M Units), 2020-2025
Table 33. By Country – Europe Electronic Luggage Tag Sales, (M Units), 2026-2032
Table 34. By Region – Asia Electronic Luggage Tag Revenue, (US$, Mn), 2020-2025
Table 35. By Region – Asia Electronic Luggage Tag Revenue, (US$, Mn), 2026-2032
Table 36. By Region – Asia Electronic Luggage Tag Sales, (M Units), 2020-2025
Table 37. By Region – Asia Electronic Luggage Tag Sales, (M Units), 2026-2032
Table 38. By Country – South America Electronic Luggage Tag Revenue, (US$, Mn), 2020-2025
Table 39. By Country – South America Electronic Luggage Tag Revenue, (US$, Mn), 2026-2032
Table 40. By Country – South America Electronic Luggage Tag Sales, (M Units), 2020-2025
Table 41. By Country – South America Electronic Luggage Tag Sales, (M Units), 2026-2032
Table 42. By Country – Middle East & Africa Electronic Luggage Tag Revenue, (US$, Mn), 2020-2025
Table 43. By Country – Middle East & Africa Electronic Luggage Tag Revenue, (US$, Mn), 2026-2032
Table 44. By Country – Middle East & Africa Electronic Luggage Tag Sales, (M Units), 2020-2025
Table 45. By Country – Middle East & Africa Electronic Luggage Tag Sales, (M Units), 2026-2032
Table 46. BAGTAG Company Summary
Table 47. BAGTAG Electronic Luggage Tag Product Offerings
Table 48. BAGTAG Electronic Luggage Tag Sales (M Units), Revenue (US$, Mn) and Average Price (US$/K Unit) & (2020-2025)
Table 49. BAGTAG Key News & Latest Developments
Table 50. OneBagTag Company Summary
Table 51. OneBagTag Electronic Luggage Tag Product Offerings
Table 52. OneBagTag Electronic Luggage Tag Sales (M Units), Revenue (US$, Mn) and Average Price (US$/K Unit) & (2020-2025)
Table 53. OneBagTag Key News & Latest Developments
Table 54. ViewTa Company Summary
Table 55. ViewTa Electronic Luggage Tag Product Offerings
Table 56. ViewTa Electronic Luggage Tag Sales (M Units), Revenue (US$, Mn) and Average Price (US$/K Unit) & (2020-2025)
Table 57. ViewTa Key News & Latest Developments
Table 58. TeamUC Company Summary
Table 59. TeamUC Electronic Luggage Tag Product Offerings
Table 60. TeamUC Electronic Luggage Tag Sales (M Units), Revenue (US$, Mn) and Average Price (US$/K Unit) & (2020-2025)
Table 61. TeamUC Key News & Latest Developments
Table 62. Bagtap Company Summary
Table 63. Bagtap Electronic Luggage Tag Product Offerings
Table 64. Bagtap Electronic Luggage Tag Sales (M Units), Revenue (US$, Mn) and Average Price (US$/K Unit) & (2020-2025)
Table 65. Bagtap Key News & Latest Developments
Table 66. Groen&Boothman Company Summary
Table 67. Groen&Boothman Electronic Luggage Tag Product Offerings
Table 68. Groen&Boothman Electronic Luggage Tag Sales (M Units), Revenue (US$, Mn) and Average Price (US$/K Unit) & (2020-2025)
Table 69. Groen&Boothman Key News & Latest Developments
Table 70. RIMOWA Company Summary
Table 71. RIMOWA Electronic Luggage Tag Product Offerings
Table 72. RIMOWA Electronic Luggage Tag Sales (M Units), Revenue (US$, Mn) and Average Price (US$/K Unit) & (2020-2025)
Table 73. RIMOWA Key News & Latest Developments
Table 74. Electronic Luggage Tag Capacity of Key Manufacturers in Global Market, 2023-2025 (M Units)
Table 75. Global Electronic Luggage Tag Capacity Market Share of Key Manufacturers, 2023-2025
Table 76. Global Electronic Luggage Tag Production by Region, 2020-2025 (M Units)
Table 77. Global Electronic Luggage Tag Production by Region, 2026-2032 (M Units)
Table 78. Electronic Luggage Tag Market Opportunities & Trends in Global Market
Table 79. Electronic Luggage Tag Market Drivers in Global Market
Table 80. Electronic Luggage Tag Market Restraints in Global Market
Table 81. Electronic Luggage Tag Raw Materials
Table 82. Electronic Luggage Tag Raw Materials Suppliers in Global Market
Table 83. Typical Electronic Luggage Tag Downstream
Table 84. Electronic Luggage Tag Downstream Clients in Global Market
Table 85. Electronic Luggage Tag Distributors and Sales Agents in Global Market

List of Figures
Figure 1. Electronic Luggage Tag Product Picture
Figure 2. Electronic Luggage Tag Segment by Type in 2024
Figure 3. Electronic Luggage Tag Segment by Application in 2024
Figure 4. Global Electronic Luggage Tag Market Overview: 2024
Figure 5. Key Caveats
Figure 6. Global Electronic Luggage Tag Market Size: 2024 VS 2032 (US$, Mn)
Figure 7. Global Electronic Luggage Tag Revenue: 2020-2032 (US$, Mn)
Figure 8. Electronic Luggage Tag Sales in Global Market: 2020-2032 (M Units)
Figure 9. The Top 3 and 5 Players Market Share by Electronic Luggage Tag Revenue in 2024
Figure 10. Segment by Type – Global Electronic Luggage Tag Revenue, (US$, Mn), 2024 & 2032
Figure 11. Segment by Type – Global Electronic Luggage Tag Revenue Market Share, 2020-2032
Figure 12. Segment by Type – Global Electronic Luggage Tag Sales Market Share, 2020-2032
Figure 13. Segment by Type – Global Electronic Luggage Tag Price (US$/K Unit), 2020-2032
Figure 14. Segment by Application – Global Electronic Luggage Tag Revenue, (US$, Mn), 2024 & 2032
Figure 15. Segment by Application – Global Electronic Luggage Tag Revenue Market Share, 2020-2032
Figure 16. Segment by Application – Global Electronic Luggage Tag Sales Market Share, 2020-2032
Figure 17. Segment by Application -Global Electronic Luggage Tag Price (US$/K Unit), 2020-2032
Figure 18. By Region – Global Electronic Luggage Tag Revenue, (US$, Mn), 2025 & 2032
Figure 19. By Region – Global Electronic Luggage Tag Revenue Market Share, 2020 VS 2024 VS 2032
Figure 20. By Region – Global Electronic Luggage Tag Revenue Market Share, 2020-2032
Figure 21. By Region – Global Electronic Luggage Tag Sales Market Share, 2020-2032
Figure 22. By Country – North America Electronic Luggage Tag Revenue Market Share, 2020-2032
Figure 23. By Country – North America Electronic Luggage Tag Sales Market Share, 2020-2032
Figure 24. United States Electronic Luggage Tag Revenue, (US$, Mn), 2020-2032
Figure 25. Canada Electronic Luggage Tag Revenue, (US$, Mn), 2020-2032
Figure 26. Mexico Electronic Luggage Tag Revenue, (US$, Mn), 2020-2032
Figure 27. By Country – Europe Electronic Luggage Tag Revenue Market Share, 2020-2032
Figure 28. By Country – Europe Electronic Luggage Tag Sales Market Share, 2020-2032
Figure 29. Germany Electronic Luggage Tag Revenue, (US$, Mn), 2020-2032
Figure 30. France Electronic Luggage Tag Revenue, (US$, Mn), 2020-2032
Figure 31. U.K. Electronic Luggage Tag Revenue, (US$, Mn), 2020-2032
Figure 32. Italy Electronic Luggage Tag Revenue, (US$, Mn), 2020-2032
Figure 33. Russia Electronic Luggage Tag Revenue, (US$, Mn), 2020-2032
Figure 34. Nordic Countries Electronic Luggage Tag Revenue, (US$, Mn), 2020-2032
Figure 35. Benelux Electronic Luggage Tag Revenue, (US$, Mn), 2020-2032
Figure 36. By Region – Asia Electronic Luggage Tag Revenue Market Share, 2020-2032
Figure 37. By Region – Asia Electronic Luggage Tag Sales Market Share, 2020-2032
Figure 38. China Electronic Luggage Tag Revenue, (US$, Mn), 2020-2032
Figure 39. Japan Electronic Luggage Tag Revenue, (US$, Mn), 2020-2032
Figure 40. South Korea Electronic Luggage Tag Revenue, (US$, Mn), 2020-2032
Figure 41. Southeast Asia Electronic Luggage Tag Revenue, (US$, Mn), 2020-2032
Figure 42. India Electronic Luggage Tag Revenue, (US$, Mn), 2020-2032
Figure 43. By Country – South America Electronic Luggage Tag Revenue Market Share, 2020-2032
Figure 44. By Country – South America Electronic Luggage Tag Sales, Market Share, 2020-2032
Figure 45. Brazil Electronic Luggage Tag Revenue, (US$, Mn), 2020-2032
Figure 46. Argentina Electronic Luggage Tag Revenue, (US$, Mn), 2020-2032
Figure 47. By Country – Middle East & Africa Electronic Luggage Tag Revenue, Market Share, 2020-2032
Figure 48. By Country – Middle East & Africa Electronic Luggage Tag Sales, Market Share, 2020-2032
Figure 49. Turkey Electronic Luggage Tag Revenue, (US$, Mn), 2020-2032
Figure 50. Israel Electronic Luggage Tag Revenue, (US$, Mn), 2020-2032
Figure 51. Saudi Arabia Electronic Luggage Tag Revenue, (US$, Mn), 2020-2032
Figure 52. UAE Electronic Luggage Tag Revenue, (US$, Mn), 2020-2032
Figure 53. Global Electronic Luggage Tag Production Capacity (M Units), 2020-2032
Figure 54. The Percentage of Production Electronic Luggage Tag by Region, 2024 VS 2032
Figure 55. Electronic Luggage Tag Industry Value Chain
Figure 56. Marketing Channels