Electronic IMU Sensors Market, Global Business Strategies 2026-2033

Electronic IMU Sensors Market was valued at USD 2017 million in 2025 and is projected to reach USD 2772 million by 2033, exhibiting a CAGR of 4.8% during the forecast period.

PDF Icon Download Sample Report PDF
  • Quick Dispatch

    All Orders

  • Secure Payment

    100% Secure Payment

Price range: $1,500.00 through $4,250.00

Clear

Market Insights

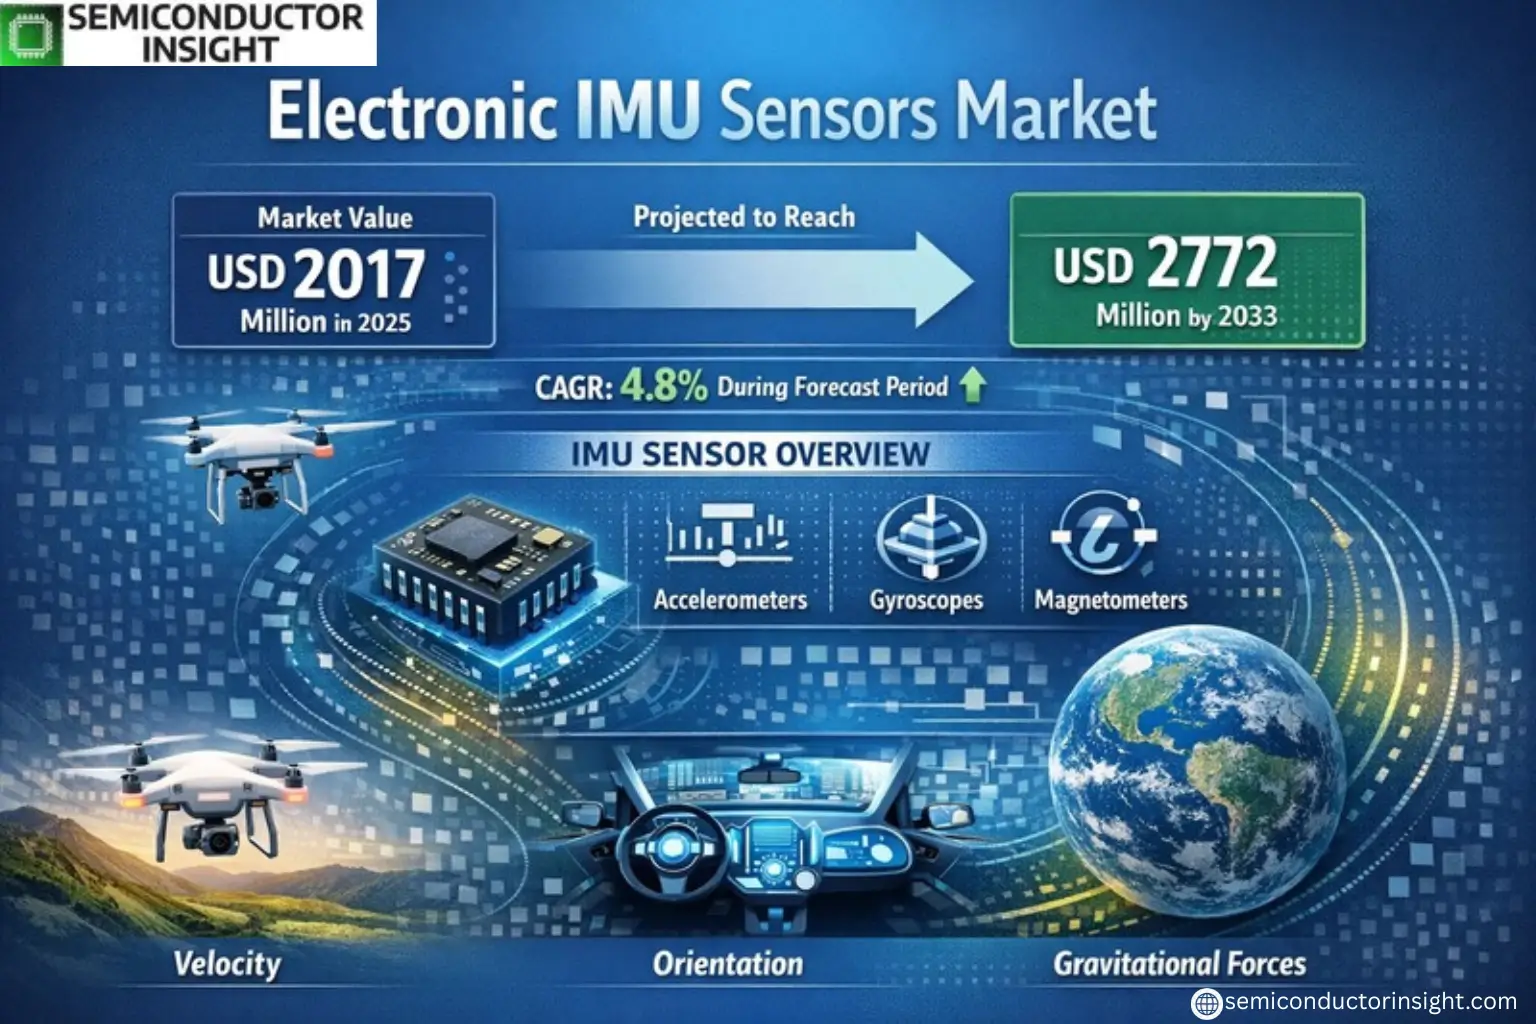
Global Electronic IMU Sensors Market was valued at USD 2017 million in 2025 and is projected to reach USD 2772 million by 2033, exhibiting a CAGR of 4.8% during the forecast period.

An inertial measurement unit (IMU) sensor is an electronic device that measures and reports a craft’s velocity, orientation, and gravitational forces using a combination of accelerometers and gyroscopes, sometimes also magnetometers. These sensors are critical for high-performance applications in aerospace, defense, industrial automation, and naval systems. The market excludes consumer-grade or automotive IMUs, focusing instead on precision-driven sectors where accuracy and reliability are paramount.

The market growth is driven by increasing demand for navigation systems in unmanned aerial vehicles (UAVs), advancements in MEMS technology, and rising defense expenditures globally. North America dominates the market with a 40% share due to strong aerospace and defense sectors, while Europe and China collectively account for approximately 50%. Key players like Honeywell International, Northrop Grumman, and SAFRAN hold about 75% of the market share through innovative product development and strategic partnerships.

Xyz market size & forecast

MARKET DRIVERS

Growing Demand for Navigation and Stabilization Systems

Electronic IMU Sensors Market is experiencing significant growth due to rising demand in aerospace, defense, and automotive industries. These sensors are critical for navigation, motion tracking, and stabilization in autonomous vehicles, drones, and industrial robotics. Global push towards automation continues to fuel adoption, with an estimated 18% annual growth in industrial applications alone.

Advancements in MEMS Technology

Micro-Electro-Mechanical Systems (MEMS) innovations have enabled smaller, more cost-effective electronic IMU sensors with improved accuracy. This has expanded their use in consumer electronics, including smartphones and wearable devices. The consumer segment now accounts for nearly 27% of total IMU sensor shipments worldwide.

Military modernization programs across major economies continue to drive high-performance IMU sensor development, particularly for missile guidance and unmanned systems.

MARKET CHALLENGES

High Development Costs and Technical Complexities

Manufacturing precision electronic IMU sensors requires specialized facilities and expertise, creating significant barriers to entry. The average R&D cycle for new IMU sensor models exceeds 24 months, with development costs reaching upwards of USD 5 million for aerospace-grade units.

Other Challenges

Calibration and Error Compensation
Maintaining accuracy over time remains a technical hurdle, especially in harsh environments where thermal and mechanical stresses impact sensor performance. Vibration and shock resistance continues to be an area requiring ongoing innovation.

MARKET RESTRAINTS

Export Restrictions in Defense Applications

Stringent international regulations on dual-use technologies limit the global trade of advanced electronic IMU sensors, particularly those with military-grade specifications. This creates fragmented regional markets and complicates supply chains for manufacturers.

MARKET OPPORTUNITIES

Emerging Industrial IoT Applications

The Industrial Internet of Things creates new demand for electronic IMU sensors in predictive maintenance and equipment monitoring systems. This sector is projected to account for 31% of non-military IMU sensor revenue by 2026, growing at a 22% CAGR from current levels.
Electronic IMU Sensors Market Trends

Growing Demand in Aerospace and Defense Applications

Electronic IMU Sensors Market is experiencing steady growth, projected to reach USD 2.77 billion by 2033 at a 4.8% CAGR. Aerospace applications dominate demand, accounting for over 40% of market share, followed by defense systems. This growth stems from increasing adoption in unmanned aerial vehicles, missile guidance systems, and advanced navigation platforms requiring high-precision motion tracking.

Other Trends

Technological Advancements in MEMS-based IMUs

Si/Quartz MEMS and emerging HRG technologies are gaining traction, offering improved accuracy and reliability while reducing size and power consumption. These innovations are particularly valuable for space-constrained applications in both commercial and military sectors.

Regional Market Concentration

North America leads the Electronic IMU Sensors Market with 40% share, driven by substantial defense spending and aerospace innovation. Europe and China collectively hold 50% market share, with China showing the fastest growth rate due to expanding domestic aerospace capabilities and military modernization programs.

Other Trends

Industry Consolidation

The market remains concentrated, with top five players (Honeywell, Northrop Grumman, SAFRAN, Thales, Kearfott) controlling 75% of global sales. Recent years have seen strategic acquisitions as companies seek to expand their technological capabilities and market reach in high-performance IMU segments.

Increasing Industrial Applications

Non-defense industrial applications, particularly in offshore and naval sectors, are emerging as significant growth areas. These applications demand ruggedized IMU sensors for precision positioning and stabilization in harsh environments, creating new opportunities for market expansion beyond traditional aerospace/defense sectors.

COMPETITIVE LANDSCAPE

Key Industry Players

Strategic Positioning in the High-Performance IMU Sensors Sector

Global Electronic IMU Sensors Market is dominated by a few established aerospace and defense contractors, with Honeywell International and Northrop Grumman collectively controlling nearly 40% of the market share. These leaders specialize in Fiber Optic Gyroscope (FOG) and Ring Laser Gyroscope (RLG) technologies, primarily serving military and commercial aerospace applications. SAFRAN and Thales follow closely, leveraging their European base to cater to Airbus and regional defense programs with advanced MEMS-based IMUs.

Mid-tier players like Kearfott, KVH Industries, and UTC carve out specialized niches Kearfott in precision navigation for missile guidance, KVH in miniature FOG solutions, while UTC excels in ruggedized industrial IMUs. Emerging competitors such as SBG Systems and VectorNav disrupt traditional segments with cost-effective MEMS-IMU fusion for autonomous systems, though they currently hold sub-5% market shares.

List of Key Electronic IMU Sensors Companies Profiled

Segment Analysis:

Segment Category Sub-Segments Key Insights
By Type
  • FOG
  • RLG
  • DTG and Others Mechanical
  • Si/Quartz MEMS
  • HRG and Emerging Technology
FOG

  • Dominates due to superior performance in extreme environments and high-precision requirements
  • Preferred for aerospace and defense applications where reliability is critical
  • Newer technologies like HRG gaining traction but face adoption challenges in mission-critical systems
By Application
  • Aerospace
  • Defense
  • Industrial, Naval, Offshore
Aerospace

  • Largest application segment due to critical navigation requirements in commercial and military aviation
  • Increased demand for autonomous flight systems is driving innovation in IMU sensor technology
  • Stringent certification requirements create high barriers to entry for new suppliers
By End User
  • Commercial Aviation
  • Military & Defense
  • Maritime & Offshore
Military & Defense

  • Primary end-user due to extensive need for precision navigation in defense systems
  • Technological superiority in military applications drives continued R&D investment
  • Export controls and ITAR regulations significantly impact market dynamics
By Performance Level
  • Tactical Grade
  • Navigation Grade
  • Strategic Grade
Navigation Grade

  • Most widely adopted performance level balancing precision and cost-effectiveness
  • Suitable for both commercial aerospace and military applications
  • Continuous improvements in MEMS technology challenging traditional higher-grade solutions
By Technology
  • Traditional Mechanical
  • MEMS-based
  • Fiber Optic
MEMS-based

  • Fastest-growing technology segment due to miniaturization advantages
  • Gaining acceptance in applications where size, weight and power constraints are critical
  • Performance improvements making inroads into traditional mechanical IMU applications

Regional Analysis: Electronic IMU Sensors Market

North America

North America dominates the Electronic IMU Sensors Market, driven by robust aerospace and defense sectors along with substantial investments in autonomous vehicle technologies. The region benefits from advanced manufacturing capabilities and strong presence of key IMU sensor manufacturers. Stringent industrial standards and early adoption of cutting-edge navigation technologies in military applications further strengthen market position. The United States leads regional growth with increasing demand for high-precision inertial measurement units in commercial aviation and unmanned systems. Ongoing research in MEMS-based solutions and government-funded defense projects create sustained demand. Canada shows promising growth with emerging applications in industrial automation and robotics.

Aerospace & Defense Leadership
North American aerospace manufacturers extensively use electronic IMU sensors for flight control systems and platform stabilization. The region’s stringent safety regulations drive adoption of high-reliability inertial measurement solutions in commercial and military aircraft.
Autonomous Vehicle Development
Major automotive OEMs and tech companies in the region are accelerating testing of autonomous vehicles, creating substantial demand for compact, high-performance IMU sensors for navigation and positioning systems in varying environmental conditions.
Industrial Robotics Expansion
Growing automation across manufacturing sectors fuels adoption of IMU sensors for robotic positioning and motion control systems. The region’s focus on smart factories and Industry 4.0 initiatives supports long-term market growth.
Research & Innovation Hub
North America hosts leading research institutions and technology firms developing next-generation IMU solutions, including quantum and fiber-optic gyroscopes, maintaining the region’s technological edge in precision motion sensing applications.

Europe
Europe holds significant position in the Electronic IMU Sensors Market with strong automotive and industrial automation sectors driving demand. The region benefits from well-established aerospace manufacturers and growing investments in satellite navigation technologies. Stringent EU regulations regarding vehicle safety and navigation standards boost adoption rates. Germany leads regional growth with advanced manufacturing capabilities, while France shows strength in defense applications. The increasing deployment of industrial robots across manufacturing facilities creates steady demand for precision motion sensors. European research initiatives focusing on miniaturized IMU solutions for IoT applications present new growth opportunities.

Asia-Pacific
Asia-Pacific emerges as the fastest growing region for Electronic IMU Sensors, fueled by expanding automotive production and defense modernization programs. China dominates the regional market with massive investments in autonomous vehicle technologies and space exploration. Japan maintains technological leadership in MEMS-based sensor manufacturing. India shows accelerating demand driven by defense sector upgrades and growing drone applications. The region benefits from cost-effective manufacturing capabilities and increasing R&D investments. Expanding industrial automation across electronics manufacturing sectors creates new opportunities for IMU sensor adoption.

Middle East & Africa
The Middle East demonstrates growing demand for Electronic IMU Sensors in defense and aerospace applications, supported by substantial military budgets. Gulf countries invest in advanced navigation systems for both military and commercial aircraft. Africa shows emerging potential with increasing adoption in mining and oil & gas exploration equipment. The region benefits from expanding infrastructure projects requiring surveying and positioning technologies. While the market remains relatively smaller compared to other regions, strategic partnerships with global sensor manufacturers are facilitating technology transfer and localized solutions.

South America
South America presents developing opportunities in the Electronic IMU Sensors Market, primarily driven by agricultural automation and defense modernization. Brazil leads regional adoption with applications in aerospace and automotive sectors. The mining industry creates demand for ruggedized IMU solutions for heavy equipment navigation. Challenges include limited local manufacturing capabilities and reliance on imports. However, growing government initiatives to develop domestic technology sectors and partnerships with international sensor providers are gradually improving market conditions across the region.

Report Scope

This market research report provides a comprehensive analysis of the Electronic IMU Sensors Market , covering the forecast period 2025–2033. It offers detailed insights into market dynamics, technological advancements, competitive landscape, and key trends shaping the industry.

Key focus areas of the report include:

  • Market Overview: The report begins with an overview outlining its current market scenario, key growth indicators, and industry transformation drivers. It discusses macroeconomic factors, demand–supply balance, regulatory landscape, and the strategic role of semiconductors in powering advancements across industries such as automotive, telecommunications, consumer electronics, and industrial automation.
  • Market Size & Forecast: Historical data and future projections for revenue, unit shipments, and market value across major regions and segments.
  • Segmentation Analysis: Detailed breakdown by product type, technology, application, and end-user industry to identify high-growth segments and investment opportunities.
  • Regional Insights: Insights into market performance across North America, Europe, Asia-Pacific, Latin America, and the Middle East & Africa, including country-level analysis where relevant.
  • Competitive Landscape: Profiles of leading market participants, including their product offerings, R&D focus, manufacturing capacity, pricing strategies, and recent developments such as mergers, acquisitions, and partnerships.
  • Technology Trends & Innovation: Assessment of emerging technologies, integration of AI/IoT, semiconductor design trends, fabrication techniques, and evolving industry standards.
  • Market Drivers & Restraints: Evaluation of factors driving market growth along with challenges, supply chain constraints, regulatory issues, and market-entry barriers.
  • Stakeholder Insights: Insights for component suppliers, OEMs, system integrators, investors, and policymakers regarding the evolving ecosystem and strategic opportunities.

Primary and secondary research methods are employed, including interviews with industry experts, data from verified sources, and real-time market intelligence to ensure the accuracy and reliability of the insights presented.

FREQUENTLY ASKED QUESTIONS:

What is the current market size of Electronic IMU Sensors Market?

-> Electronic IMU Sensors Market was valued at USD 2017 million in 2025 and is projected to reach USD 2772 million by 2033, exhibiting a CAGR of 4.8% during the forecast period.

Which key companies operate in Electronic IMU Sensors Market?

-> Key players include Honeywell International, Northrop Grumman Corp, SAFRAN, Thales, Kearfott, KVH Industries, UTC, Systron Donner Inertial, IAI Tamam, Elop, L-3 Communications, VectorNav, Tronics, SBG systems, AOSense, Analog Devices, MEGGITT, Sensonor, EPSON TOYOCOM, JAE, among others. Global top five players hold a share about 75%.

What are the key growth drivers?

-> Key growth drivers include increasing demand in aerospace and defense applications, advancements in MEMS technology, and rising industrial automation.

Which region dominates the market?

-> North America is the largest market with a share of about 40%, followed by Europe and China, having a combined share of 50%.

What are the emerging trends?

-> Emerging trends include development of high-performance MEMS IMUs, integration of AI in inertial navigation systems, and miniaturization of IMU sensors.

Electronic IMU Sensors Market, Global Business Strategies 2026-2033

Get Sample Report PDF for Exclusive Insights

Report Sample Includes

  • Table of Contents
  • List of Tables & Figures
  • Charts, Research Methodology, and more...
PDF Icon Download Sample Report PDF
SKU: 2ffbbbc75cc3
Category:
Tag:
License Type

Corporate License, Excel License, PDF and Excel Databook License

Download Sample Report

Table of Content

1 Introduction to Research & Analysis Reports
1.1 Electronic IMU Sensors Market Definition
1.2 Market Segments
1.2.1 Segment by Type
1.2.2 Segment by Application
1.3 Global Electronic IMU Sensors Market Overview
1.4 Features & Benefits of This Report
1.5 Methodology & Sources of Information
1.5.1 Research Methodology
1.5.2 Research Process
1.5.3 Base Year
1.5.4 Report Assumptions & Caveats
2 Global Electronic IMU Sensors Overall Market Size
2.1 Global Electronic IMU Sensors Market Size: 2024 VS 2032
2.2 Global Electronic IMU Sensors Market Size, Prospects & Forecasts: 2020-2032
2.3 Global Electronic IMU Sensors Sales: 2020-2032
3 Company Landscape
3.1 Top Electronic IMU Sensors Players in Global Market
3.2 Top Global Electronic IMU Sensors Companies Ranked by Revenue
3.3 Global Electronic IMU Sensors Revenue by Companies
3.4 Global Electronic IMU Sensors Sales by Companies
3.5 Global Electronic IMU Sensors Price by Manufacturer (2020-2025)
3.6 Top 3 and Top 5 Electronic IMU Sensors Companies in Global Market, by Revenue in 2024
3.7 Global Manufacturers Electronic IMU Sensors Product Type
3.8 Tier 1, Tier 2, and Tier 3 Electronic IMU Sensors Players in Global Market
3.8.1 List of Global Tier 1 Electronic IMU Sensors Companies
3.8.2 List of Global Tier 2 and Tier 3 Electronic IMU Sensors Companies
4 Sights by Product
4.1 Overview
4.1.1 Segment by Type – Global Electronic IMU Sensors Market Size Markets, 2024 & 2032
4.1.2 FOG
4.1.3 RLG
4.1.4 DTG and Others Mechanical
4.1.5 Si / Quartz MEMS
4.1.6 HRG and Emerging technology
4.2 Segment by Type – Global Electronic IMU Sensors Revenue & Forecasts
4.2.1 Segment by Type – Global Electronic IMU Sensors Revenue, 2020-2025
4.2.2 Segment by Type – Global Electronic IMU Sensors Revenue, 2026-2032
4.2.3 Segment by Type – Global Electronic IMU Sensors Revenue Market Share, 2020-2032
4.3 Segment by Type – Global Electronic IMU Sensors Sales & Forecasts
4.3.1 Segment by Type – Global Electronic IMU Sensors Sales, 2020-2025
4.3.2 Segment by Type – Global Electronic IMU Sensors Sales, 2026-2032
4.3.3 Segment by Type – Global Electronic IMU Sensors Sales Market Share, 2020-2032
4.4 Segment by Type – Global Electronic IMU Sensors Price (Manufacturers Selling Prices), 2020-2032
5 Sights by Application
5.1 Overview
5.1.1 Segment by Application – Global Electronic IMU Sensors Market Size, 2024 & 2032
5.1.2 Defense
5.1.3 Aerospace
5.1.4 Industrial, Naval, Offshore
5.2 Segment by Application – Global Electronic IMU Sensors Revenue & Forecasts
5.2.1 Segment by Application – Global Electronic IMU Sensors Revenue, 2020-2025
5.2.2 Segment by Application – Global Electronic IMU Sensors Revenue, 2026-2032
5.2.3 Segment by Application – Global Electronic IMU Sensors Revenue Market Share, 2020-2032
5.3 Segment by Application – Global Electronic IMU Sensors Sales & Forecasts
5.3.1 Segment by Application – Global Electronic IMU Sensors Sales, 2020-2025
5.3.2 Segment by Application – Global Electronic IMU Sensors Sales, 2026-2032
5.3.3 Segment by Application – Global Electronic IMU Sensors Sales Market Share, 2020-2032
5.4 Segment by Application – Global Electronic IMU Sensors Price (Manufacturers Selling Prices), 2020-2032
6 Sights by Region
6.1 By Region – Global Electronic IMU Sensors Market Size, 2024 & 2032
6.2 By Region – Global Electronic IMU Sensors Revenue & Forecasts
6.2.1 By Region – Global Electronic IMU Sensors Revenue, 2020-2025
6.2.2 By Region – Global Electronic IMU Sensors Revenue, 2026-2032
6.2.3 By Region – Global Electronic IMU Sensors Revenue Market Share, 2020-2032
6.3 By Region – Global Electronic IMU Sensors Sales & Forecasts
6.3.1 By Region – Global Electronic IMU Sensors Sales, 2020-2025
6.3.2 By Region – Global Electronic IMU Sensors Sales, 2026-2032
6.3.3 By Region – Global Electronic IMU Sensors Sales Market Share, 2020-2032
6.4 North America
6.4.1 By Country – North America Electronic IMU Sensors Revenue, 2020-2032
6.4.2 By Country – North America Electronic IMU Sensors Sales, 2020-2032
6.4.3 United States Electronic IMU Sensors Market Size, 2020-2032
6.4.4 Canada Electronic IMU Sensors Market Size, 2020-2032
6.4.5 Mexico Electronic IMU Sensors Market Size, 2020-2032
6.5 Europe
6.5.1 By Country – Europe Electronic IMU Sensors Revenue, 2020-2032
6.5.2 By Country – Europe Electronic IMU Sensors Sales, 2020-2032
6.5.3 Germany Electronic IMU Sensors Market Size, 2020-2032
6.5.4 France Electronic IMU Sensors Market Size, 2020-2032
6.5.5 U.K. Electronic IMU Sensors Market Size, 2020-2032
6.5.6 Italy Electronic IMU Sensors Market Size, 2020-2032
6.5.7 Russia Electronic IMU Sensors Market Size, 2020-2032
6.5.8 Nordic Countries Electronic IMU Sensors Market Size, 2020-2032
6.5.9 Benelux Electronic IMU Sensors Market Size, 2020-2032
6.6 Asia
6.6.1 By Region – Asia Electronic IMU Sensors Revenue, 2020-2032
6.6.2 By Region – Asia Electronic IMU Sensors Sales, 2020-2032
6.6.3 China Electronic IMU Sensors Market Size, 2020-2032
6.6.4 Japan Electronic IMU Sensors Market Size, 2020-2032
6.6.5 South Korea Electronic IMU Sensors Market Size, 2020-2032
6.6.6 Southeast Asia Electronic IMU Sensors Market Size, 2020-2032
6.6.7 India Electronic IMU Sensors Market Size, 2020-2032
6.7 South America
6.7.1 By Country – South America Electronic IMU Sensors Revenue, 2020-2032
6.7.2 By Country – South America Electronic IMU Sensors Sales, 2020-2032
6.7.3 Brazil Electronic IMU Sensors Market Size, 2020-2032
6.7.4 Argentina Electronic IMU Sensors Market Size, 2020-2032
6.8 Middle East & Africa
6.8.1 By Country – Middle East & Africa Electronic IMU Sensors Revenue, 2020-2032
6.8.2 By Country – Middle East & Africa Electronic IMU Sensors Sales, 2020-2032
6.8.3 Turkey Electronic IMU Sensors Market Size, 2020-2032
6.8.4 Israel Electronic IMU Sensors Market Size, 2020-2032
6.8.5 Saudi Arabia Electronic IMU Sensors Market Size, 2020-2032
6.8.6 UAE Electronic IMU Sensors Market Size, 2020-2032
7 Manufacturers & Brands Profiles
7.1 Honeywell International
7.1.1 Honeywell International Company Summary
7.1.2 Honeywell International Business Overview
7.1.3 Honeywell International Electronic IMU Sensors Major Product Offerings
7.1.4 Honeywell International Electronic IMU Sensors Sales and Revenue in Global (2020-2025)
7.1.5 Honeywell International Key News & Latest Developments
7.2 Northrop Grumman Corp
7.2.1 Northrop Grumman Corp Company Summary
7.2.2 Northrop Grumman Corp Business Overview
7.2.3 Northrop Grumman Corp Electronic IMU Sensors Major Product Offerings
7.2.4 Northrop Grumman Corp Electronic IMU Sensors Sales and Revenue in Global (2020-2025)
7.2.5 Northrop Grumman Corp Key News & Latest Developments
7.3 SAFRAN
7.3.1 SAFRAN Company Summary
7.3.2 SAFRAN Business Overview
7.3.3 SAFRAN Electronic IMU Sensors Major Product Offerings
7.3.4 SAFRAN Electronic IMU Sensors Sales and Revenue in Global (2020-2025)
7.3.5 SAFRAN Key News & Latest Developments
7.4 Thales
7.4.1 Thales Company Summary
7.4.2 Thales Business Overview
7.4.3 Thales Electronic IMU Sensors Major Product Offerings
7.4.4 Thales Electronic IMU Sensors Sales and Revenue in Global (2020-2025)
7.4.5 Thales Key News & Latest Developments
7.5 Kearfott
7.5.1 Kearfott Company Summary
7.5.2 Kearfott Business Overview
7.5.3 Kearfott Electronic IMU Sensors Major Product Offerings
7.5.4 Kearfott Electronic IMU Sensors Sales and Revenue in Global (2020-2025)
7.5.5 Kearfott Key News & Latest Developments
7.6 KVH Industries
7.6.1 KVH Industries Company Summary
7.6.2 KVH Industries Business Overview
7.6.3 KVH Industries Electronic IMU Sensors Major Product Offerings
7.6.4 KVH Industries Electronic IMU Sensors Sales and Revenue in Global (2020-2025)
7.6.5 KVH Industries Key News & Latest Developments
7.7 UTC
7.7.1 UTC Company Summary
7.7.2 UTC Business Overview
7.7.3 UTC Electronic IMU Sensors Major Product Offerings
7.7.4 UTC Electronic IMU Sensors Sales and Revenue in Global (2020-2025)
7.7.5 UTC Key News & Latest Developments
7.8 Systron Donner Inertial
7.8.1 Systron Donner Inertial Company Summary
7.8.2 Systron Donner Inertial Business Overview
7.8.3 Systron Donner Inertial Electronic IMU Sensors Major Product Offerings
7.8.4 Systron Donner Inertial Electronic IMU Sensors Sales and Revenue in Global (2020-2025)
7.8.5 Systron Donner Inertial Key News & Latest Developments
7.9 IAI Tamam
7.9.1 IAI Tamam Company Summary
7.9.2 IAI Tamam Business Overview
7.9.3 IAI Tamam Electronic IMU Sensors Major Product Offerings
7.9.4 IAI Tamam Electronic IMU Sensors Sales and Revenue in Global (2020-2025)
7.9.5 IAI Tamam Key News & Latest Developments
7.10 Elop
7.10.1 Elop Company Summary
7.10.2 Elop Business Overview
7.10.3 Elop Electronic IMU Sensors Major Product Offerings
7.10.4 Elop Electronic IMU Sensors Sales and Revenue in Global (2020-2025)
7.10.5 Elop Key News & Latest Developments
7.11 L-3 Communications
7.11.1 L-3 Communications Company Summary
7.11.2 L-3 Communications Business Overview
7.11.3 L-3 Communications Electronic IMU Sensors Major Product Offerings
7.11.4 L-3 Communications Electronic IMU Sensors Sales and Revenue in Global (2020-2025)
7.11.5 L-3 Communications Key News & Latest Developments
7.12 VectorNav
7.12.1 VectorNav Company Summary
7.12.2 VectorNav Business Overview
7.12.3 VectorNav Electronic IMU Sensors Major Product Offerings
7.12.4 VectorNav Electronic IMU Sensors Sales and Revenue in Global (2020-2025)
7.12.5 VectorNav Key News & Latest Developments
7.13 Tronics
7.13.1 Tronics Company Summary
7.13.2 Tronics Business Overview
7.13.3 Tronics Electronic IMU Sensors Major Product Offerings
7.13.4 Tronics Electronic IMU Sensors Sales and Revenue in Global (2020-2025)
7.13.5 Tronics Key News & Latest Developments
7.14 SBG systems
7.14.1 SBG systems Company Summary
7.14.2 SBG systems Business Overview
7.14.3 SBG systems Electronic IMU Sensors Major Product Offerings
7.14.4 SBG systems Electronic IMU Sensors Sales and Revenue in Global (2020-2025)
7.14.5 SBG systems Key News & Latest Developments
7.15 AOSense
7.15.1 AOSense Company Summary
7.15.2 AOSense Business Overview
7.15.3 AOSense Electronic IMU Sensors Major Product Offerings
7.15.4 AOSense Electronic IMU Sensors Sales and Revenue in Global (2020-2025)
7.15.5 AOSense Key News & Latest Developments
7.16 Analog Devices
7.16.1 Analog Devices Company Summary
7.16.2 Analog Devices Business Overview
7.16.3 Analog Devices Electronic IMU Sensors Major Product Offerings
7.16.4 Analog Devices Electronic IMU Sensors Sales and Revenue in Global (2020-2025)
7.16.5 Analog Devices Key News & Latest Developments
7.17 MEGGITT
7.17.1 MEGGITT Company Summary
7.17.2 MEGGITT Business Overview
7.17.3 MEGGITT Electronic IMU Sensors Major Product Offerings
7.17.4 MEGGITT Electronic IMU Sensors Sales and Revenue in Global (2020-2025)
7.17.5 MEGGITT Key News & Latest Developments
7.18 Sensonor
7.18.1 Sensonor Company Summary
7.18.2 Sensonor Business Overview
7.18.3 Sensonor Electronic IMU Sensors Major Product Offerings
7.18.4 Sensonor Electronic IMU Sensors Sales and Revenue in Global (2020-2025)
7.18.5 Sensonor Key News & Latest Developments
7.19 EPSON TOYOCOM
7.19.1 EPSON TOYOCOM Company Summary
7.19.2 EPSON TOYOCOM Business Overview
7.19.3 EPSON TOYOCOM Electronic IMU Sensors Major Product Offerings
7.19.4 EPSON TOYOCOM Electronic IMU Sensors Sales and Revenue in Global (2020-2025)
7.19.5 EPSON TOYOCOM Key News & Latest Developments
7.20 JAE
7.20.1 JAE Company Summary
7.20.2 JAE Business Overview
7.20.3 JAE Electronic IMU Sensors Major Product Offerings
7.20.4 JAE Electronic IMU Sensors Sales and Revenue in Global (2020-2025)
7.20.5 JAE Key News & Latest Developments
8 Global Electronic IMU Sensors Production Capacity, Analysis
8.1 Global Electronic IMU Sensors Production Capacity, 2020-2032
8.2 Electronic IMU Sensors Production Capacity of Key Manufacturers in Global Market
8.3 Global Electronic IMU Sensors Production by Region
9 Key Market Trends, Opportunity, Drivers and Restraints
9.1 Market Opportunities & Trends
9.2 Market Drivers
9.3 Market Restraints
10 Electronic IMU Sensors Supply Chain Analysis
10.1 Electronic IMU Sensors Industry Value Chain
10.2 Electronic IMU Sensors Upstream Market
10.3 Electronic IMU Sensors Downstream and Clients
10.4 Marketing Channels Analysis
10.4.1 Marketing Channels
10.4.2 Electronic IMU Sensors Distributors and Sales Agents in Global
11 Conclusion
12 Appendix
12.1 Note
12.2 Examples of Clients
12.3 DisclaimerList of Tables
Table 1. Key Players of Electronic IMU Sensors in Global Market
Table 2. Top Electronic IMU Sensors Players in Global Market, Ranking by Revenue (2024)
Table 3. Global Electronic IMU Sensors Revenue by Companies, (US$, Mn), 2020-2025
Table 4. Global Electronic IMU Sensors Revenue Share by Companies, 2020-2025
Table 5. Global Electronic IMU Sensors Sales by Companies, (K Units), 2020-2025
Table 6. Global Electronic IMU Sensors Sales Share by Companies, 2020-2025
Table 7. Key Manufacturers Electronic IMU Sensors Price (2020-2025) & (USD/Unit)
Table 8. Global Manufacturers Electronic IMU Sensors Product Type
Table 9. List of Global Tier 1 Electronic IMU Sensors Companies, Revenue (US$, Mn) in 2024 and Market Share
Table 10. List of Global Tier 2 and Tier 3 Electronic IMU Sensors Companies, Revenue (US$, Mn) in 2024 and Market Share
Table 11. Segment by Type – Global Electronic IMU Sensors Revenue, (US$, Mn), 2024 & 2032
Table 12. Segment by Type – Global Electronic IMU Sensors Revenue (US$, Mn), 2020-2025
Table 13. Segment by Type – Global Electronic IMU Sensors Revenue (US$, Mn), 2026-2032
Table 14. Segment by Type – Global Electronic IMU Sensors Sales (K Units), 2020-2025
Table 15. Segment by Type – Global Electronic IMU Sensors Sales (K Units), 2026-2032
Table 16. Segment by Application – Global Electronic IMU Sensors Revenue, (US$, Mn), 2024 & 2032
Table 17. Segment by Application – Global Electronic IMU Sensors Revenue, (US$, Mn), 2020-2025
Table 18. Segment by Application – Global Electronic IMU Sensors Revenue, (US$, Mn), 2026-2032
Table 19. Segment by Application – Global Electronic IMU Sensors Sales, (K Units), 2020-2025
Table 20. Segment by Application – Global Electronic IMU Sensors Sales, (K Units), 2026-2032
Table 21. By Region – Global Electronic IMU Sensors Revenue, (US$, Mn), 2025-2032
Table 22. By Region – Global Electronic IMU Sensors Revenue, (US$, Mn), 2020-2025
Table 23. By Region – Global Electronic IMU Sensors Revenue, (US$, Mn), 2026-2032
Table 24. By Region – Global Electronic IMU Sensors Sales, (K Units), 2020-2025
Table 25. By Region – Global Electronic IMU Sensors Sales, (K Units), 2026-2032
Table 26. By Country – North America Electronic IMU Sensors Revenue, (US$, Mn), 2020-2025
Table 27. By Country – North America Electronic IMU Sensors Revenue, (US$, Mn), 2026-2032
Table 28. By Country – North America Electronic IMU Sensors Sales, (K Units), 2020-2025
Table 29. By Country – North America Electronic IMU Sensors Sales, (K Units), 2026-2032
Table 30. By Country – Europe Electronic IMU Sensors Revenue, (US$, Mn), 2020-2025
Table 31. By Country – Europe Electronic IMU Sensors Revenue, (US$, Mn), 2026-2032
Table 32. By Country – Europe Electronic IMU Sensors Sales, (K Units), 2020-2025
Table 33. By Country – Europe Electronic IMU Sensors Sales, (K Units), 2026-2032
Table 34. By Region – Asia Electronic IMU Sensors Revenue, (US$, Mn), 2020-2025
Table 35. By Region – Asia Electronic IMU Sensors Revenue, (US$, Mn), 2026-2032
Table 36. By Region – Asia Electronic IMU Sensors Sales, (K Units), 2020-2025
Table 37. By Region – Asia Electronic IMU Sensors Sales, (K Units), 2026-2032
Table 38. By Country – South America Electronic IMU Sensors Revenue, (US$, Mn), 2020-2025
Table 39. By Country – South America Electronic IMU Sensors Revenue, (US$, Mn), 2026-2032
Table 40. By Country – South America Electronic IMU Sensors Sales, (K Units), 2020-2025
Table 41. By Country – South America Electronic IMU Sensors Sales, (K Units), 2026-2032
Table 42. By Country – Middle East & Africa Electronic IMU Sensors Revenue, (US$, Mn), 2020-2025
Table 43. By Country – Middle East & Africa Electronic IMU Sensors Revenue, (US$, Mn), 2026-2032
Table 44. By Country – Middle East & Africa Electronic IMU Sensors Sales, (K Units), 2020-2025
Table 45. By Country – Middle East & Africa Electronic IMU Sensors Sales, (K Units), 2026-2032
Table 46. Honeywell International Company Summary
Table 47. Honeywell International Electronic IMU Sensors Product Offerings
Table 48. Honeywell International Electronic IMU Sensors Sales (K Units), Revenue (US$, Mn) and Average Price (USD/Unit) & (2020-2025)
Table 49. Honeywell International Key News & Latest Developments
Table 50. Northrop Grumman Corp Company Summary
Table 51. Northrop Grumman Corp Electronic IMU Sensors Product Offerings
Table 52. Northrop Grumman Corp Electronic IMU Sensors Sales (K Units), Revenue (US$, Mn) and Average Price (USD/Unit) & (2020-2025)
Table 53. Northrop Grumman Corp Key News & Latest Developments
Table 54. SAFRAN Company Summary
Table 55. SAFRAN Electronic IMU Sensors Product Offerings
Table 56. SAFRAN Electronic IMU Sensors Sales (K Units), Revenue (US$, Mn) and Average Price (USD/Unit) & (2020-2025)
Table 57. SAFRAN Key News & Latest Developments
Table 58. Thales Company Summary
Table 59. Thales Electronic IMU Sensors Product Offerings
Table 60. Thales Electronic IMU Sensors Sales (K Units), Revenue (US$, Mn) and Average Price (USD/Unit) & (2020-2025)
Table 61. Thales Key News & Latest Developments
Table 62. Kearfott Company Summary
Table 63. Kearfott Electronic IMU Sensors Product Offerings
Table 64. Kearfott Electronic IMU Sensors Sales (K Units), Revenue (US$, Mn) and Average Price (USD/Unit) & (2020-2025)
Table 65. Kearfott Key News & Latest Developments
Table 66. KVH Industries Company Summary
Table 67. KVH Industries Electronic IMU Sensors Product Offerings
Table 68. KVH Industries Electronic IMU Sensors Sales (K Units), Revenue (US$, Mn) and Average Price (USD/Unit) & (2020-2025)
Table 69. KVH Industries Key News & Latest Developments
Table 70. UTC Company Summary
Table 71. UTC Electronic IMU Sensors Product Offerings
Table 72. UTC Electronic IMU Sensors Sales (K Units), Revenue (US$, Mn) and Average Price (USD/Unit) & (2020-2025)
Table 73. UTC Key News & Latest Developments
Table 74. Systron Donner Inertial Company Summary
Table 75. Systron Donner Inertial Electronic IMU Sensors Product Offerings
Table 76. Systron Donner Inertial Electronic IMU Sensors Sales (K Units), Revenue (US$, Mn) and Average Price (USD/Unit) & (2020-2025)
Table 77. Systron Donner Inertial Key News & Latest Developments
Table 78. IAI Tamam Company Summary
Table 79. IAI Tamam Electronic IMU Sensors Product Offerings
Table 80. IAI Tamam Electronic IMU Sensors Sales (K Units), Revenue (US$, Mn) and Average Price (USD/Unit) & (2020-2025)
Table 81. IAI Tamam Key News & Latest Developments
Table 82. Elop Company Summary
Table 83. Elop Electronic IMU Sensors Product Offerings
Table 84. Elop Electronic IMU Sensors Sales (K Units), Revenue (US$, Mn) and Average Price (USD/Unit) & (2020-2025)
Table 85. Elop Key News & Latest Developments
Table 86. L-3 Communications Company Summary
Table 87. L-3 Communications Electronic IMU Sensors Product Offerings
Table 88. L-3 Communications Electronic IMU Sensors Sales (K Units), Revenue (US$, Mn) and Average Price (USD/Unit) & (2020-2025)
Table 89. L-3 Communications Key News & Latest Developments
Table 90. VectorNav Company Summary
Table 91. VectorNav Electronic IMU Sensors Product Offerings
Table 92. VectorNav Electronic IMU Sensors Sales (K Units), Revenue (US$, Mn) and Average Price (USD/Unit) & (2020-2025)
Table 93. VectorNav Key News & Latest Developments
Table 94. Tronics Company Summary
Table 95. Tronics Electronic IMU Sensors Product Offerings
Table 96. Tronics Electronic IMU Sensors Sales (K Units), Revenue (US$, Mn) and Average Price (USD/Unit) & (2020-2025)
Table 97. Tronics Key News & Latest Developments
Table 98. SBG systems Company Summary
Table 99. SBG systems Electronic IMU Sensors Product Offerings
Table 100. SBG systems Electronic IMU Sensors Sales (K Units), Revenue (US$, Mn) and Average Price (USD/Unit) & (2020-2025)
Table 101. SBG systems Key News & Latest Developments
Table 102. AOSense Company Summary
Table 103. AOSense Electronic IMU Sensors Product Offerings
Table 104. AOSense Electronic IMU Sensors Sales (K Units), Revenue (US$, Mn) and Average Price (USD/Unit) & (2020-2025)
Table 105. AOSense Key News & Latest Developments
Table 106. Analog Devices Company Summary
Table 107. Analog Devices Electronic IMU Sensors Product Offerings
Table 108. Analog Devices Electronic IMU Sensors Sales (K Units), Revenue (US$, Mn) and Average Price (USD/Unit) & (2020-2025)
Table 109. Analog Devices Key News & Latest Developments
Table 110. MEGGITT Company Summary
Table 111. MEGGITT Electronic IMU Sensors Product Offerings
Table 112. MEGGITT Electronic IMU Sensors Sales (K Units), Revenue (US$, Mn) and Average Price (USD/Unit) & (2020-2025)
Table 113. MEGGITT Key News & Latest Developments
Table 114. Sensonor Company Summary
Table 115. Sensonor Electronic IMU Sensors Product Offerings
Table 116. Sensonor Electronic IMU Sensors Sales (K Units), Revenue (US$, Mn) and Average Price (USD/Unit) & (2020-2025)
Table 117. Sensonor Key News & Latest Developments
Table 118. EPSON TOYOCOM Company Summary
Table 119. EPSON TOYOCOM Electronic IMU Sensors Product Offerings
Table 120. EPSON TOYOCOM Electronic IMU Sensors Sales (K Units), Revenue (US$, Mn) and Average Price (USD/Unit) & (2020-2025)
Table 121. EPSON TOYOCOM Key News & Latest Developments
Table 122. JAE Company Summary
Table 123. JAE Electronic IMU Sensors Product Offerings
Table 124. JAE Electronic IMU Sensors Sales (K Units), Revenue (US$, Mn) and Average Price (USD/Unit) & (2020-2025)
Table 125. JAE Key News & Latest Developments
Table 126. Electronic IMU Sensors Capacity of Key Manufacturers in Global Market, 2023-2025 (K Units)
Table 127. Global Electronic IMU Sensors Capacity Market Share of Key Manufacturers, 2023-2025
Table 128. Global Electronic IMU Sensors Production by Region, 2020-2025 (K Units)
Table 129. Global Electronic IMU Sensors Production by Region, 2026-2032 (K Units)
Table 130. Electronic IMU Sensors Market Opportunities & Trends in Global Market
Table 131. Electronic IMU Sensors Market Drivers in Global Market
Table 132. Electronic IMU Sensors Market Restraints in Global Market
Table 133. Electronic IMU Sensors Raw Materials
Table 134. Electronic IMU Sensors Raw Materials Suppliers in Global Market
Table 135. Typical Electronic IMU Sensors Downstream
Table 136. Electronic IMU Sensors Downstream Clients in Global Market
Table 137. Electronic IMU Sensors Distributors and Sales Agents in Global Market

List of Figures
Figure 1. Electronic IMU Sensors Product Picture
Figure 2. Electronic IMU Sensors Segment by Type in 2024
Figure 3. Electronic IMU Sensors Segment by Application in 2024
Figure 4. Global Electronic IMU Sensors Market Overview: 2024
Figure 5. Key Caveats
Figure 6. Global Electronic IMU Sensors Market Size: 2024 VS 2032 (US$, Mn)
Figure 7. Global Electronic IMU Sensors Revenue: 2020-2032 (US$, Mn)
Figure 8. Electronic IMU Sensors Sales in Global Market: 2020-2032 (K Units)
Figure 9. The Top 3 and 5 Players Market Share by Electronic IMU Sensors Revenue in 2024
Figure 10. Segment by Type – Global Electronic IMU Sensors Revenue, (US$, Mn), 2024 & 2032
Figure 11. Segment by Type – Global Electronic IMU Sensors Revenue Market Share, 2020-2032
Figure 12. Segment by Type – Global Electronic IMU Sensors Sales Market Share, 2020-2032
Figure 13. Segment by Type – Global Electronic IMU Sensors Price (USD/Unit), 2020-2032
Figure 14. Segment by Application – Global Electronic IMU Sensors Revenue, (US$, Mn), 2024 & 2032
Figure 15. Segment by Application – Global Electronic IMU Sensors Revenue Market Share, 2020-2032
Figure 16. Segment by Application – Global Electronic IMU Sensors Sales Market Share, 2020-2032
Figure 17. Segment by Application -Global Electronic IMU Sensors Price (USD/Unit), 2020-2032
Figure 18. By Region – Global Electronic IMU Sensors Revenue, (US$, Mn), 2025 & 2032
Figure 19. By Region – Global Electronic IMU Sensors Revenue Market Share, 2020 VS 2024 VS 2032
Figure 20. By Region – Global Electronic IMU Sensors Revenue Market Share, 2020-2032
Figure 21. By Region – Global Electronic IMU Sensors Sales Market Share, 2020-2032
Figure 22. By Country – North America Electronic IMU Sensors Revenue Market Share, 2020-2032
Figure 23. By Country – North America Electronic IMU Sensors Sales Market Share, 2020-2032
Figure 24. United States Electronic IMU Sensors Revenue, (US$, Mn), 2020-2032
Figure 25. Canada Electronic IMU Sensors Revenue, (US$, Mn), 2020-2032
Figure 26. Mexico Electronic IMU Sensors Revenue, (US$, Mn), 2020-2032
Figure 27. By Country – Europe Electronic IMU Sensors Revenue Market Share, 2020-2032
Figure 28. By Country – Europe Electronic IMU Sensors Sales Market Share, 2020-2032
Figure 29. Germany Electronic IMU Sensors Revenue, (US$, Mn), 2020-2032
Figure 30. France Electronic IMU Sensors Revenue, (US$, Mn), 2020-2032
Figure 31. U.K. Electronic IMU Sensors Revenue, (US$, Mn), 2020-2032
Figure 32. Italy Electronic IMU Sensors Revenue, (US$, Mn), 2020-2032
Figure 33. Russia Electronic IMU Sensors Revenue, (US$, Mn), 2020-2032
Figure 34. Nordic Countries Electronic IMU Sensors Revenue, (US$, Mn), 2020-2032
Figure 35. Benelux Electronic IMU Sensors Revenue, (US$, Mn), 2020-2032
Figure 36. By Region – Asia Electronic IMU Sensors Revenue Market Share, 2020-2032
Figure 37. By Region – Asia Electronic IMU Sensors Sales Market Share, 2020-2032
Figure 38. China Electronic IMU Sensors Revenue, (US$, Mn), 2020-2032
Figure 39. Japan Electronic IMU Sensors Revenue, (US$, Mn), 2020-2032
Figure 40. South Korea Electronic IMU Sensors Revenue, (US$, Mn), 2020-2032
Figure 41. Southeast Asia Electronic IMU Sensors Revenue, (US$, Mn), 2020-2032
Figure 42. India Electronic IMU Sensors Revenue, (US$, Mn), 2020-2032
Figure 43. By Country – South America Electronic IMU Sensors Revenue Market Share, 2020-2032
Figure 44. By Country – South America Electronic IMU Sensors Sales, Market Share, 2020-2032
Figure 45. Brazil Electronic IMU Sensors Revenue, (US$, Mn), 2020-2032
Figure 46. Argentina Electronic IMU Sensors Revenue, (US$, Mn), 2020-2032
Figure 47. By Country – Middle East & Africa Electronic IMU Sensors Revenue, Market Share, 2020-2032
Figure 48. By Country – Middle East & Africa Electronic IMU Sensors Sales, Market Share, 2020-2032
Figure 49. Turkey Electronic IMU Sensors Revenue, (US$, Mn), 2020-2032
Figure 50. Israel Electronic IMU Sensors Revenue, (US$, Mn), 2020-2032
Figure 51. Saudi Arabia Electronic IMU Sensors Revenue, (US$, Mn), 2020-2032
Figure 52. UAE Electronic IMU Sensors Revenue, (US$, Mn), 2020-2032
Figure 53. Global Electronic IMU Sensors Production Capacity (K Units), 2020-2032
Figure 54. The Percentage of Production Electronic IMU Sensors by Region, 2024 VS 2032
Figure 55. Electronic IMU Sensors Industry Value Chain
Figure 56. Marketing Channels