Electronic Components Market, Global Business Strategies 2025-2032

Electronic Components Market size was valued at USD 461.79 billion in 2024 to USD 634.48 billion by 2032, exhibiting a CAGR of 4.7% during the forecast period

PDF Icon Download Sample Report PDF
  • Quick Dispatch

    All Orders

  • Secure Payment

    100% Secure Payment

Price range: $1,500.00 through $4,250.00

Clear

MARKET INSIGHTS

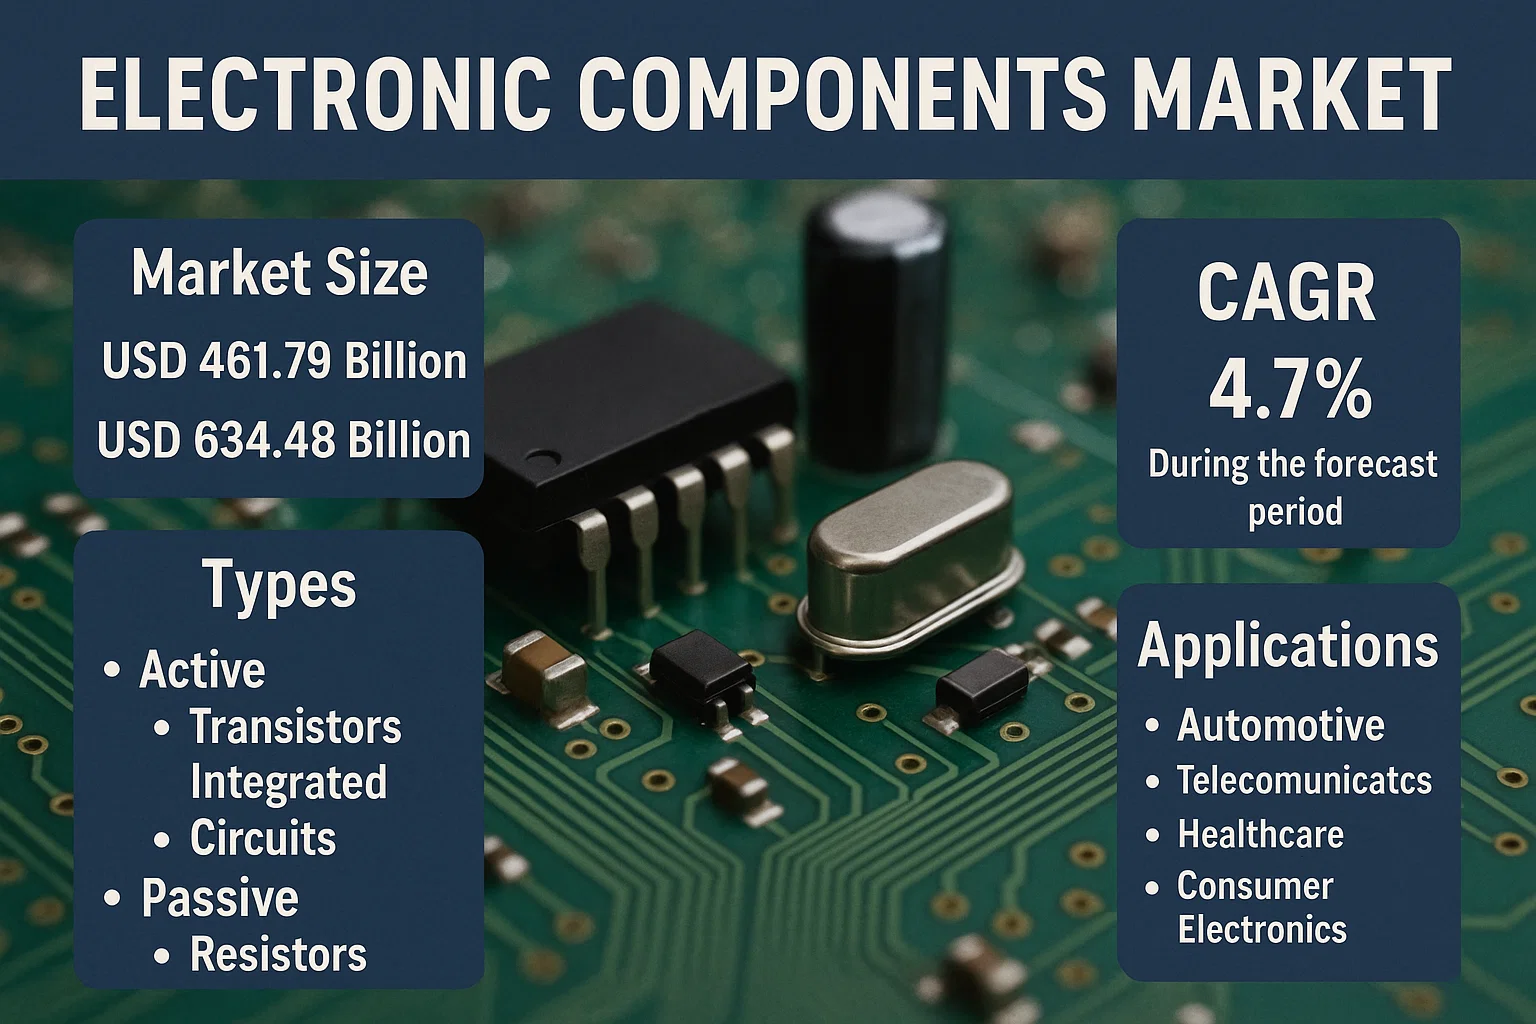
Global Electronic Components Market size was valued at USD 461.79 billion in 2024 to USD 634.48 billion by 2032, exhibiting a CAGR of 4.7% during the forecast period.

Electronic components are fundamental building blocks of electronic circuits, enabling functionalities such as signal processing, amplification, and energy conversion. These components are categorized into active (e.g., transistors, integrated circuits) and passive (e.g., resistors, capacitors) types, with applications spanning industries like automotive, telecommunications, healthcare, and consumer electronics. The increasing demand for miniaturization, energy efficiency, and high-performance devices continues to drive innovation in this sector.

The market is expanding due to the proliferation of IoT devices, 5G adoption, and advancements in automotive electronics. For instance, the growing deployment of electric vehicles (EVs) has significantly boosted demand for power semiconductors and sensors. Additionally, the shift toward Industry 4.0 and smart manufacturing is accelerating the adoption of advanced electronic components. Key players such as Texas Instruments, Murata, and Infineon Technologies are investing in R&D and strategic partnerships to strengthen their market position and cater to emerging technological demands.

Electronic Components Market

MARKET DRIVERS


Rapid Digital Transformation Across Industries

The global push towards Industry 4.0 has accelerated the adoption of electronic components across manufacturing, healthcare, and automotive sectors. Companies are investing heavily in IoT-enabled devices, which require sophisticated semiconductor components to function effectively.

Growth in Electric Vehicle Production

With governments worldwide setting ambitious targets for electric vehicle adoption, the demand for power electronics, sensors, and control modules has surged. Major manufacturers are scaling production, requiring reliable supplies of advanced electronic components.

Automotive industry’s shift towards autonomous driving systems has created unprecedented demand for high-performance processors and sensor arrays

Next-generation vehicles require advanced driver-assistance systems (ADAS), which utilize complex electronic components for real-time data processing and decision-making.

MARKET CHALLENGES


Global Semiconductor Shortage

The ongoing semiconductor shortage continues to disrupt supply chains across multiple industries. Automotive manufacturers have reported production halts due to insufficient chip supplies, while consumer electronics companies face extended lead times exceeding 52 weeks for certain components.

Other Challenges

Supply Chain Disruptions
Logistical challenges and geopolitical tensions have created bottlenecks in the raw material supply chain. Critical raw materials such as rare earth elements face volatile pricing and availability, impacting component manufacturing costs.

MARKET RESTRAINTS


High Research and Development Costs

Developing next-generation electronic components requires substantial investment in research and development. Advanced semiconductor nodes below 7nm require capital expenditures exceeding $20 billion per facility, creating significant barriers to entry for new market participants.

MARKET OPPORTUNITIES


5G Infrastructure Expansion

The global rollout of 5G networks requires massive deployment of new infrastructure components. Base stations, small cells, and network equipment all require advanced electronic components that can handle higher frequencies and data throughput. This creates sustained demand for RF components, power management ICs, and advanced processors.

Artificial Intelligence and Edge Computing

Edge computing deployments are creating new markets for specialized processors and memory components. AI applications require specialized hardware accelerators, creating opportunities for manufacturers of high-performance computing components and custom ASICs.

Space and Defense Applications

Increased government spending on defense and space exploration has created demand for radiation-hardened components, high-temperature electronics, and advanced communication modules. These applications typically command higher profit margins than commercial components.

Electronic Components Market Trends
Miniaturization and Integration Driving Market Evolution

The global electronic components market is experiencing significant transformation driven by the relentless pursuit of miniaturization and higher integration densities. Semiconductor manufacturers are pushing the boundaries of Moore’s Law with advanced packaging technologies like chiplets and 3D stacking, allowing for more functionality in smaller form factors. This trend is particularly crucial for mobile devices, IoT devices, and advanced computing systems where space constraints are paramount. The shift towards System-in-Package (SiP) designs is enabling more complex functionality in compact packages, while advanced substrates and interconnects are improving thermal management and signal integrity at reduced scales.

Advanced packaging technologies such as fan-out wafer-level packaging (FOWLP) and integrated passive devices (IPDs) are becoming standard in high-performance applications. Manufacturers are increasingly adopting heterogeneous integration techniques to combine different chip technologies within single packages. The demand for smaller, more powerful components is driving R&D investments in materials science and manufacturing processes. Leading companies are developing ultra-thin substrates, high-density interconnects, and advanced thermal management solutions to support these trends. The market is also seeing increased adoption of system-level packaging where multiple functions are integrated into single modules, reducing overall system size and improving performance.

Other Trends

Supply Chain Diversification and Regionalization

The electronic components market is experiencing significant supply chain restructuring following recent global disruptions. Companies are diversifying their supplier base across different geographic regions, with particular focus on reducing dependency on single-source suppliers. Many manufacturers are implementing dual-sourcing strategies and increasing their inventory buffers for critical components. The trend towards regional manufacturing clusters is accelerating, with companies establishing production facilities closer to end markets to reduce logistics risks. Countries are implementing policies to strengthen domestic semiconductor and electronics production capabilities, with significant investments in new fabrication plants and testing facilities. Supply chain transparency and traceability have become priority concerns, driving adoption of blockchain and other tracking technologies across the component supply chain.

Rising Demand from Electric Vehicles and Renewable Energy

The rapid growth of electric vehicles (EVs) and renewable energy infrastructure is creating unprecedented demand for advanced electronic components. EV manufacturers require high-performance power semiconductors, advanced battery management systems, and sophisticated sensor networks, all demanding specialized components rated for automotive applications. The shift to electric powertrains is driving demand for high-voltage capacitors, advanced power MOSFETs, and gate driver ICs capable of operating in harsh automotive environments. Solar and wind energy installations require robust power conversion components, grid interface electronics, and advanced monitoring systems, all requiring specialized electronic components designed for high reliability and long service life.

Grid-scale energy storage systems are driving demand for advanced battery management ICs, power converters, and grid interface electronics. The expansion of charging infrastructure for electric vehicles requires specialized power electronics, communication modules, and payment processing components. Wind turbine installations require robust condition monitoring systems, power converters, and pitch control systems, all demanding high-reliability electronic components. The integration of renewable energy sources requires sophisticated grid management electronics, smart inverters, and distributed control systems that continue to drive component innovation.

COMPETITIVE LANDSCAPE

Key Industry Players

Leading Electronic Components Manufacturers

The electronic components market is dominated by large multinational corporations with extensive product portfolios and global reach. Texas Instruments leads in analog semiconductors, while Murata Manufacturing dominates in passive components and advanced materials. Japanese and South Korean manufacturers maintain strong positions in high-frequency and high-precision components.

Chinese manufacturers have rapidly expanded their market share in recent years, particularly in the consumer electronics and industrial sectors. Companies like Huawei, ZTE, and several emerging manufacturers are now competing effectively in specific component categories such as connectors, sensors, and power devices. The market remains fragmented with specialized players dominating niche segments.

List of Key Electronic Components Companies

  • Texas Instruments Inc.
  • Murata Manufacturing Co., Ltd.
  • ABB Ltd.
  • STMicroelectronics N.V.
  • NXP Semiconductors N.V.
  • Kyocera Corporation
  • Omron Corporation
  • Amphenol Corporation
  • Infineon Technologies AG
  • Samsung Electro-Mechanics Co., Ltd.
  • TDK Corporation
  • Analog Devices, Inc.
  • Molex, LLC
  • Vishay Intertechnology, Inc.
  • ON Semiconductor Corporation
  • Microchip Technology Inc.
  • Panasonic Corporation
  • TE Connectivity Ltd.

Segment Analysis:

Segment Category Sub-Segments Key Insights
By Type
  • Semiconductors
  • Passive Components
  • Electromechanical
  • Optoelectronics
Semiconductors dominate due to their critical role in all modern electronics, from smartphones to industrial automation, while Optoelectronics show strong growth driven by demand for displays and sensors across industries.
By Application
  • Consumer Electronics
  • Automotive
  • Industrial Automation
  • Healthcare
  • Telecommunications
  • Others
Consumer Electronics represents the largest segment due to massive global demand for smartphones and smart devices, while Automotive is the fastest growing segment with increasing electronic content per vehicle for ADAS and connectivity.
By End User
  • OEMs (Original Equipment Manufacturers)
  • Contract Manufacturers
  • Distributors and Resellers
  • System Integrators
OEMs (Original Equipment Manufacturers) lead in consumption as they integrate components into final products, while Distributors and Resellers show strong growth due to the increasing complexity of supply chains and need for specialized component distribution.
By Region
  • Asia Pacific
  • North America
  • Europe
  • Rest of World
Asia Pacific dominates production and consumption with China as the manufacturing hub and India showing rapid growth in both production and adoption of electronic components across industries.
By Technology
  • Silicon-based
  • Compound Semiconductors
  • Emerging Materials
  • Traditional
Silicon-based technologies remain dominant due to maturity and cost-effectiveness, while Compound Semiconductors show exceptional growth for specialized applications requiring higher performance in harsh environments.

Regional Analysis: Electronic Components Market

Asia-Pacific

Asia-Pacific dominates the electronic components market with its massive manufacturing ecosystem centered in China, South Korea, Taiwan, and Japan. The region benefits from complete supply chain integration from raw materials to finished products, supported by massive government investments in semiconductor fabrication plants and electronics manufacturing. The region’s dominance stems from decades of strategic development in electronics manufacturing, strong technical education systems producing skilled engineers, and massive consumer electronics demand from its own population. The region excels in high-volume production of semiconductors, printed circuit boards, and display components while continuously advancing in next-generation chip manufacturing and IoT component development.

Manufacturing Ecosystem
Asia-Pacific’s manufacturing ecosystem for electronic components is the most globally integrated, with China alone producing over half of all electronic components worldwide. The region’s dominance stems from complete supply chain integration, from raw material processing to final product assembly, supported by massive government investments in semiconductor fabrication plants and decades of accumulated manufacturing expertise. The ecosystem benefits from continuous technology transfer between leading countries in the region.
Supply Chain Integration
Asia-Pacific’s electronic components supply chain demonstrates unprecedented integration, with neighboring countries specializing in complementary production stages. China focuses on mass production of standard components, Taiwan excels in semiconductor manufacturing and advanced chip design, South Korea leads in memory chips and display technologies, while Japan maintains leadership in high-precision components and specialized materials. This integration creates a production network unmatched in other regions, allowing Asia-Pacific to maintain competitive advantage in both cost and technological advancement simultaneously.
Innovation and R&D
While Asia-Pacific leads in manufacturing, the region has increasingly become the global center for electronics research and development. South Korea and Japan maintain the highest R&D investment-to-GDP ratios globally, with China now producing more electronics patents than any other country. Taiwan’s semiconductor R&D capabilities rival global leaders, particularly in chip design and process optimization. The region hosts numerous corporate and government research institutes specifically focused on next-generation electronic components.
Market Demand
Asia-Pacific itself represents the largest and fastest-growing market for electronic components, fueled by rising incomes, digitalization initiatives, and massive technology adoption. China’s domestic demand alone exceeds North America and Europe combined for many component categories. The region’s demand drives innovation toward consumer electronics applications and supports scale that enables cost-competitive production. This internal demand creates a self-sustaining cycle where manufacturing scale drives down costs, enabling wider adoption, which in turn drives further production scale-up and innovation.

North America
North America maintains strength in semiconductor design, aerospace and defense components, and specialized high-performance computing applications. The region benefits from strong university research, venture capital funding for hardware startups, and close collaboration between defense agencies and component manufacturers. While losing volume production to Asia, North America maintains leadership in design, architecture, and high-value-added specialized components through continuous innovation in areas like AI chips, quantum computing components, and next-generation semiconductor materials.

Europe
Europe maintains competitiveness in industrial and automotive electronics, with Germany’s automotive sector driving demand for high-reliability components. The region excels in precision manufacturing equipment for electronics production, semiconductor manufacturing equipment, and specialty materials. Europe maintains strong positions in photonics, sensor technologies, and industrial IoT components while leveraging integration with North America on defense and aerospace applications. The region’s focus on quality and reliability over pure cost-competitiveness creates differentiated positioning.

Latin America
Latin America’s electronic components market primarily serves domestic demand with limited export orientation. Brazil and Mexico developed significant manufacturing capabilities, particularly in automotive electronics and consumer goods, though they remain net importers of advanced components. The region benefits from proximity to North American markets while facing challenges in supply chain integration and technology transfer. Recent growth focuses on serving domestic demand from growing middle classes while developing specialized capabilities in medical electronics and renewable energy components.

Middle East & Africa
Middle East & Africa represent developing markets with growth potential but current limited scale. The region focuses primarily on final assembly rather than component manufacturing, though Israel developed significant capabilities in security and military electronics. African nations increasingly serve as markets for inexpensive components while developing local assembly capacity. The region shows potential in renewable energy components and mobile technology applications, though infrastructure challenges remain for advanced manufacturing.

Report Scope

This market research report provides a comprehensive analysis of the Electronic Components Market , covering the forecast period 2025–2032. It offers detailed insights into market dynamics, technological advancements, competitive landscape, and key trends shaping the industry.

Key focus areas of the report include:

  • Market Overview: The report begins with an overview outlining its current market scenario, key growth indicators, and industry transformation drivers. It discusses macroeconomic factors, demand–supply balance, regulatory landscape, and the strategic role of semiconductors in powering advancements across industries such as automotive, telecommunications, consumer electronics, and industrial automation.
  • Market Size & Forecast: Historical data and future projections for revenue, unit shipments, and market value across major regions and segments.
  • Segmentation Analysis: Detailed breakdown by product type, technology, application, and end-user industry to identify high-growth segments and investment opportunities.
  • Regional Insights: Insights into market performance across North America, Europe, Asia-Pacific, Latin America, and the Middle East & Africa, including country-level analysis where relevant.
  • Competitive Landscape: Profiles of leading market participants, including their product offerings, R&D focus, manufacturing capacity, pricing strategies, and recent developments such as mergers, acquisitions, and partnerships.
  • Technology Trends & Innovation: Assessment of emerging technologies, integration of AI/IoT, semiconductor design trends, fabrication techniques, and evolving industry standards.
  • Market Drivers & Restraints: Evaluation of factors driving market growth along with challenges, supply chain constraints, regulatory issues, and market-entry barriers.
  • Stakeholder Insights: Insights for component suppliers, OEMs, system integrators, investors, and policymakers regarding the evolving ecosystem and strategic opportunities.

Primary and secondary research methods are employed, including interviews with industry experts, data from verified sources, and real-time market intelligence to ensure the accuracy and reliability of the insights presented.

FREQUENTLY ASKED QUESTIONS:

What is the current market size of Electronic Components Market?

->  Electronic Components Market was valued at USD 461790 million in 2024 and is expected to reach USD 634480 million by 2032.

What is the CAGR for Electronic Components Market?

-> The CAGR for Electronic Components Market is 4.7% during the forecast period 2024-2032.

What are the key market segments?

-> The market is segmented by type into active components, passive components, and electromechanical components. By application, it covers automotive, communications and computing, lighting, industrial, medical, security applications, and others.

Which regions dominate the market?

-> Asia-Pacific is the largest and fastest-growing market, followed by North America and Europe. The growth is driven by increasing electronics production, technological advancements, and high demand from end-use industries.

Who are the key market players?

-> Key players include Texas Instruments, Murata, STMicroelectronics, NXP Semiconductors, Infineon Technologies, TE Connectivity, and Samsung Electro-Mechanics, among others.

Electronic Components Market, Global Business Strategies 2025-2032

Get Sample Report PDF for Exclusive Insights

Report Sample Includes

  • Table of Contents
  • List of Tables & Figures
  • Charts, Research Methodology, and more...
PDF Icon Download Sample Report PDF

Download Sample Report

Table of Content

1 Introduction to Research & Analysis Reports
1.1 Electronic Components Market Definition
1.2 Market Segments
1.2.1 Segment by Type
1.2.2 Segment by Application
1.3 Global Electronic Components Market Overview
1.4 Features & Benefits of This Report
1.5 Methodology & Sources of Information
1.5.1 Research Methodology
1.5.2 Research Process
1.5.3 Base Year
1.5.4 Report Assumptions & Caveats
2 Global Electronic Components Overall Market Size
2.1 Global Electronic Components Market Size: 2024 VS 2032
2.2 Global Electronic Components Market Size, Prospects & Forecasts: 2020-2032
2.3 Key Market Trends, Opportunity, Drivers and Restraints
2.3.1 Market Opportunities & Trends
2.3.2 Market Drivers
2.3.3 Market Restraints
3 Company Landscape
3.1 Top Electronic Components Players in Global Market
3.2 Top Global Electronic Components Companies Ranked by Revenue
3.3 Global Electronic Components Revenue by Companies
3.4 Top 3 and Top 5 Electronic Components Companies in Global Market, by Revenue in 2024
3.5 Global Companies Electronic Components Product Type
3.6 Tier 1, Tier 2, and Tier 3 Electronic Components Players in Global Market
3.6.1 List of Global Tier 1 Electronic Components Companies
3.6.2 List of Global Tier 2 and Tier 3 Electronic Components Companies
4 Sights by Product
4.1 Overview
4.1.1 Segmentation by Type – Global Electronic Components Market Size Markets, 2024 & 2032
4.1.2 Active components
4.1.3 Passive components
4.1.4 Electromechanical
4.2 Segmentation by Type – Global Electronic Components Revenue & Forecasts
4.2.1 Segmentation by Type – Global Electronic Components Revenue, 2020-2025
4.2.2 Segmentation by Type – Global Electronic Components Revenue, 2026-2032
4.2.3 Segmentation by Type – Global Electronic Components Revenue Market Share, 2020-2032
5 Sights by Application
5.1 Overview
5.1.1 Segmentation by Application – Global Electronic Components Market Size, 2024 & 2032
5.1.2 Automotive
5.1.3 Communications and Computing
5.1.4 Lighting
5.1.5 Industrial
5.1.6 Medical
5.1.7 Security Application
5.1.8 Others
5.2 Segmentation by Application – Global Electronic Components Revenue & Forecasts
5.2.1 Segmentation by Application – Global Electronic Components Revenue, 2020-2025
5.2.2 Segmentation by Application – Global Electronic Components Revenue, 2026-2032
5.2.3 Segmentation by Application – Global Electronic Components Revenue Market Share, 2020-2032
6 Sights by Region
6.1 By Region – Global Electronic Components Market Size, 2024 & 2032
6.2 By Region – Global Electronic Components Revenue & Forecasts
6.2.1 By Region – Global Electronic Components Revenue, 2020-2025
6.2.2 By Region – Global Electronic Components Revenue, 2026-2032
6.2.3 By Region – Global Electronic Components Revenue Market Share, 2020-2032
6.3 North America
6.3.1 By Country – North America Electronic Components Revenue, 2020-2032
6.3.2 United States Electronic Components Market Size, 2020-2032
6.3.3 Canada Electronic Components Market Size, 2020-2032
6.3.4 Mexico Electronic Components Market Size, 2020-2032
6.4 Europe
6.4.1 By Country – Europe Electronic Components Revenue, 2020-2032
6.4.2 Germany Electronic Components Market Size, 2020-2032
6.4.3 France Electronic Components Market Size, 2020-2032
6.4.4 U.K. Electronic Components Market Size, 2020-2032
6.4.5 Italy Electronic Components Market Size, 2020-2032
6.4.6 Russia Electronic Components Market Size, 2020-2032
6.4.7 Nordic Countries Electronic Components Market Size, 2020-2032
6.4.8 Benelux Electronic Components Market Size, 2020-2032
6.5 Asia
6.5.1 By Region – Asia Electronic Components Revenue, 2020-2032
6.5.2 China Electronic Components Market Size, 2020-2032
6.5.3 Japan Electronic Components Market Size, 2020-2032
6.5.4 South Korea Electronic Components Market Size, 2020-2032
6.5.5 Southeast Asia Electronic Components Market Size, 2020-2032
6.5.6 India Electronic Components Market Size, 2020-2032
6.6 South America
6.6.1 By Country – South America Electronic Components Revenue, 2020-2032
6.6.2 Brazil Electronic Components Market Size, 2020-2032
6.6.3 Argentina Electronic Components Market Size, 2020-2032
6.7 Middle East & Africa
6.7.1 By Country – Middle East & Africa Electronic Components Revenue, 2020-2032
6.7.2 Turkey Electronic Components Market Size, 2020-2032
6.7.3 Israel Electronic Components Market Size, 2020-2032
6.7.4 Saudi Arabia Electronic Components Market Size, 2020-2032
6.7.5 UAE Electronic Components Market Size, 2020-2032
7 Companies Profiles
7.1 Texas Instruments
7.1.1 Texas Instruments Corporate Summary
7.1.2 Texas Instruments Business Overview
7.1.3 Texas Instruments Electronic Components Major Product Offerings
7.1.4 Texas Instruments Electronic Components Revenue in Global Market (2020-2025)
7.1.5 Texas Instruments Key News & Latest Developments
7.2 Murata
7.2.1 Murata Corporate Summary
7.2.2 Murata Business Overview
7.2.3 Murata Electronic Components Major Product Offerings
7.2.4 Murata Electronic Components Revenue in Global Market (2020-2025)
7.2.5 Murata Key News & Latest Developments
7.3 ABB
7.3.1 ABB Corporate Summary
7.3.2 ABB Business Overview
7.3.3 ABB Electronic Components Major Product Offerings
7.3.4 ABB Electronic Components Revenue in Global Market (2020-2025)
7.3.5 ABB Key News & Latest Developments
7.4 STMicroelectronics
7.4.1 STMicroelectronics Corporate Summary
7.4.2 STMicroelectronics Business Overview
7.4.3 STMicroelectronics Electronic Components Major Product Offerings
7.4.4 STMicroelectronics Electronic Components Revenue in Global Market (2020-2025)
7.4.5 STMicroelectronics Key News & Latest Developments
7.5 NXP Semiconductors
7.5.1 NXP Semiconductors Corporate Summary
7.5.2 NXP Semiconductors Business Overview
7.5.3 NXP Semiconductors Electronic Components Major Product Offerings
7.5.4 NXP Semiconductors Electronic Components Revenue in Global Market (2020-2025)
7.5.5 NXP Semiconductors Key News & Latest Developments
7.6 Kyocera
7.6.1 Kyocera Corporate Summary
7.6.2 Kyocera Business Overview
7.6.3 Kyocera Electronic Components Major Product Offerings
7.6.4 Kyocera Electronic Components Revenue in Global Market (2020-2025)
7.6.5 Kyocera Key News & Latest Developments
7.7 Omron
7.7.1 Omron Corporate Summary
7.7.2 Omron Business Overview
7.7.3 Omron Electronic Components Major Product Offerings
7.7.4 Omron Electronic Components Revenue in Global Market (2020-2025)
7.7.5 Omron Key News & Latest Developments
7.8 Amphenol
7.8.1 Amphenol Corporate Summary
7.8.2 Amphenol Business Overview
7.8.3 Amphenol Electronic Components Major Product Offerings
7.8.4 Amphenol Electronic Components Revenue in Global Market (2020-2025)
7.8.5 Amphenol Key News & Latest Developments
7.9 ON Semiconductor
7.9.1 ON Semiconductor Corporate Summary
7.9.2 ON Semiconductor Business Overview
7.9.3 ON Semiconductor Electronic Components Major Product Offerings
7.9.4 ON Semiconductor Electronic Components Revenue in Global Market (2020-2025)
7.9.5 ON Semiconductor Key News & Latest Developments
7.10 Infineon Technologies
7.10.1 Infineon Technologies Corporate Summary
7.10.2 Infineon Technologies Business Overview
7.10.3 Infineon Technologies Electronic Components Major Product Offerings
7.10.4 Infineon Technologies Electronic Components Revenue in Global Market (2020-2025)
7.10.5 Infineon Technologies Key News & Latest Developments
7.11 Samsung Electro-Mechanics
7.11.1 Samsung Electro-Mechanics Corporate Summary
7.11.2 Samsung Electro-Mechanics Business Overview
7.11.3 Samsung Electro-Mechanics Electronic Components Major Product Offerings
7.11.4 Samsung Electro-Mechanics Electronic Components Revenue in Global Market (2020-2025)
7.11.5 Samsung Electro-Mechanics Key News & Latest Developments
7.12 TDK Corporation
7.12.1 TDK Corporation Corporate Summary
7.12.2 TDK Corporation Business Overview
7.12.3 TDK Corporation Electronic Components Major Product Offerings
7.12.4 TDK Corporation Electronic Components Revenue in Global Market (2020-2025)
7.12.5 TDK Corporation Key News & Latest Developments
7.13 Analog Devices, Inc.
7.13.1 Analog Devices, Inc. Corporate Summary
7.13.2 Analog Devices, Inc. Business Overview
7.13.3 Analog Devices, Inc. Electronic Components Major Product Offerings
7.13.4 Analog Devices, Inc. Electronic Components Revenue in Global Market (2020-2025)
7.13.5 Analog Devices, Inc. Key News & Latest Developments
7.14 Molex
7.14.1 Molex Corporate Summary
7.14.2 Molex Business Overview
7.14.3 Molex Electronic Components Major Product Offerings
7.14.4 Molex Electronic Components Revenue in Global Market (2020-2025)
7.14.5 Molex Key News & Latest Developments
7.15 Vishay
7.15.1 Vishay Corporate Summary
7.15.2 Vishay Business Overview
7.15.3 Vishay Electronic Components Major Product Offerings
7.15.4 Vishay Electronic Components Revenue in Global Market (2020-2025)
7.15.5 Vishay Key News & Latest Developments
7.16 Qorvo
7.16.1 Qorvo Corporate Summary
7.16.2 Qorvo Business Overview
7.16.3 Qorvo Electronic Components Major Product Offerings
7.16.4 Qorvo Electronic Components Revenue in Global Market (2020-2025)
7.16.5 Qorvo Key News & Latest Developments
7.17 Nippon Mektron
7.17.1 Nippon Mektron Corporate Summary
7.17.2 Nippon Mektron Business Overview
7.17.3 Nippon Mektron Electronic Components Major Product Offerings
7.17.4 Nippon Mektron Electronic Components Revenue in Global Market (2020-2025)
7.17.5 Nippon Mektron Key News & Latest Developments
7.18 Vectron
7.18.1 Vectron Corporate Summary
7.18.2 Vectron Business Overview
7.18.3 Vectron Electronic Components Major Product Offerings
7.18.4 Vectron Electronic Components Revenue in Global Market (2020-2025)
7.18.5 Vectron Key News & Latest Developments
7.19 Yageo
7.19.1 Yageo Corporate Summary
7.19.2 Yageo Business Overview
7.19.3 Yageo Electronic Components Major Product Offerings
7.19.4 Yageo Electronic Components Revenue in Global Market (2020-2025)
7.19.5 Yageo Key News & Latest Developments
7.20 Skyworks
7.20.1 Skyworks Corporate Summary
7.20.2 Skyworks Business Overview
7.20.3 Skyworks Electronic Components Major Product Offerings
7.20.4 Skyworks Electronic Components Revenue in Global Market (2020-2025)
7.20.5 Skyworks Key News & Latest Developments
7.21 Taiyo Yuden Co., Ltd.
7.21.1 Taiyo Yuden Co., Ltd. Corporate Summary
7.21.2 Taiyo Yuden Co., Ltd. Business Overview
7.21.3 Taiyo Yuden Co., Ltd. Electronic Components Major Product Offerings
7.21.4 Taiyo Yuden Co., Ltd. Electronic Components Revenue in Global Market (2020-2025)
7.21.5 Taiyo Yuden Co., Ltd. Key News & Latest Developments
7.22 Eaton Corp.
7.22.1 Eaton Corp. Corporate Summary
7.22.2 Eaton Corp. Business Overview
7.22.3 Eaton Corp. Electronic Components Major Product Offerings
7.22.4 Eaton Corp. Electronic Components Revenue in Global Market (2020-2025)
7.22.5 Eaton Corp. Key News & Latest Developments
7.23 TE Connectivity Ltd.
7.23.1 TE Connectivity Ltd. Corporate Summary
7.23.2 TE Connectivity Ltd. Business Overview
7.23.3 TE Connectivity Ltd. Electronic Components Major Product Offerings
7.23.4 TE Connectivity Ltd. Electronic Components Revenue in Global Market (2020-2025)
7.23.5 TE Connectivity Ltd. Key News & Latest Developments
7.24 Littelfuse
7.24.1 Littelfuse Corporate Summary
7.24.2 Littelfuse Business Overview
7.24.3 Littelfuse Electronic Components Major Product Offerings
7.24.4 Littelfuse Electronic Components Revenue in Global Market (2020-2025)
7.24.5 Littelfuse Key News & Latest Developments
7.25 Panasonic Corporation
7.25.1 Panasonic Corporation Corporate Summary
7.25.2 Panasonic Corporation Business Overview
7.25.3 Panasonic Corporation Electronic Components Major Product Offerings
7.25.4 Panasonic Corporation Electronic Components Revenue in Global Market (2020-2025)
7.25.5 Panasonic Corporation Key News & Latest Developments
7.26 KEMET
7.26.1 KEMET Corporate Summary
7.26.2 KEMET Business Overview
7.26.3 KEMET Electronic Components Major Product Offerings
7.26.4 KEMET Electronic Components Revenue in Global Market (2020-2025)
7.26.5 KEMET Key News & Latest Developments
7.27 Nippon Chemi-Con
7.27.1 Nippon Chemi-Con Corporate Summary
7.27.2 Nippon Chemi-Con Business Overview
7.27.3 Nippon Chemi-Con Electronic Components Major Product Offerings
7.27.4 Nippon Chemi-Con Electronic Components Revenue in Global Market (2020-2025)
7.27.5 Nippon Chemi-Con Key News & Latest Developments
7.28 Microchip
7.28.1 Microchip Corporate Summary
7.28.2 Microchip Business Overview
7.28.3 Microchip Electronic Components Major Product Offerings
7.28.4 Microchip Electronic Components Revenue in Global Market (2020-2025)
7.28.5 Microchip Key News & Latest Developments
7.29 Hangzhou Silan Microelectronics
7.29.1 Hangzhou Silan Microelectronics Corporate Summary
7.29.2 Hangzhou Silan Microelectronics Business Overview
7.29.3 Hangzhou Silan Microelectronics Electronic Components Major Product Offerings
7.29.4 Hangzhou Silan Microelectronics Electronic Components Revenue in Global Market (2020-2025)
7.29.5 Hangzhou Silan Microelectronics Key News & Latest Developments
7.30 Focus Lightings Tech
7.30.1 Focus Lightings Tech Corporate Summary
7.30.2 Focus Lightings Tech Business Overview
7.30.3 Focus Lightings Tech Electronic Components Major Product Offerings
7.30.4 Focus Lightings Tech Electronic Components Revenue in Global Market (2020-2025)
7.30.5 Focus Lightings Tech Key News & Latest Developments
7.31 Goertek Inc.
7.31.1 Goertek Inc. Corporate Summary
7.31.2 Goertek Inc. Business Overview
7.31.3 Goertek Inc. Electronic Components Major Product Offerings
7.31.4 Goertek Inc. Electronic Components Revenue in Global Market (2020-2025)
7.31.5 Goertek Inc. Key News & Latest Developments
7.32 China Eagle Electronic Technology
7.32.1 China Eagle Electronic Technology Corporate Summary
7.32.2 China Eagle Electronic Technology Business Overview
7.32.3 China Eagle Electronic Technology Electronic Components Major Product Offerings
7.32.4 China Eagle Electronic Technology Electronic Components Revenue in Global Market (2020-2025)
7.32.5 China Eagle Electronic Technology Key News & Latest Developments
7.33 Lingyi iTech
7.33.1 Lingyi iTech Corporate Summary
7.33.2 Lingyi iTech Business Overview
7.33.3 Lingyi iTech Electronic Components Major Product Offerings
7.33.4 Lingyi iTech Electronic Components Revenue in Global Market (2020-2025)
7.33.5 Lingyi iTech Key News & Latest Developments
7.34 Jilin Sino-microelectronics
7.34.1 Jilin Sino-microelectronics Corporate Summary
7.34.2 Jilin Sino-microelectronics Business Overview
7.34.3 Jilin Sino-microelectronics Electronic Components Major Product Offerings
7.34.4 Jilin Sino-microelectronics Electronic Components Revenue in Global Market (2020-2025)
7.34.5 Jilin Sino-microelectronics Key News & Latest Developments
8 Conclusion
9 Appendix
9.1 Note
9.2 Examples of Clients
9.3 DisclaimerList of Tables
Table 1. Electronic Components Market Opportunities & Trends in Global Market
Table 2. Electronic Components Market Drivers in Global Market
Table 3. Electronic Components Market Restraints in Global Market
Table 4. Key Players of Electronic Components in Global Market
Table 5. Top Electronic Components Players in Global Market, Ranking by Revenue (2024)
Table 6. Global Electronic Components Revenue by Companies, (US$, Mn), 2020-2025
Table 7. Global Electronic Components Revenue Share by Companies, 2020-2025
Table 8. Global Companies Electronic Components Product Type
Table 9. List of Global Tier 1 Electronic Components Companies, Revenue (US$, Mn) in 2024 and Market Share
Table 10. List of Global Tier 2 and Tier 3 Electronic Components Companies, Revenue (US$, Mn) in 2024 and Market Share
Table 11. Segmentation by Type – Global Electronic Components Revenue, (US$, Mn), 2024 & 2032
Table 12. Segmentation by Type – Global Electronic Components Revenue (US$, Mn), 2020-2025
Table 13. Segmentation by Type – Global Electronic Components Revenue (US$, Mn), 2026-2032
Table 14. Segmentation by Application– Global Electronic Components Revenue, (US$, Mn), 2024 & 2032
Table 15. Segmentation by Application – Global Electronic Components Revenue, (US$, Mn), 2020-2025
Table 16. Segmentation by Application – Global Electronic Components Revenue, (US$, Mn), 2026-2032
Table 17. By Region– Global Electronic Components Revenue, (US$, Mn), 2024 & 2032
Table 18. By Region – Global Electronic Components Revenue, (US$, Mn), 2020-2025
Table 19. By Region – Global Electronic Components Revenue, (US$, Mn), 2026-2032
Table 20. By Country – North America Electronic Components Revenue, (US$, Mn), 2020-2025
Table 21. By Country – North America Electronic Components Revenue, (US$, Mn), 2026-2032
Table 22. By Country – Europe Electronic Components Revenue, (US$, Mn), 2020-2025
Table 23. By Country – Europe Electronic Components Revenue, (US$, Mn), 2026-2032
Table 24. By Region – Asia Electronic Components Revenue, (US$, Mn), 2020-2025
Table 25. By Region – Asia Electronic Components Revenue, (US$, Mn), 2026-2032
Table 26. By Country – South America Electronic Components Revenue, (US$, Mn), 2020-2025
Table 27. By Country – South America Electronic Components Revenue, (US$, Mn), 2026-2032
Table 28. By Country – Middle East & Africa Electronic Components Revenue, (US$, Mn), 2020-2025
Table 29. By Country – Middle East & Africa Electronic Components Revenue, (US$, Mn), 2026-2032
Table 30. Texas Instruments Corporate Summary
Table 31. Texas Instruments Electronic Components Product Offerings
Table 32. Texas Instruments Electronic Components Revenue (US$, Mn) & (2020-2025)
Table 33. Texas Instruments Key News & Latest Developments
Table 34. Murata Corporate Summary
Table 35. Murata Electronic Components Product Offerings
Table 36. Murata Electronic Components Revenue (US$, Mn) & (2020-2025)
Table 37. Murata Key News & Latest Developments
Table 38. ABB Corporate Summary
Table 39. ABB Electronic Components Product Offerings
Table 40. ABB Electronic Components Revenue (US$, Mn) & (2020-2025)
Table 41. ABB Key News & Latest Developments
Table 42. STMicroelectronics Corporate Summary
Table 43. STMicroelectronics Electronic Components Product Offerings
Table 44. STMicroelectronics Electronic Components Revenue (US$, Mn) & (2020-2025)
Table 45. STMicroelectronics Key News & Latest Developments
Table 46. NXP Semiconductors Corporate Summary
Table 47. NXP Semiconductors Electronic Components Product Offerings
Table 48. NXP Semiconductors Electronic Components Revenue (US$, Mn) & (2020-2025)
Table 49. NXP Semiconductors Key News & Latest Developments
Table 50. Kyocera Corporate Summary
Table 51. Kyocera Electronic Components Product Offerings
Table 52. Kyocera Electronic Components Revenue (US$, Mn) & (2020-2025)
Table 53. Kyocera Key News & Latest Developments
Table 54. Omron Corporate Summary
Table 55. Omron Electronic Components Product Offerings
Table 56. Omron Electronic Components Revenue (US$, Mn) & (2020-2025)
Table 57. Omron Key News & Latest Developments
Table 58. Amphenol Corporate Summary
Table 59. Amphenol Electronic Components Product Offerings
Table 60. Amphenol Electronic Components Revenue (US$, Mn) & (2020-2025)
Table 61. Amphenol Key News & Latest Developments
Table 62. ON Semiconductor Corporate Summary
Table 63. ON Semiconductor Electronic Components Product Offerings
Table 64. ON Semiconductor Electronic Components Revenue (US$, Mn) & (2020-2025)
Table 65. ON Semiconductor Key News & Latest Developments
Table 66. Infineon Technologies Corporate Summary
Table 67. Infineon Technologies Electronic Components Product Offerings
Table 68. Infineon Technologies Electronic Components Revenue (US$, Mn) & (2020-2025)
Table 69. Infineon Technologies Key News & Latest Developments
Table 70. Samsung Electro-Mechanics Corporate Summary
Table 71. Samsung Electro-Mechanics Electronic Components Product Offerings
Table 72. Samsung Electro-Mechanics Electronic Components Revenue (US$, Mn) & (2020-2025)
Table 73. Samsung Electro-Mechanics Key News & Latest Developments
Table 74. TDK Corporation Corporate Summary
Table 75. TDK Corporation Electronic Components Product Offerings
Table 76. TDK Corporation Electronic Components Revenue (US$, Mn) & (2020-2025)
Table 77. TDK Corporation Key News & Latest Developments
Table 78. Analog Devices, Inc. Corporate Summary
Table 79. Analog Devices, Inc. Electronic Components Product Offerings
Table 80. Analog Devices, Inc. Electronic Components Revenue (US$, Mn) & (2020-2025)
Table 81. Analog Devices, Inc. Key News & Latest Developments
Table 82. Molex Corporate Summary
Table 83. Molex Electronic Components Product Offerings
Table 84. Molex Electronic Components Revenue (US$, Mn) & (2020-2025)
Table 85. Molex Key News & Latest Developments
Table 86. Vishay Corporate Summary
Table 87. Vishay Electronic Components Product Offerings
Table 88. Vishay Electronic Components Revenue (US$, Mn) & (2020-2025)
Table 89. Vishay Key News & Latest Developments
Table 90. Qorvo Corporate Summary
Table 91. Qorvo Electronic Components Product Offerings
Table 92. Qorvo Electronic Components Revenue (US$, Mn) & (2020-2025)
Table 93. Qorvo Key News & Latest Developments
Table 94. Nippon Mektron Corporate Summary
Table 95. Nippon Mektron Electronic Components Product Offerings
Table 96. Nippon Mektron Electronic Components Revenue (US$, Mn) & (2020-2025)
Table 97. Nippon Mektron Key News & Latest Developments
Table 98. Vectron Corporate Summary
Table 99. Vectron Electronic Components Product Offerings
Table 100. Vectron Electronic Components Revenue (US$, Mn) & (2020-2025)
Table 101. Vectron Key News & Latest Developments
Table 102. Yageo Corporate Summary
Table 103. Yageo Electronic Components Product Offerings
Table 104. Yageo Electronic Components Revenue (US$, Mn) & (2020-2025)
Table 105. Yageo Key News & Latest Developments
Table 106. Skyworks Corporate Summary
Table 107. Skyworks Electronic Components Product Offerings
Table 108. Skyworks Electronic Components Revenue (US$, Mn) & (2020-2025)
Table 109. Skyworks Key News & Latest Developments
Table 110. Taiyo Yuden Co., Ltd. Corporate Summary
Table 111. Taiyo Yuden Co., Ltd. Electronic Components Product Offerings
Table 112. Taiyo Yuden Co., Ltd. Electronic Components Revenue (US$, Mn) & (2020-2025)
Table 113. Taiyo Yuden Co., Ltd. Key News & Latest Developments
Table 114. Eaton Corp. Corporate Summary
Table 115. Eaton Corp. Electronic Components Product Offerings
Table 116. Eaton Corp. Electronic Components Revenue (US$, Mn) & (2020-2025)
Table 117. Eaton Corp. Key News & Latest Developments
Table 118. TE Connectivity Ltd. Corporate Summary
Table 119. TE Connectivity Ltd. Electronic Components Product Offerings
Table 120. TE Connectivity Ltd. Electronic Components Revenue (US$, Mn) & (2020-2025)
Table 121. TE Connectivity Ltd. Key News & Latest Developments
Table 122. Littelfuse Corporate Summary
Table 123. Littelfuse Electronic Components Product Offerings
Table 124. Littelfuse Electronic Components Revenue (US$, Mn) & (2020-2025)
Table 125. Littelfuse Key News & Latest Developments
Table 126. Panasonic Corporation Corporate Summary
Table 127. Panasonic Corporation Electronic Components Product Offerings
Table 128. Panasonic Corporation Electronic Components Revenue (US$, Mn) & (2020-2025)
Table 129. Panasonic Corporation Key News & Latest Developments
Table 130. KEMET Corporate Summary
Table 131. KEMET Electronic Components Product Offerings
Table 132. KEMET Electronic Components Revenue (US$, Mn) & (2020-2025)
Table 133. KEMET Key News & Latest Developments
Table 134. Nippon Chemi-Con Corporate Summary
Table 135. Nippon Chemi-Con Electronic Components Product Offerings
Table 136. Nippon Chemi-Con Electronic Components Revenue (US$, Mn) & (2020-2025)
Table 137. Nippon Chemi-Con Key News & Latest Developments
Table 138. Microchip Corporate Summary
Table 139. Microchip Electronic Components Product Offerings
Table 140. Microchip Electronic Components Revenue (US$, Mn) & (2020-2025)
Table 141. Microchip Key News & Latest Developments
Table 142. Hangzhou Silan Microelectronics Corporate Summary
Table 143. Hangzhou Silan Microelectronics Electronic Components Product Offerings
Table 144. Hangzhou Silan Microelectronics Electronic Components Revenue (US$, Mn) & (2020-2025)
Table 145. Hangzhou Silan Microelectronics Key News & Latest Developments
Table 146. Focus Lightings Tech Corporate Summary
Table 147. Focus Lightings Tech Electronic Components Product Offerings
Table 148. Focus Lightings Tech Electronic Components Revenue (US$, Mn) & (2020-2025)
Table 149. Focus Lightings Tech Key News & Latest Developments
Table 150. Goertek Inc. Corporate Summary
Table 151. Goertek Inc. Electronic Components Product Offerings
Table 152. Goertek Inc. Electronic Components Revenue (US$, Mn) & (2020-2025)
Table 153. Goertek Inc. Key News & Latest Developments
Table 154. China Eagle Electronic Technology Corporate Summary
Table 155. China Eagle Electronic Technology Electronic Components Product Offerings
Table 156. China Eagle Electronic Technology Electronic Components Revenue (US$, Mn) & (2020-2025)
Table 157. China Eagle Electronic Technology Key News & Latest Developments
Table 158. Lingyi iTech Corporate Summary
Table 159. Lingyi iTech Electronic Components Product Offerings
Table 160. Lingyi iTech Electronic Components Revenue (US$, Mn) & (2020-2025)
Table 161. Lingyi iTech Key News & Latest Developments
Table 162. Jilin Sino-microelectronics Corporate Summary
Table 163. Jilin Sino-microelectronics Electronic Components Product Offerings
Table 164. Jilin Sino-microelectronics Electronic Components Revenue (US$, Mn) & (2020-2025)
Table 165. Jilin Sino-microelectronics Key News & Latest Developments

List of Figures
Figure 1. Electronic Components Product Picture
Figure 2. Electronic Components Segment by Type in 2024
Figure 3. Electronic Components Segment by Application in 2024
Figure 4. Global Electronic Components Market Overview: 2024
Figure 5. Key Caveats
Figure 6. Global Electronic Components Market Size: 2024 VS 2032 (US$, Mn)
Figure 7. Global Electronic Components Revenue: 2020-2032 (US$, Mn)
Figure 8. The Top 3 and 5 Players Market Share by Electronic Components Revenue in 2024
Figure 9. Segmentation by Type – Global Electronic Components Revenue, (US$, Mn), 2024 & 2032
Figure 10. Segmentation by Type – Global Electronic Components Revenue Market Share, 2020-2032
Figure 11. Segmentation by Application – Global Electronic Components Revenue, (US$, Mn), 2024 & 2032
Figure 12. Segmentation by Application – Global Electronic Components Revenue Market Share, 2020-2032
Figure 13. By Region – Global Electronic Components Revenue Market Share, 2020-2032
Figure 14. By Country – North America Electronic Components Revenue Market Share, 2020-2032
Figure 15. United States Electronic Components Revenue, (US$, Mn), 2020-2032
Figure 16. Canada Electronic Components Revenue, (US$, Mn), 2020-2032
Figure 17. Mexico Electronic Components Revenue, (US$, Mn), 2020-2032
Figure 18. By Country – Europe Electronic Components Revenue Market Share, 2020-2032
Figure 19. Germany Electronic Components Revenue, (US$, Mn), 2020-2032
Figure 20. France Electronic Components Revenue, (US$, Mn), 2020-2032
Figure 21. U.K. Electronic Components Revenue, (US$, Mn), 2020-2032
Figure 22. Italy Electronic Components Revenue, (US$, Mn), 2020-2032
Figure 23. Russia Electronic Components Revenue, (US$, Mn), 2020-2032
Figure 24. Nordic Countries Electronic Components Revenue, (US$, Mn), 2020-2032
Figure 25. Benelux Electronic Components Revenue, (US$, Mn), 2020-2032
Figure 26. By Region – Asia Electronic Components Revenue Market Share, 2020-2032
Figure 27. China Electronic Components Revenue, (US$, Mn), 2020-2032
Figure 28. Japan Electronic Components Revenue, (US$, Mn), 2020-2032
Figure 29. South Korea Electronic Components Revenue, (US$, Mn), 2020-2032
Figure 30. Southeast Asia Electronic Components Revenue, (US$, Mn), 2020-2032
Figure 31. India Electronic Components Revenue, (US$, Mn), 2020-2032
Figure 32. By Country – South America Electronic Components Revenue Market Share, 2020-2032
Figure 33. Brazil Electronic Components Revenue, (US$, Mn), 2020-2032
Figure 34. Argentina Electronic Components Revenue, (US$, Mn), 2020-2032
Figure 35. By Country – Middle East & Africa Electronic Components Revenue Market Share, 2020-2032
Figure 36. Turkey Electronic Components Revenue, (US$, Mn), 2020-2032
Figure 37. Israel Electronic Components Revenue, (US$, Mn), 2020-2032
Figure 38. Saudi Arabia Electronic Components Revenue, (US$, Mn), 2020-2032
Figure 39. UAE Electronic Components Revenue, (US$, Mn), 2020-2032
Figure 40. Texas Instruments Electronic Components Revenue Year Over Year Growth (US$, Mn) & (2020-2025)
Figure 41. Murata Electronic Components Revenue Year Over Year Growth (US$, Mn) & (2020-2025)
Figure 42. ABB Electronic Components Revenue Year Over Year Growth (US$, Mn) & (2020-2025)
Figure 43. STMicroelectronics Electronic Components Revenue Year Over Year Growth (US$, Mn) & (2020-2025)
Figure 44. NXP Semiconductors Electronic Components Revenue Year Over Year Growth (US$, Mn) & (2020-2025)
Figure 45. Kyocera Electronic Components Revenue Year Over Year Growth (US$, Mn) & (2020-2025)
Figure 46. Omron Electronic Components Revenue Year Over Year Growth (US$, Mn) & (2020-2025)
Figure 47. Amphenol Electronic Components Revenue Year Over Year Growth (US$, Mn) & (2020-2025)
Figure 48. ON Semiconductor Electronic Components Revenue Year Over Year Growth (US$, Mn) & (2020-2025)
Figure 49. Infineon Technologies Electronic Components Revenue Year Over Year Growth (US$, Mn) & (2020-2025)
Figure 50. Samsung Electro-Mechanics Electronic Components Revenue Year Over Year Growth (US$, Mn) & (2020-2025)
Figure 51. TDK Corporation Electronic Components Revenue Year Over Year Growth (US$, Mn) & (2020-2025)
Figure 52. Analog Devices, Inc. Electronic Components Revenue Year Over Year Growth (US$, Mn) & (2020-2025)
Figure 53. Molex Electronic Components Revenue Year Over Year Growth (US$, Mn) & (2020-2025)
Figure 54. Vishay Electronic Components Revenue Year Over Year Growth (US$, Mn) & (2020-2025)
Figure 55. Qorvo Electronic Components Revenue Year Over Year Growth (US$, Mn) & (2020-2025)
Figure 56. Nippon Mektron Electronic Components Revenue Year Over Year Growth (US$, Mn) & (2020-2025)
Figure 57. Vectron Electronic Components Revenue Year Over Year Growth (US$, Mn) & (2020-2025)
Figure 58. Yageo Electronic Components Revenue Year Over Year Growth (US$, Mn) & (2020-2025)
Figure 59. Skyworks Electronic Components Revenue Year Over Year Growth (US$, Mn) & (2020-2025)
Figure 60. Taiyo Yuden Co., Ltd. Electronic Components Revenue Year Over Year Growth (US$, Mn) & (2020-2025)
Figure 61. Eaton Corp. Electronic Components Revenue Year Over Year Growth (US$, Mn) & (2020-2025)
Figure 62. TE Connectivity Ltd. Electronic Components Revenue Year Over Year Growth (US$, Mn) & (2020-2025)
Figure 63. Littelfuse Electronic Components Revenue Year Over Year Growth (US$, Mn) & (2020-2025)
Figure 64. Panasonic Corporation Electronic Components Revenue Year Over Year Growth (US$, Mn) & (2020-2025)
Figure 65. KEMET Electronic Components Revenue Year Over Year Growth (US$, Mn) & (2020-2025)
Figure 66. Nippon Chemi-Con Electronic Components Revenue Year Over Year Growth (US$, Mn) & (2020-2025)
Figure 67. Microchip Electronic Components Revenue Year Over Year Growth (US$, Mn) & (2020-2025)
Figure 68. Hangzhou Silan Microelectronics Electronic Components Revenue Year Over Year Growth (US$, Mn) & (2020-2025)
Figure 69. Focus Lightings Tech Electronic Components Revenue Year Over Year Growth (US$, Mn) & (2020-2025)
Figure 70. Goertek Inc. Electronic Components Revenue Year Over Year Growth (US$, Mn) & (2020-2025)
Figure 71. China Eagle Electronic Technology Electronic Components Revenue Year Over Year Growth (US$, Mn) & (2020-2025)
Figure 72. Lingyi iTech Electronic Components Revenue Year Over Year Growth (US$, Mn) & (2020-2025)
Figure 73. Jilin Sino-microelectronics Electronic Components Revenue Year Over Year Growth (US$, Mn) & (2020-2025)