Electronic Bag Tag Market, Trends, Business Strategies 2025-2032

Electronic Bag Tag Market size was valued at US$ 234 million in 2024 and is projected to reach US$ 456 million by 2032, at a CAGR of 8.9% during the forecast period 2025-2032

PDF Icon Download Sample Report PDF
  • Quick Dispatch

    All Orders

  • Secure Payment

    100% Secure Payment

Price range: $1,500.00 through $4,250.00

Clear

MARKET INSIGHTS

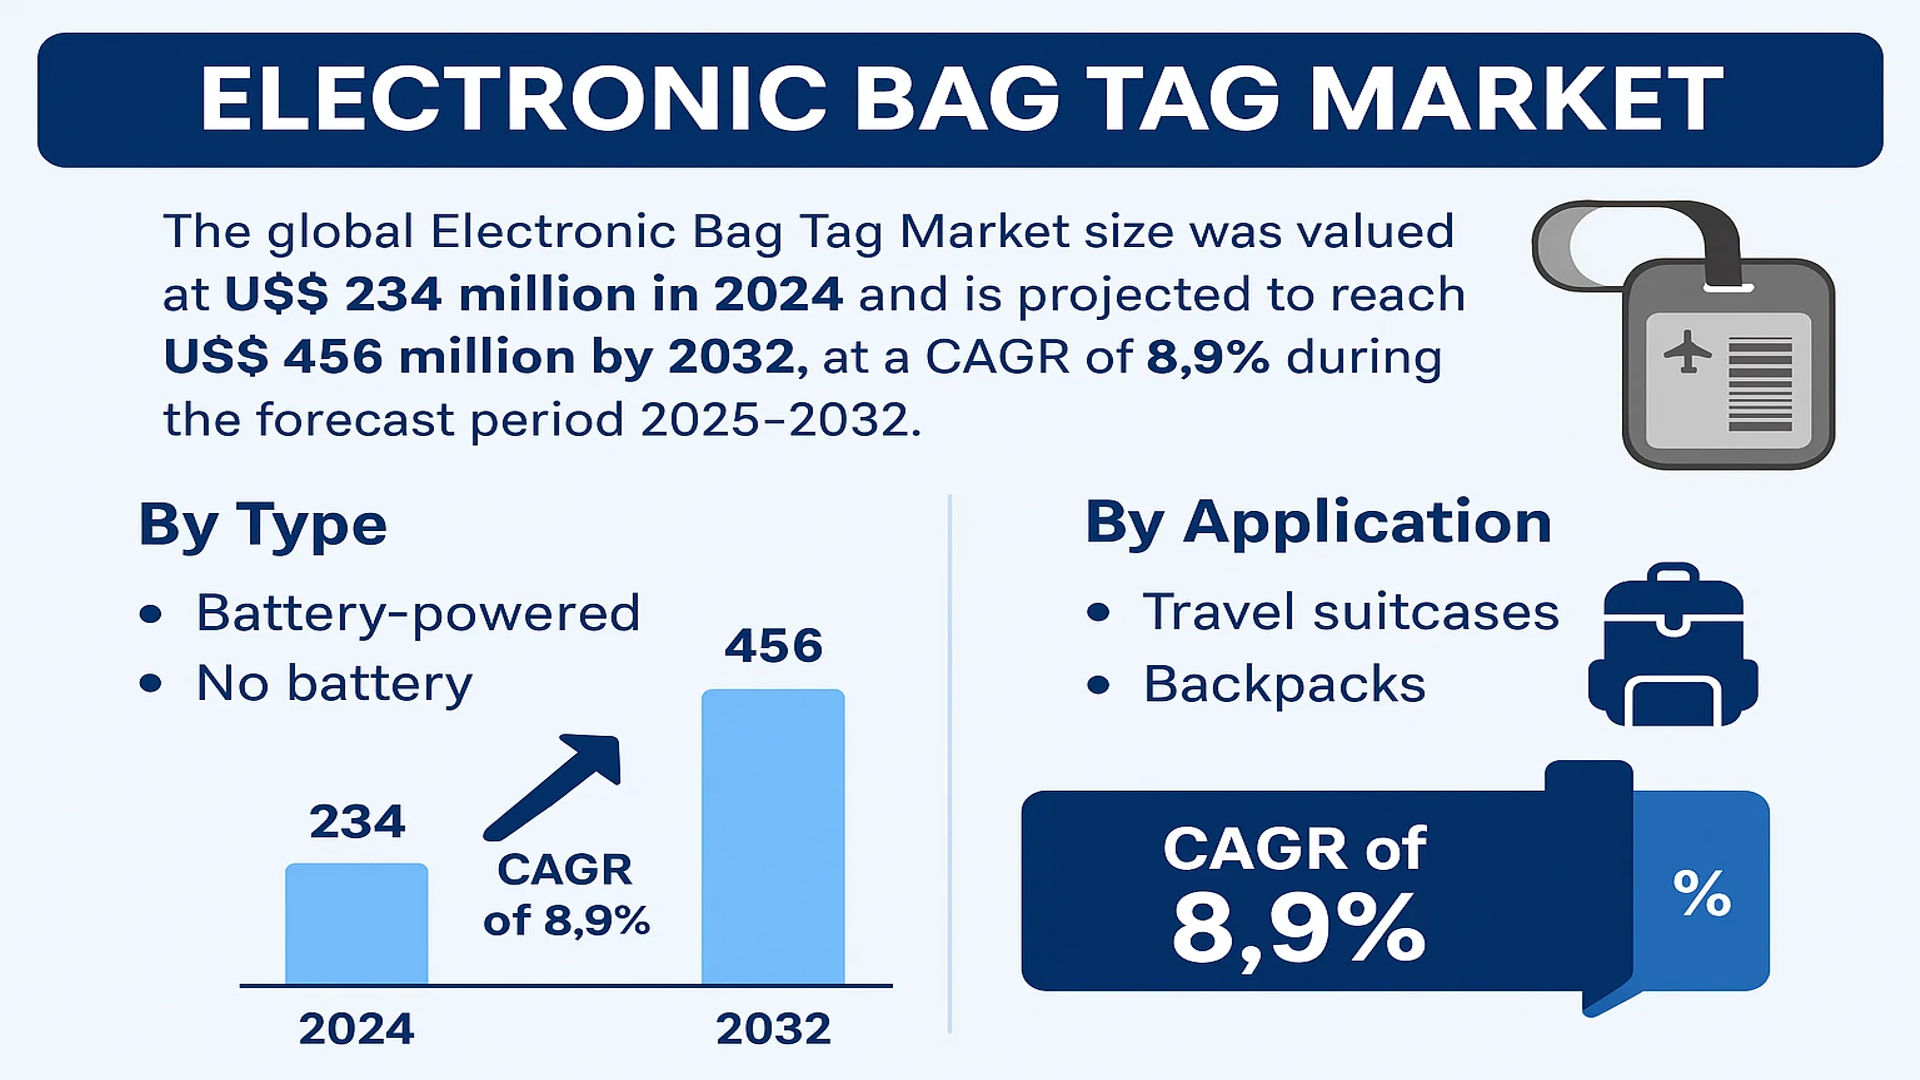
The global Electronic Bag Tag Market size was valued at US$ 234 million in 2024 and is projected to reach US$ 456 million by 2032, at a CAGR of 8.9% during the forecast period 2025-2032.

Electronic Bag Tag Market


Electronic Bag Tags are smart luggage tracking devices that digitize traditional paper baggage tags. These battery-powered or passive devices use electronic ink displays to show flight information transmitted via Bluetooth from airline apps. Key functionalities include real-time baggage tracking, automated check-in processes, and reduced airport congestion. Major variants include battery-operated active tags and passive NFC-enabled versions.

The market growth is primarily driven by increasing air passenger traffic, which reached 4.7 billion globally in 2023, and airlines’ focus on digital transformation initiatives. While North America currently dominates with 38% market share, Asia-Pacific is emerging as the fastest-growing region due to expanding middle-class air travel. Key challenges include higher costs compared to traditional tags and limited compatibility across airline systems. Major players like BAGTAG and SITA are investing in interoperable solutions to address this fragmentation.

MARKET DRIVERS

Rising Air Passenger Traffic to Accelerate Electronic Bag Tag Adoption

The global air transport industry is witnessing robust recovery post-pandemic, with passenger volumes expected to exceed 4.35 billion in 2024 – surpassing pre-pandemic levels. This surge in air travel creates substantial demand for streamlined baggage handling solutions. Electronic bag tags enable passengers to check luggage in seconds via smartphone integration, reducing airport congestion and improving operational efficiency. Airlines are increasingly adopting this technology as they handle larger passenger volumes with constrained infrastructure.

Growing Focus on Digital Transformation in Aviation Spurs Innovation

Major airlines worldwide are investing heavily in digital transformation, with baggage handling representing a key focus area. The aviation industry’s transition towards smart airports and seamless travel experiences is driving adoption of electronic bag tags. Major carriers have begun large-scale deployments, recognizing the technology’s ability to reduce costs – electronic tags can decrease baggage handling expenses by up to 30% compared to traditional paper tags. These efficiency gains, coupled with enhanced passenger experience benefits, are accelerating market penetration.

Furthermore, regulatory support for digital baggage solutions is emerging as a significant growth catalyst. Aviation authorities in several regions are establishing frameworks to standardize electronic tag implementations, creating favorable conditions for market expansion.

MARKET RESTRAINTS

High Initial Implementation Costs Limit Widespread Adoption

While electronic bag tags offer long-term operational savings, their upfront costs present a significant barrier to widespread implementation. A single electronic tag unit can cost between $40-$100, making large-scale fleet deployments cost-prohibitive for many airlines. Infrastructure upgrades at airports to support electronic tag scanning require additional capital investments. These financial challenges are particularly acute for budget carriers and regional airlines operating with thin profit margins.

Technology Standardization Challenges Hinder Ecosystem Development

The lack of universal technical standards for electronic bag tags creates interoperability issues across different airline systems and airports. Currently, most solutions operate on proprietary platforms, limiting their usefulness for passengers traveling with multiple carriers. This fragmentation slows down industry-wide adoption and creates integration challenges for airports handling baggage from various airlines. Standardization efforts are underway, but achieving global consensus remains an ongoing challenge that temporarily constrains market growth.

MARKET OPPORTUNITIES

Integration with Emerging Technologies Creates New Use Cases

The convergence of electronic bag tags with advanced technologies like IoT and blockchain presents significant growth opportunities. Smart tags equipped with real-time tracking sensors can provide continuous baggage location updates, addressing a major pain point for travelers. When combined with blockchain-based baggage reconciliation systems, these solutions could virtually eliminate lost luggage incidents – a problem that currently costs the aviation industry approximately $2 billion annually.

Expansion of Loyalty Programs and Ancillary Services

Electronic bag tags offer airlines new avenues for customer engagement and revenue generation. The technology enables personalized baggage handling services tied to frequent flyer status, creating opportunities for premium service differentiation. Airlines can leverage tagged baggage data to offer targeted ancillary services, from expedited handling to insurance products. This capability becomes increasingly valuable as carriers seek to diversify revenue streams beyond ticket sales in the post-pandemic landscape.

MARKET CHALLENGES

Battery Life and Durability Concerns Impact Consumer Acceptance

While electronic bag tags offer clear advantages, technical limitations around battery performance and physical durability may slow consumer adoption. Current battery-powered models typically require replacement every 2-3 years, creating ongoing maintenance requirements. Durability in harsh baggage handling environments remains problematic, with some early-generation tags proving susceptible to damage from impacts and extreme temperatures. These limitations require continued R&D investment to overcome before mass consumer adoption becomes viable.

Data Privacy and Security Considerations Require Attention

As electronic bag tags collect and transmit passenger data, they introduce new cybersecurity vulnerabilities that must be addressed. Concerns about tracking traveler movements and potential data breaches could create hesitation among privacy-conscious consumers. The industry must establish robust data protection frameworks and clearly communicate security measures to build trust in these connected baggage solutions.

ELECTRONIC BAG TAG MARKET TRENDS

Rising Adoption of Smart Luggage Solutions to Drive Market Growth

The global electronic bag tag market is witnessing significant growth due to increasing passenger traffic and the demand for contactless travel solutions. With air travel rebounding post-pandemic, the need for efficient baggage handling systems has intensified. Electronic bag tags (EBTs) eliminate the need for traditional paper tags by digitally displaying flight and baggage information. Airlines worldwide are increasingly adopting this technology to enhance operational efficiency—cutting check-in times by up to 40% compared to conventional systems. Major airports across North America and Europe now offer EBT-enabled self-service kiosks, accelerating mainstream adoption.

Other Trends

Sustainability and Paperless Travel Initiatives

Environmental concerns are propelling the shift toward paperless baggage handling, with EBTs reducing waste from an estimated 50 million printed tags annually in the aviation sector alone. Policies like the IATA’s Resolution 753, which mandates airlines to track baggage throughout the journey, have further boosted the demand for RFID-enabled reusable tags. Innovations in e-ink display technology have extended battery life to 2+ years, making EBTs economically viable for frequent travelers while aligning with global carbon-neutral initiatives.

Integration with IoT and Mobile Ecosystems

The convergence of EBTs with Internet of Things (IoT) platforms is revolutionizing luggage tracking capabilities. Real-time synchronization with airline apps via Bluetooth Low Energy (BLE) allows passengers to receive push notifications if baggage is mishandled—addressing a pain point that affects 20% of travelers annually. Manufacturers are now embedding GPS in premium tags, enabling passive tracking even outside airport premises. Partnerships between tech firms like Samsung SmartThings and luggage brands highlight the growing emphasis on interconnected smart travel ecosystems, expected to expand the EBT market beyond aviation into rail and cruise sectors.

COMPETITIVE LANDSCAPE

Key Industry Players

Innovation and Strategic Partnerships Drive Market Competition

The global Electronic Bag Tag market exhibits a dynamic competitive landscape, characterized by a mix of established brands and emerging innovators. BAGTAG holds a dominant position in 2024, controlling approximately 22% of the market share, thanks to its early entry into the space and patented e-ink display technology. Their collaboration with major airlines like Lufthansa and Delta has significantly expanded their installed base globally.

Meanwhile, RIMOWA and ViewTa have gained traction through premium product positioning and integration with luxury luggage lines. RIMOWA’s partnership with Lufthansa for their Electronic Tag program has been particularly successful, with over 500,000 units deployed since 2021. ViewTa differentiates through its proprietary energy harvesting technology that eliminates battery replacement.

The market has seen increasing competition from agile startups as well. TeamUC and Bagtap have captured niche segments with ultra-thin form factors targeting business travelers, while OneBagTag has focused on affordability – its sub-$50 price point making it popular in Asian markets. However, durability concerns with budget options present an ongoing challenge for widespread adoption.

Recent months have seen notable strategic moves. In Q2 2024, BAGTAG acquired Groen&Boothman to enhance its European distribution network, while OneBagTag secured $18 million in Series B funding to expand production capacity. Such developments indicate intensifying competition as companies prepare for projected market expansion.

List of Key Electronic Bag Tag Companies Profiled

  • BAGTAG (Netherlands)
  • OneBagTag (Singapore)
  • ViewTa (U.S.)
  • TeamUC (Germany)
  • Bagtap (South Korea)
  • Groen&Boothman (Netherlands)
  • RIMOWA (Germany)

Segment Analysis:

By Type

Battery-Powered Electronic Bag Tags Dominate the Market Due to Wireless Functionality

The market is segmented based on type into:

  • Battery-powered
    • Subtypes: Rechargeable and non-rechargeable batteries
  • No battery (passive)

By Application

Travel Suitcases Lead the Market Due to High Adoption by Frequent Flyers

The market is segmented based on application into:

  • Travel suitcases
  • Backpacks
  • Business luggage
  • Specialty bags (sports equipment, musical instruments)

By Technology

Bluetooth-Enabled Tags Hold Major Share for Seamless Smartphone Connectivity

The market is segmented based on technology into:

  • Bluetooth-enabled
  • NFC-enabled
  • RFID-enabled

By Distribution Channel

Online Sales Channels Growing Rapidly Due to E-Commerce Expansion

The market is segmented based on distribution channel into:

  • Online retail
  • Offline retail
  • Airlines/direct partnerships

Regional Analysis: Electronic Bag Tag Market

North America
The North American Electronic Bag Tag market is currently dominated by the United States, where major airlines like Delta and American Airlines have begun large-scale adoption of this technology. The region benefits from high passenger traffic, with U.S. airports handling over 800 million travelers annually, creating substantial demand for efficient baggage tracking solutions. Strict TSA regulations mandating improved luggage traceability are accelerating adoption, while technological partnerships between airlines and tech firms (e.g., Delta-BAGTAG collaboration since 2016) create market stability. However, consumer reluctance to replace traditional luggage tags and higher product costs ($25-$50 per unit) currently limit penetration to <20% of frequent travelers.

Europe
Europe represents the most mature market for Electronic Bag Tags due to early adoption by IATA member airlines and EU-driven standardization efforts. The region’s leadership stems from Amsterdam’s Schiphol Airport pioneering permanent E-ink bag tags in 2014. Lufthansa, Air France-KLM, and British Airways now offer reusable e-tags across hubs like Frankfurt, Paris CDG, and Heathrow. Key growth drivers include EU Regulation 2018/494 requiring improved baggage tracking by 2025 and environmental sustainability benefits (reducing 35 million paper tags annually). Challenges include Brexit-related regulatory divergence and NFC technology incompatibility between some national carriers.

Asia-Pacific
China, Japan, and Singapore are spearheading Asia’s explosive Electronic Bag Tag market growth, projected to exceed 35% CAGR through 2030. This reflects massive airport expansions (Beijing Daxing, Changi Terminal 5) serving over 3.5 billion regional passengers annually. China’s “Smart Aviation” initiative has driven adoption by China Eastern and Hainan Airlines, while Japanese developers lead in battery-free RFID tag innovation. However, the market faces unique challenges including price sensitivity (only 8% penetration among budget carriers) and infrastructure limitations at secondary airports across India and Southeast Asia.

South America
Electronic Bag Tag adoption in Brazil and Chile shows promising growth (12% CAGR) driven by LATAM Airlines’ modernization programs and Copa Airlines’ regional hub strategy. São Paulo-Guarulhos and Bogotá airports now process 15% of baggage via e-tags, with emphasis on loss prevention in a region where mishandled luggage rates exceed global averages. Market constraints include economic instability impacting airline CAPEX and lower smartphone penetration (68% vs 85% global average) limiting Bluetooth/NFC functionality. Recent Avianca bankruptcy restructuring has temporarily slowed Colombia’s market development.

Middle East & Africa
The region presents a bifurcated market, with Gulf carriers like Emirates and Qatar Airways achieving 40% e-tag penetration at Dubai and Doha hubs through premium passenger offerings. Contrastingly, African adoption remains below 5% outside South Africa due to infrastructure gaps, though Kenya Airways’ recent SkyTeam partnership signals potential growth. The 2023 IATA Global Hub certification of Addis Ababa Airport may drive Ethiopian adoption, while Saudi Arabia’s Vision 2030 includes major baggage system upgrades at Jeddah and Riyadh. Political volatility and lower replacement demand (average luggage replacement cycles are 2x longer than global norms) remain persistent challenges.

Report Scope

This market research report provides a comprehensive analysis of the global and regional Electronic Bag Tag markets, covering the forecast period 2024–2032. It offers detailed insights into market dynamics, technological advancements, competitive landscape, and key trends shaping the industry.

Key focus areas of the report include:

  • Market Size & Forecast: Historical data and future projections for revenue, unit shipments, and market value across major regions and segments. The Global Electronic Bag Tag market was valued at US$ 234 million in 2024 and is projected to reach US$ 456 million by 2032.
  • Segmentation Analysis: Detailed breakdown by product type (battery-powered vs. battery-free), application (travel suitcases, backpacks), and end-user sectors to identify high-growth opportunities.
  • Regional Outlook: Insights into market performance across North America (U.S. market size estimated at USD 42.3 million in 2024), Europe, Asia-Pacific (China projected to reach USD 67.5 million), Latin America, and Middle East & Africa.
  • Competitive Landscape: Profiles of leading market participants including BAGTAG, OneBagTag, ViewTa, TeamUC, and RIMOWA, covering their market share (top five players held approximately 58% revenue share in 2024), product innovations, and strategic initiatives.
  • Technology Trends & Innovation: Assessment of Bluetooth connectivity advancements, e-ink display technologies, and integration with airline baggage handling systems.
  • Market Drivers & Restraints: Evaluation of factors such as rising air passenger traffic, digital transformation in aviation, alongside challenges like high product costs and limited airline adoption.
  • Stakeholder Analysis: Strategic insights for luggage manufacturers, airline operators, technology providers, and investors regarding market entry strategies and partnership opportunities.

The research methodology combines primary interviews with industry experts and analysis of verified market data from airports, airlines, and technology providers to ensure accuracy and reliability.

FREQUENTLY ASKED QUESTIONS:

What is the current market size of Global Electronic Bag Tag Market?

-> Electronic Bag Tag Market size was valued at US$ 234 million in 2024 and is projected to reach US$ 456 million by 2032, at a CAGR of 8.9% during the forecast period 20252032.

Which key companies operate in Global Electronic Bag Tag Market?

-> Key players include BAGTAG, OneBagTag, ViewTa, TeamUC, Bagtap, Groen&Boothman, and RIMOWA, with the top five companies holding approximately 58% market share.

What are the key growth drivers?

-> Key growth drivers include rising air travel demand, digital transformation in aviation, and increasing adoption of smart luggage solutions.

Which region dominates the market?

-> North America currently leads the market (USD 42.3 million in 2024), while Asia-Pacific is the fastest-growing region.

What are the emerging trends?

-> Emerging trends include integration with airline mobile apps, sustainable battery solutions, and RFID-enabled tracking capabilities.

Electronic Bag Tag Market, Trends, Business Strategies 2025-2032

Get Sample Report PDF for Exclusive Insights

Report Sample Includes

  • Table of Contents
  • List of Tables & Figures
  • Charts, Research Methodology, and more...
PDF Icon Download Sample Report PDF

Download Sample Report

Table of Content

1 Introduction to Research & Analysis Reports
1.1 Electronic Bag Tag Market Definition
1.2 Market Segments
1.2.1 Segment by Type
1.2.2 Segment by Application
1.3 Global Electronic Bag Tag Market Overview
1.4 Features & Benefits of This Report
1.5 Methodology & Sources of Information
1.5.1 Research Methodology
1.5.2 Research Process
1.5.3 Base Year
1.5.4 Report Assumptions & Caveats
2 Global Electronic Bag Tag Overall Market Size
2.1 Global Electronic Bag Tag Market Size: 2024 VS 2032
2.2 Global Electronic Bag Tag Market Size, Prospects & Forecasts: 2020-2032
2.3 Global Electronic Bag Tag Sales: 2020-2032
3 Company Landscape
3.1 Top Electronic Bag Tag Players in Global Market
3.2 Top Global Electronic Bag Tag Companies Ranked by Revenue
3.3 Global Electronic Bag Tag Revenue by Companies
3.4 Global Electronic Bag Tag Sales by Companies
3.5 Global Electronic Bag Tag Price by Manufacturer (2020-2025)
3.6 Top 3 and Top 5 Electronic Bag Tag Companies in Global Market, by Revenue in 2024
3.7 Global Manufacturers Electronic Bag Tag Product Type
3.8 Tier 1, Tier 2, and Tier 3 Electronic Bag Tag Players in Global Market
3.8.1 List of Global Tier 1 Electronic Bag Tag Companies
3.8.2 List of Global Tier 2 and Tier 3 Electronic Bag Tag Companies
4 Sights by Product
4.1 Overview
4.1.1 Segment by Type – Global Electronic Bag Tag Market Size Markets, 2024 & 2032
4.1.2 Battery
4.1.3 No Battery
4.2 Segment by Type – Global Electronic Bag Tag Revenue & Forecasts
4.2.1 Segment by Type – Global Electronic Bag Tag Revenue, 2020-2025
4.2.2 Segment by Type – Global Electronic Bag Tag Revenue, 2026-2032
4.2.3 Segment by Type – Global Electronic Bag Tag Revenue Market Share, 2020-2032
4.3 Segment by Type – Global Electronic Bag Tag Sales & Forecasts
4.3.1 Segment by Type – Global Electronic Bag Tag Sales, 2020-2025
4.3.2 Segment by Type – Global Electronic Bag Tag Sales, 2026-2032
4.3.3 Segment by Type – Global Electronic Bag Tag Sales Market Share, 2020-2032
4.4 Segment by Type – Global Electronic Bag Tag Price (Manufacturers Selling Prices), 2020-2032
5 Sights by Application
5.1 Overview
5.1.1 Segment by Application – Global Electronic Bag Tag Market Size, 2024 & 2032
5.1.2 Travel Suitcase
5.1.3 Backpack
5.2 Segment by Application – Global Electronic Bag Tag Revenue & Forecasts
5.2.1 Segment by Application – Global Electronic Bag Tag Revenue, 2020-2025
5.2.2 Segment by Application – Global Electronic Bag Tag Revenue, 2026-2032
5.2.3 Segment by Application – Global Electronic Bag Tag Revenue Market Share, 2020-2032
5.3 Segment by Application – Global Electronic Bag Tag Sales & Forecasts
5.3.1 Segment by Application – Global Electronic Bag Tag Sales, 2020-2025
5.3.2 Segment by Application – Global Electronic Bag Tag Sales, 2026-2032
5.3.3 Segment by Application – Global Electronic Bag Tag Sales Market Share, 2020-2032
5.4 Segment by Application – Global Electronic Bag Tag Price (Manufacturers Selling Prices), 2020-2032
6 Sights by Region
6.1 By Region – Global Electronic Bag Tag Market Size, 2024 & 2032
6.2 By Region – Global Electronic Bag Tag Revenue & Forecasts
6.2.1 By Region – Global Electronic Bag Tag Revenue, 2020-2025
6.2.2 By Region – Global Electronic Bag Tag Revenue, 2026-2032
6.2.3 By Region – Global Electronic Bag Tag Revenue Market Share, 2020-2032
6.3 By Region – Global Electronic Bag Tag Sales & Forecasts
6.3.1 By Region – Global Electronic Bag Tag Sales, 2020-2025
6.3.2 By Region – Global Electronic Bag Tag Sales, 2026-2032
6.3.3 By Region – Global Electronic Bag Tag Sales Market Share, 2020-2032
6.4 North America
6.4.1 By Country – North America Electronic Bag Tag Revenue, 2020-2032
6.4.2 By Country – North America Electronic Bag Tag Sales, 2020-2032
6.4.3 United States Electronic Bag Tag Market Size, 2020-2032
6.4.4 Canada Electronic Bag Tag Market Size, 2020-2032
6.4.5 Mexico Electronic Bag Tag Market Size, 2020-2032
6.5 Europe
6.5.1 By Country – Europe Electronic Bag Tag Revenue, 2020-2032
6.5.2 By Country – Europe Electronic Bag Tag Sales, 2020-2032
6.5.3 Germany Electronic Bag Tag Market Size, 2020-2032
6.5.4 France Electronic Bag Tag Market Size, 2020-2032
6.5.5 U.K. Electronic Bag Tag Market Size, 2020-2032
6.5.6 Italy Electronic Bag Tag Market Size, 2020-2032
6.5.7 Russia Electronic Bag Tag Market Size, 2020-2032
6.5.8 Nordic Countries Electronic Bag Tag Market Size, 2020-2032
6.5.9 Benelux Electronic Bag Tag Market Size, 2020-2032
6.6 Asia
6.6.1 By Region – Asia Electronic Bag Tag Revenue, 2020-2032
6.6.2 By Region – Asia Electronic Bag Tag Sales, 2020-2032
6.6.3 China Electronic Bag Tag Market Size, 2020-2032
6.6.4 Japan Electronic Bag Tag Market Size, 2020-2032
6.6.5 South Korea Electronic Bag Tag Market Size, 2020-2032
6.6.6 Southeast Asia Electronic Bag Tag Market Size, 2020-2032
6.6.7 India Electronic Bag Tag Market Size, 2020-2032
6.7 South America
6.7.1 By Country – South America Electronic Bag Tag Revenue, 2020-2032
6.7.2 By Country – South America Electronic Bag Tag Sales, 2020-2032
6.7.3 Brazil Electronic Bag Tag Market Size, 2020-2032
6.7.4 Argentina Electronic Bag Tag Market Size, 2020-2032
6.8 Middle East & Africa
6.8.1 By Country – Middle East & Africa Electronic Bag Tag Revenue, 2020-2032
6.8.2 By Country – Middle East & Africa Electronic Bag Tag Sales, 2020-2032
6.8.3 Turkey Electronic Bag Tag Market Size, 2020-2032
6.8.4 Israel Electronic Bag Tag Market Size, 2020-2032
6.8.5 Saudi Arabia Electronic Bag Tag Market Size, 2020-2032
6.8.6 UAE Electronic Bag Tag Market Size, 2020-2032
7 Manufacturers & Brands Profiles
7.1 BAGTAG
7.1.1 BAGTAG Company Summary
7.1.2 BAGTAG Business Overview
7.1.3 BAGTAG Electronic Bag Tag Major Product Offerings
7.1.4 BAGTAG Electronic Bag Tag Sales and Revenue in Global (2020-2025)
7.1.5 BAGTAG Key News & Latest Developments
7.2 OneBagTag
7.2.1 OneBagTag Company Summary
7.2.2 OneBagTag Business Overview
7.2.3 OneBagTag Electronic Bag Tag Major Product Offerings
7.2.4 OneBagTag Electronic Bag Tag Sales and Revenue in Global (2020-2025)
7.2.5 OneBagTag Key News & Latest Developments
7.3 ViewTa
7.3.1 ViewTa Company Summary
7.3.2 ViewTa Business Overview
7.3.3 ViewTa Electronic Bag Tag Major Product Offerings
7.3.4 ViewTa Electronic Bag Tag Sales and Revenue in Global (2020-2025)
7.3.5 ViewTa Key News & Latest Developments
7.4 TeamUC
7.4.1 TeamUC Company Summary
7.4.2 TeamUC Business Overview
7.4.3 TeamUC Electronic Bag Tag Major Product Offerings
7.4.4 TeamUC Electronic Bag Tag Sales and Revenue in Global (2020-2025)
7.4.5 TeamUC Key News & Latest Developments
7.5 Bagtap
7.5.1 Bagtap Company Summary
7.5.2 Bagtap Business Overview
7.5.3 Bagtap Electronic Bag Tag Major Product Offerings
7.5.4 Bagtap Electronic Bag Tag Sales and Revenue in Global (2020-2025)
7.5.5 Bagtap Key News & Latest Developments
7.6 Groen&Boothman
7.6.1 Groen&Boothman Company Summary
7.6.2 Groen&Boothman Business Overview
7.6.3 Groen&Boothman Electronic Bag Tag Major Product Offerings
7.6.4 Groen&Boothman Electronic Bag Tag Sales and Revenue in Global (2020-2025)
7.6.5 Groen&Boothman Key News & Latest Developments
7.7 RIMOWA
7.7.1 RIMOWA Company Summary
7.7.2 RIMOWA Business Overview
7.7.3 RIMOWA Electronic Bag Tag Major Product Offerings
7.7.4 RIMOWA Electronic Bag Tag Sales and Revenue in Global (2020-2025)
7.7.5 RIMOWA Key News & Latest Developments
8 Global Electronic Bag Tag Production Capacity, Analysis
8.1 Global Electronic Bag Tag Production Capacity, 2020-2032
8.2 Electronic Bag Tag Production Capacity of Key Manufacturers in Global Market
8.3 Global Electronic Bag Tag Production by Region
9 Key Market Trends, Opportunity, Drivers and Restraints
9.1 Market Opportunities & Trends
9.2 Market Drivers
9.3 Market Restraints
10 Electronic Bag Tag Supply Chain Analysis
10.1 Electronic Bag Tag Industry Value Chain
10.2 Electronic Bag Tag Upstream Market
10.3 Electronic Bag Tag Downstream and Clients
10.4 Marketing Channels Analysis
10.4.1 Marketing Channels
10.4.2 Electronic Bag Tag Distributors and Sales Agents in Global
11 Conclusion
12 Appendix
12.1 Note
12.2 Examples of Clients
12.3 DisclaimerList of Tables
Table 1. Key Players of Electronic Bag Tag in Global Market
Table 2. Top Electronic Bag Tag Players in Global Market, Ranking by Revenue (2024)
Table 3. Global Electronic Bag Tag Revenue by Companies, (US$, Mn), 2020-2025
Table 4. Global Electronic Bag Tag Revenue Share by Companies, 2020-2025
Table 5. Global Electronic Bag Tag Sales by Companies, (M Units), 2020-2025
Table 6. Global Electronic Bag Tag Sales Share by Companies, 2020-2025
Table 7. Key Manufacturers Electronic Bag Tag Price (2020-2025) & (US$/K Unit)
Table 8. Global Manufacturers Electronic Bag Tag Product Type
Table 9. List of Global Tier 1 Electronic Bag Tag Companies, Revenue (US$, Mn) in 2024 and Market Share
Table 10. List of Global Tier 2 and Tier 3 Electronic Bag Tag Companies, Revenue (US$, Mn) in 2024 and Market Share
Table 11. Segment by Type – Global Electronic Bag Tag Revenue, (US$, Mn), 2024 & 2032
Table 12. Segment by Type – Global Electronic Bag Tag Revenue (US$, Mn), 2020-2025
Table 13. Segment by Type – Global Electronic Bag Tag Revenue (US$, Mn), 2026-2032
Table 14. Segment by Type – Global Electronic Bag Tag Sales (M Units), 2020-2025
Table 15. Segment by Type – Global Electronic Bag Tag Sales (M Units), 2026-2032
Table 16. Segment by Application – Global Electronic Bag Tag Revenue, (US$, Mn), 2024 & 2032
Table 17. Segment by Application – Global Electronic Bag Tag Revenue, (US$, Mn), 2020-2025
Table 18. Segment by Application – Global Electronic Bag Tag Revenue, (US$, Mn), 2026-2032
Table 19. Segment by Application – Global Electronic Bag Tag Sales, (M Units), 2020-2025
Table 20. Segment by Application – Global Electronic Bag Tag Sales, (M Units), 2026-2032
Table 21. By Region – Global Electronic Bag Tag Revenue, (US$, Mn), 2025-2032
Table 22. By Region – Global Electronic Bag Tag Revenue, (US$, Mn), 2020-2025
Table 23. By Region – Global Electronic Bag Tag Revenue, (US$, Mn), 2026-2032
Table 24. By Region – Global Electronic Bag Tag Sales, (M Units), 2020-2025
Table 25. By Region – Global Electronic Bag Tag Sales, (M Units), 2026-2032
Table 26. By Country – North America Electronic Bag Tag Revenue, (US$, Mn), 2020-2025
Table 27. By Country – North America Electronic Bag Tag Revenue, (US$, Mn), 2026-2032
Table 28. By Country – North America Electronic Bag Tag Sales, (M Units), 2020-2025
Table 29. By Country – North America Electronic Bag Tag Sales, (M Units), 2026-2032
Table 30. By Country – Europe Electronic Bag Tag Revenue, (US$, Mn), 2020-2025
Table 31. By Country – Europe Electronic Bag Tag Revenue, (US$, Mn), 2026-2032
Table 32. By Country – Europe Electronic Bag Tag Sales, (M Units), 2020-2025
Table 33. By Country – Europe Electronic Bag Tag Sales, (M Units), 2026-2032
Table 34. By Region – Asia Electronic Bag Tag Revenue, (US$, Mn), 2020-2025
Table 35. By Region – Asia Electronic Bag Tag Revenue, (US$, Mn), 2026-2032
Table 36. By Region – Asia Electronic Bag Tag Sales, (M Units), 2020-2025
Table 37. By Region – Asia Electronic Bag Tag Sales, (M Units), 2026-2032
Table 38. By Country – South America Electronic Bag Tag Revenue, (US$, Mn), 2020-2025
Table 39. By Country – South America Electronic Bag Tag Revenue, (US$, Mn), 2026-2032
Table 40. By Country – South America Electronic Bag Tag Sales, (M Units), 2020-2025
Table 41. By Country – South America Electronic Bag Tag Sales, (M Units), 2026-2032
Table 42. By Country – Middle East & Africa Electronic Bag Tag Revenue, (US$, Mn), 2020-2025
Table 43. By Country – Middle East & Africa Electronic Bag Tag Revenue, (US$, Mn), 2026-2032
Table 44. By Country – Middle East & Africa Electronic Bag Tag Sales, (M Units), 2020-2025
Table 45. By Country – Middle East & Africa Electronic Bag Tag Sales, (M Units), 2026-2032
Table 46. BAGTAG Company Summary
Table 47. BAGTAG Electronic Bag Tag Product Offerings
Table 48. BAGTAG Electronic Bag Tag Sales (M Units), Revenue (US$, Mn) and Average Price (US$/K Unit) & (2020-2025)
Table 49. BAGTAG Key News & Latest Developments
Table 50. OneBagTag Company Summary
Table 51. OneBagTag Electronic Bag Tag Product Offerings
Table 52. OneBagTag Electronic Bag Tag Sales (M Units), Revenue (US$, Mn) and Average Price (US$/K Unit) & (2020-2025)
Table 53. OneBagTag Key News & Latest Developments
Table 54. ViewTa Company Summary
Table 55. ViewTa Electronic Bag Tag Product Offerings
Table 56. ViewTa Electronic Bag Tag Sales (M Units), Revenue (US$, Mn) and Average Price (US$/K Unit) & (2020-2025)
Table 57. ViewTa Key News & Latest Developments
Table 58. TeamUC Company Summary
Table 59. TeamUC Electronic Bag Tag Product Offerings
Table 60. TeamUC Electronic Bag Tag Sales (M Units), Revenue (US$, Mn) and Average Price (US$/K Unit) & (2020-2025)
Table 61. TeamUC Key News & Latest Developments
Table 62. Bagtap Company Summary
Table 63. Bagtap Electronic Bag Tag Product Offerings
Table 64. Bagtap Electronic Bag Tag Sales (M Units), Revenue (US$, Mn) and Average Price (US$/K Unit) & (2020-2025)
Table 65. Bagtap Key News & Latest Developments
Table 66. Groen&Boothman Company Summary
Table 67. Groen&Boothman Electronic Bag Tag Product Offerings
Table 68. Groen&Boothman Electronic Bag Tag Sales (M Units), Revenue (US$, Mn) and Average Price (US$/K Unit) & (2020-2025)
Table 69. Groen&Boothman Key News & Latest Developments
Table 70. RIMOWA Company Summary
Table 71. RIMOWA Electronic Bag Tag Product Offerings
Table 72. RIMOWA Electronic Bag Tag Sales (M Units), Revenue (US$, Mn) and Average Price (US$/K Unit) & (2020-2025)
Table 73. RIMOWA Key News & Latest Developments
Table 74. Electronic Bag Tag Capacity of Key Manufacturers in Global Market, 2023-2025 (M Units)
Table 75. Global Electronic Bag Tag Capacity Market Share of Key Manufacturers, 2023-2025
Table 76. Global Electronic Bag Tag Production by Region, 2020-2025 (M Units)
Table 77. Global Electronic Bag Tag Production by Region, 2026-2032 (M Units)
Table 78. Electronic Bag Tag Market Opportunities & Trends in Global Market
Table 79. Electronic Bag Tag Market Drivers in Global Market
Table 80. Electronic Bag Tag Market Restraints in Global Market
Table 81. Electronic Bag Tag Raw Materials
Table 82. Electronic Bag Tag Raw Materials Suppliers in Global Market
Table 83. Typical Electronic Bag Tag Downstream
Table 84. Electronic Bag Tag Downstream Clients in Global Market
Table 85. Electronic Bag Tag Distributors and Sales Agents in Global Market

List of Figures
Figure 1. Electronic Bag Tag Product Picture
Figure 2. Electronic Bag Tag Segment by Type in 2024
Figure 3. Electronic Bag Tag Segment by Application in 2024
Figure 4. Global Electronic Bag Tag Market Overview: 2024
Figure 5. Key Caveats
Figure 6. Global Electronic Bag Tag Market Size: 2024 VS 2032 (US$, Mn)
Figure 7. Global Electronic Bag Tag Revenue: 2020-2032 (US$, Mn)
Figure 8. Electronic Bag Tag Sales in Global Market: 2020-2032 (M Units)
Figure 9. The Top 3 and 5 Players Market Share by Electronic Bag Tag Revenue in 2024
Figure 10. Segment by Type – Global Electronic Bag Tag Revenue, (US$, Mn), 2024 & 2032
Figure 11. Segment by Type – Global Electronic Bag Tag Revenue Market Share, 2020-2032
Figure 12. Segment by Type – Global Electronic Bag Tag Sales Market Share, 2020-2032
Figure 13. Segment by Type – Global Electronic Bag Tag Price (US$/K Unit), 2020-2032
Figure 14. Segment by Application – Global Electronic Bag Tag Revenue, (US$, Mn), 2024 & 2032
Figure 15. Segment by Application – Global Electronic Bag Tag Revenue Market Share, 2020-2032
Figure 16. Segment by Application – Global Electronic Bag Tag Sales Market Share, 2020-2032
Figure 17. Segment by Application -Global Electronic Bag Tag Price (US$/K Unit), 2020-2032
Figure 18. By Region – Global Electronic Bag Tag Revenue, (US$, Mn), 2025 & 2032
Figure 19. By Region – Global Electronic Bag Tag Revenue Market Share, 2020 VS 2024 VS 2032
Figure 20. By Region – Global Electronic Bag Tag Revenue Market Share, 2020-2032
Figure 21. By Region – Global Electronic Bag Tag Sales Market Share, 2020-2032
Figure 22. By Country – North America Electronic Bag Tag Revenue Market Share, 2020-2032
Figure 23. By Country – North America Electronic Bag Tag Sales Market Share, 2020-2032
Figure 24. United States Electronic Bag Tag Revenue, (US$, Mn), 2020-2032
Figure 25. Canada Electronic Bag Tag Revenue, (US$, Mn), 2020-2032
Figure 26. Mexico Electronic Bag Tag Revenue, (US$, Mn), 2020-2032
Figure 27. By Country – Europe Electronic Bag Tag Revenue Market Share, 2020-2032
Figure 28. By Country – Europe Electronic Bag Tag Sales Market Share, 2020-2032
Figure 29. Germany Electronic Bag Tag Revenue, (US$, Mn), 2020-2032
Figure 30. France Electronic Bag Tag Revenue, (US$, Mn), 2020-2032
Figure 31. U.K. Electronic Bag Tag Revenue, (US$, Mn), 2020-2032
Figure 32. Italy Electronic Bag Tag Revenue, (US$, Mn), 2020-2032
Figure 33. Russia Electronic Bag Tag Revenue, (US$, Mn), 2020-2032
Figure 34. Nordic Countries Electronic Bag Tag Revenue, (US$, Mn), 2020-2032
Figure 35. Benelux Electronic Bag Tag Revenue, (US$, Mn), 2020-2032
Figure 36. By Region – Asia Electronic Bag Tag Revenue Market Share, 2020-2032
Figure 37. By Region – Asia Electronic Bag Tag Sales Market Share, 2020-2032
Figure 38. China Electronic Bag Tag Revenue, (US$, Mn), 2020-2032
Figure 39. Japan Electronic Bag Tag Revenue, (US$, Mn), 2020-2032
Figure 40. South Korea Electronic Bag Tag Revenue, (US$, Mn), 2020-2032
Figure 41. Southeast Asia Electronic Bag Tag Revenue, (US$, Mn), 2020-2032
Figure 42. India Electronic Bag Tag Revenue, (US$, Mn), 2020-2032
Figure 43. By Country – South America Electronic Bag Tag Revenue Market Share, 2020-2032
Figure 44. By Country – South America Electronic Bag Tag Sales, Market Share, 2020-2032
Figure 45. Brazil Electronic Bag Tag Revenue, (US$, Mn), 2020-2032
Figure 46. Argentina Electronic Bag Tag Revenue, (US$, Mn), 2020-2032
Figure 47. By Country – Middle East & Africa Electronic Bag Tag Revenue, Market Share, 2020-2032
Figure 48. By Country – Middle East & Africa Electronic Bag Tag Sales, Market Share, 2020-2032
Figure 49. Turkey Electronic Bag Tag Revenue, (US$, Mn), 2020-2032
Figure 50. Israel Electronic Bag Tag Revenue, (US$, Mn), 2020-2032
Figure 51. Saudi Arabia Electronic Bag Tag Revenue, (US$, Mn), 2020-2032
Figure 52. UAE Electronic Bag Tag Revenue, (US$, Mn), 2020-2032
Figure 53. Global Electronic Bag Tag Production Capacity (M Units), 2020-2032
Figure 54. The Percentage of Production Electronic Bag Tag by Region, 2024 VS 2032
Figure 55. Electronic Bag Tag Industry Value Chain
Figure 56. Marketing Channels