E-Paper Technology Market Trends, Business Strategies 2025-2032

Global E-Paper Technology market size was estimated at USD 879 million in 2023 and is projected to reach USD 3190.37 million by 2032, exhibiting a CAGR of 15.40% during the forecast period.

PDF Icon Download Sample Report PDF
  • Quick Dispatch

    All Orders

  • Secure Payment

    100% Secure Payment

Compare

$1,500.00$4,250.00

Clear

E-Paper Technology Market Overview

E-paper, which is also known as electronic paper, electronic ink, or e-ink, is a display technology applied to electronic devices, designed to mimic the appearance of traditional or ordinary ink on paper. E-paper is a special type of display that does not emit light or require electricity to create images like LCD or LED displays. Unlike these traditional displays, e-paper displays reflect light just like ordinary paper does. This makes the e-paper easier on the eyes of the reader, as there are no glares or light reflections. This also makes it more readable in various lighting conditions, whether it be bright sunlight or dim lighting.

This report provides a deep insight into the global E-Paper Technology market covering all its essential aspects. This ranges from a macro overview of the market to micro details of the market size, competitive landscape, development trend, niche market, key market drivers and challenges, SWOT analysis, value chain analysis, etc.

The analysis helps the reader to shape the competition within the industries and strategies for the competitive environment to enhance the potential profit. Furthermore, it provides a simple framework for evaluating and accessing the position of the business organization. The report structure also focuses on the competitive landscape of the Global E-Paper Technology Market, this report introduces in detail the market share, market performance, product situation, operation situation, etc. of the main players, which helps the readers in the industry to identify the main competitors and deeply understand the competition pattern of the market.
In a word, this report is a must-read for industry players, investors, researchers, consultants, business strategists, and all those who have any kind of stake or are planning to foray into the E-Paper Technology market in any manner.

E-Paper Technology Market Analysis:

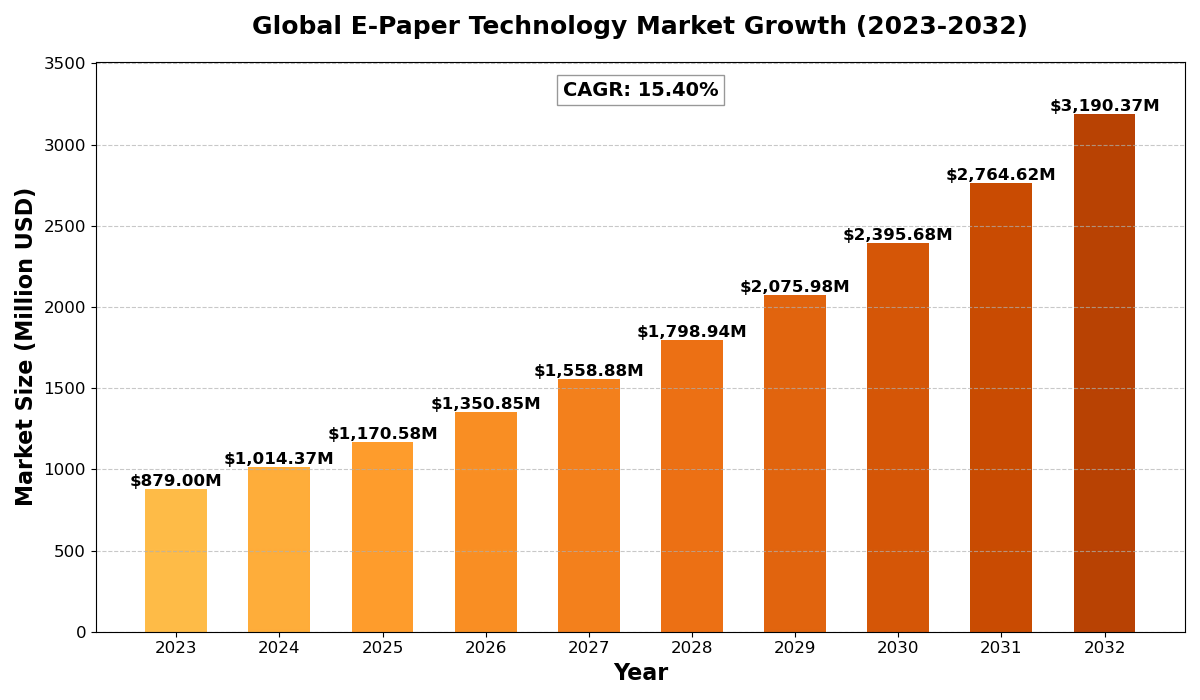
The global E-Paper Technology market size was estimated at USD 879 million in 2023 and is projected to reach USD 3190.37 million by 2032, exhibiting a CAGR of 15.40% during the forecast period.

North America E-Paper Technology market size was estimated at USD 293.50 million in 2023, at a CAGR of 13.20% during the forecast period of 2025 through 2032.

E-Paper Technology Key Market Trends  

  1. Rising Adoption in Retail and Signage
    E-paper displays are increasingly used in retail stores and public signage due to their low power consumption and high visibility in various lighting conditions.
  2. Growth of E-Readers and E-Notebooks
    The popularity of e-readers and e-notebooks continues to rise, with consumers favoring their eye-friendly and battery-efficient displays.
  3. Integration with IoT Devices
    E-paper screens are being integrated into IoT devices for smart labels, wearables, and home automation systems, enhancing user interfaces and reducing energy usage.
  4. Advancements in Color E-Paper Displays
    Developments in color e-paper technology are expanding its application range, offering more vibrant and dynamic display options.
  5. Sustainability and Eco-Friendly Solutions
    E-paper’s low energy requirements and recyclable materials make it a popular choice for environmentally conscious consumers and businesses.

E-Paper Technology Market Regional Analysis :

semi insight

  • North America:Strong demand driven by EVs, 5G infrastructure, and renewable energy, with the U.S. leading the market.
  • Europe:Growth fueled by automotive electrification, renewable energy, and strong regulatory support, with Germany as a key player.
  • Asia-Pacific:Dominates the market due to large-scale manufacturing in China and Japan, with growing demand from EVs, 5G, and semiconductors.
  • South America:Emerging market, driven by renewable energy and EV adoption, with Brazil leading growth.
  • Middle East & Africa:Gradual growth, mainly due to investments in renewable energy and EV infrastructure, with Saudi Arabia and UAE as key contributors.

E-Paper Technology Market Segmentation

The research report includes specific segments by region (country), manufacturers, Type, and Application. Market segmentation creates subsets of a market based on product type, end-user or application, Geographic, and other factors. By understanding the market segments, the decision-maker can leverage this targeting in the product, sales, and marketing strategies. Market segments can power your product development cycles by informing how you create product offerings for different segments.

Key Company

  • E Ink Holdings Incorporated
  • Pervisive Displays
  • Seekink
  • Tianma Microelectronics Co.,Ltd.
  • Samsung
  • Shenzhen Laibao Hi-tech Co.,Ltd.
  • Admiral Overseas Corporation
  • Refond
  • Market Segmentation (by Type)
  • E-Reader
  • Electronic Shelf Label
  • Wearable Devices
  • Signage
  • Others

Market Segmentation (by Application)

  • Public Transport
  • Advertising
  • Others

Drivers

  • Energy Efficiency and Low Power Consumption
    E-paper displays consume significantly less power than traditional screens, making them ideal for battery-operated devices.
  • Increasing Demand for E-Readers and Digital Signage
    The growing popularity of e-readers and digital signage solutions is boosting the e-paper market.
  • Expanding Applications Across Industries
    E-paper technology is finding new uses in logistics, healthcare, retail, and education sectors.

Restraints

  • Limited Color and Refresh Rate
    Traditional e-paper displays struggle with color reproduction and fast refresh rates compared to LCDs and OLEDs.
  • High Initial Costs
    The development and integration of e-paper technology can be costly, limiting adoption in price-sensitive markets.
  • Competition from Advanced Display Technologies
    Alternatives like OLED and LCD offer superior color and motion capabilities, challenging e-paper adoption.

Opportunities

  • Expansion in Smart Packaging and Labels
    The rise of smart packaging and electronic shelf labels presents new opportunities for e-paper applications.
  • Advancements in Flexible and Rollable Displays
    Innovations in flexible e-paper displays could open up new markets in wearables and foldable electronics.
  • Growing Focus on Sustainable Solutions
    Increasing emphasis on eco-friendly technologies boosts the demand for energy-efficient e-paper products.

Challenges

  • Technological Limitations
    Enhancing color display capabilities and improving refresh rates remain key challenges for e-paper developers.
  • Market Awareness and Adoption
    Limited consumer awareness about the benefits of e-paper technology can hinder widespread adoption.
  • Integration Complexities
    Incorporating e-paper displays into diverse devices requires complex design and engineering solutions.

Key Benefits of This Market Research:

  • Industry drivers, restraints, and opportunities covered in the study
  • Neutral perspective on the market performance
  • Recent industry trends and developments
  • Competitive landscape & strategies of key players
  • Potential & niche segments and regions exhibiting promising growth covered
  • Historical, current, and projected market size, in terms of value
  • In-depth analysis of the E-Paper Technology Market
  • Overview of the regional outlook of the E-Paper Technology Market:

Key Reasons to Buy this Report:

  • Access to date statistics compiled by our researchers. These provide you with historical and forecast data, which is analyzed to tell you why your market is set to change
  • This enables you to anticipate market changes to remain ahead of your competitors
  • You will be able to copy data from the Excel spreadsheet straight into your marketing plans, business presentations, or other strategic documents
  • The concise analysis, clear graph, and table format will enable you to pinpoint the information you require quickly
  • Provision of market value data for each segment and sub-segment
  • Indicates the region and segment that is expected to witness the fastest growth as well as to dominate the market
  • Provides insight into the market through Value Chain
  • Market dynamics scenario, along with growth opportunities of the market in the years to come
  • 6-month post-sales analyst support

Customization of the Report
In case of any queries or customization requirements, please connect with our sales team, who will ensure that your requirements are met.

FAQs

Q: What are the key driving factors and opportunities in the global E-Paper Technology market?
A: Key drivers include energy efficiency, growing demand for e-readers, and expanding applications. Opportunities lie in smart packaging, flexible displays, and sustainable solutions.


Q: Which region is projected to have the largest market share?
A: North America is expected to lead the market due to strong demand for e-readers, digital signage, and advancements in e-paper technologies.


Q: Who are the top players in the global E-Paper Technology market?
A: Leading companies include E Ink Holdings, Pervasive Displays, CLEARink Displays, Plastic Logic, and LG Display.


Q: What are the latest technological advancements in the industry?
A: Innovations include color e-paper displays, flexible and rollable screens, and integration with IoT devices for enhanced user interfaces.


Q: What is the current size of the global E-Paper Technology market?
A: The market is projected to experience significant growth from 2025 to 2032, driven by rising demand for energy-efficient and versatile display solutions.


E-Paper Technology Market Trends, Business Strategies 2025-2032

Get Sample Report PDF for Exclusive Insights

Report Sample Includes

  • Table of Contents
  • List of Tables & Figures
  • Charts, Research Methodology, and more...
PDF Icon Download Sample Report PDF

Download Sample Report

Table of Content

Table of Contents
1 Research Methodology and Statistical Scope
1.1 Market Definition and Statistical Scope of E-Paper Technology
1.2 Key Market Segments
1.2.1 E-Paper Technology Segment by Type
1.2.2 E-Paper Technology Segment by Application
1.3 Methodology & Sources of Information
1.3.1 Research Methodology
1.3.2 Research Process
1.3.3 Market Breakdown and Data Triangulation
1.3.4 Base Year
1.3.5 Report Assumptions & Caveats
2 E-Paper Technology Market Overview
2.1 Global Market Overview
2.1.1 Global E-Paper Technology Market Size (M USD) Estimates and Forecasts (2019-2032)
2.1.2 Global E-Paper Technology Sales Estimates and Forecasts (2019-2032)
2.2 Market Segment Executive Summary
2.3 Global Market Size by Region
3 E-Paper Technology Market Competitive Landscape
3.1 Global E-Paper Technology Sales by Manufacturers (2019-2025)
3.2 Global E-Paper Technology Revenue Market Share by Manufacturers (2019-2025)
3.3 E-Paper Technology Market Share by Company Type (Tier 1, Tier 2, and Tier 3)
3.4 Global E-Paper Technology Average Price by Manufacturers (2019-2025)
3.5 Manufacturers E-Paper Technology Sales Sites, Area Served, Product Type
3.6 E-Paper Technology Market Competitive Situation and Trends
3.6.1 E-Paper Technology Market Concentration Rate
3.6.2 Global 5 and 10 Largest E-Paper Technology Players Market Share by Revenue
3.6.3 Mergers & Acquisitions, Expansion
4 E-Paper Technology Industry Chain Analysis
4.1 E-Paper Technology Industry Chain Analysis
4.2 Market Overview of Key Raw Materials
4.3 Midstream Market Analysis
4.4 Downstream Customer Analysis
5 The Development and Dynamics of E-Paper Technology Market
5.1 Key Development Trends
5.2 Driving Factors
5.3 Market Challenges
5.4 Market Restraints
5.5 Industry News
5.5.1 New Product Developments
5.5.2 Mergers & Acquisitions
5.5.3 Expansions
5.5.4 Collaboration/Supply Contracts
5.6 Industry Policies
6 E-Paper Technology Market Segmentation by Type
6.1 Evaluation Matrix of Segment Market Development Potential (Type)
6.2 Global E-Paper Technology Sales Market Share by Type (2019-2025)
6.3 Global E-Paper Technology Market Size Market Share by Type (2019-2025)
6.4 Global E-Paper Technology Price by Type (2019-2025)
7 E-Paper Technology Market Segmentation by Application
7.1 Evaluation Matrix of Segment Market Development Potential (Application)
7.2 Global E-Paper Technology Market Sales by Application (2019-2025)
7.3 Global E-Paper Technology Market Size (M USD) by Application (2019-2025)
7.4 Global E-Paper Technology Sales Growth Rate by Application (2019-2025)
8 E-Paper Technology Market Consumption by Region
8.1 Global E-Paper Technology Sales by Region
8.1.1 Global E-Paper Technology Sales by Region
8.1.2 Global E-Paper Technology Sales Market Share by Region
8.2 North America
8.2.1 North America E-Paper Technology Sales by Country
8.2.2 U.S.
8.2.3 Canada
8.2.4 Mexico
8.3 Europe
8.3.1 Europe E-Paper Technology Sales by Country
8.3.2 Germany
8.3.3 France
8.3.4 U.K.
8.3.5 Italy
8.3.6 Russia
8.4 Asia Pacific
8.4.1 Asia Pacific E-Paper Technology Sales by Region
8.4.2 China
8.4.3 Japan
8.4.4 South Korea
8.4.5 India
8.4.6 Southeast Asia
8.5 South America
8.5.1 South America E-Paper Technology Sales by Country
8.5.2 Brazil
8.5.3 Argentina
8.5.4 Columbia
8.6 Middle East and Africa
8.6.1 Middle East and Africa E-Paper Technology Sales by Region
8.6.2 Saudi Arabia
8.6.3 UAE
8.6.4 Egypt
8.6.5 Nigeria
8.6.6 South Africa
9 E-Paper Technology Market Production by Region
9.1 Global Production of E-Paper Technology by Region (2019-2025)
9.2 Global E-Paper Technology Revenue Market Share by Region (2019-2025)
9.3 Global E-Paper Technology Production, Revenue, Price and Gross Margin (2019-2025)
9.4 North America E-Paper Technology Production
9.4.1 North America E-Paper Technology Production Growth Rate (2019-2025)
9.4.2 North America E-Paper Technology Production, Revenue, Price and Gross Margin (2019-2025)
9.5 Europe E-Paper Technology Production
9.5.1 Europe E-Paper Technology Production Growth Rate (2019-2025)
9.5.2 Europe E-Paper Technology Production, Revenue, Price and Gross Margin (2019-2025)
9.6 Japan E-Paper Technology Production (2019-2025)
9.6.1 Japan E-Paper Technology Production Growth Rate (2019-2025)
9.6.2 Japan E-Paper Technology Production, Revenue, Price and Gross Margin (2019-2025)
9.7 China E-Paper Technology Production (2019-2025)
9.7.1 China E-Paper Technology Production Growth Rate (2019-2025)
9.7.2 China E-Paper Technology Production, Revenue, Price and Gross Margin (2019-2025)
10 Key Companies Profile
10.1 E Ink Holdings Incorporated
10.1.1 E Ink Holdings Incorporated E-Paper Technology Basic Information
10.1.2 E Ink Holdings Incorporated E-Paper Technology Product Overview
10.1.3 E Ink Holdings Incorporated E-Paper Technology Product Market Performance
10.1.4 E Ink Holdings Incorporated Business Overview
10.1.5 E Ink Holdings Incorporated E-Paper Technology SWOT Analysis
10.1.6 E Ink Holdings Incorporated Recent Developments
10.2 Pervisive Displays
10.2.1 Pervisive Displays E-Paper Technology Basic Information
10.2.2 Pervisive Displays E-Paper Technology Product Overview
10.2.3 Pervisive Displays E-Paper Technology Product Market Performance
10.2.4 Pervisive Displays Business Overview
10.2.5 Pervisive Displays E-Paper Technology SWOT Analysis
10.2.6 Pervisive Displays Recent Developments
10.3 Seekink
10.3.1 Seekink E-Paper Technology Basic Information
10.3.2 Seekink E-Paper Technology Product Overview
10.3.3 Seekink E-Paper Technology Product Market Performance
10.3.4 Seekink E-Paper Technology SWOT Analysis
10.3.5 Seekink Business Overview
10.3.6 Seekink Recent Developments
10.4 Tianma Microelectronics Co.,Ltd.
10.4.1 Tianma Microelectronics Co.,Ltd. E-Paper Technology Basic Information
10.4.2 Tianma Microelectronics Co.,Ltd. E-Paper Technology Product Overview
10.4.3 Tianma Microelectronics Co.,Ltd. E-Paper Technology Product Market Performance
10.4.4 Tianma Microelectronics Co.,Ltd. Business Overview
10.4.5 Tianma Microelectronics Co.,Ltd. Recent Developments
10.5 Samsung
10.5.1 Samsung E-Paper Technology Basic Information
10.5.2 Samsung E-Paper Technology Product Overview
10.5.3 Samsung E-Paper Technology Product Market Performance
10.5.4 Samsung Business Overview
10.5.5 Samsung Recent Developments
10.6 Shenzhen Laibao Hi-tech Co.,Ltd.
10.6.1 Shenzhen Laibao Hi-tech Co.,Ltd. E-Paper Technology Basic Information
10.6.2 Shenzhen Laibao Hi-tech Co.,Ltd. E-Paper Technology Product Overview
10.6.3 Shenzhen Laibao Hi-tech Co.,Ltd. E-Paper Technology Product Market Performance
10.6.4 Shenzhen Laibao Hi-tech Co.,Ltd. Business Overview
10.6.5 Shenzhen Laibao Hi-tech Co.,Ltd. Recent Developments
10.7 Admiral Overseas Corporation
10.7.1 Admiral Overseas Corporation E-Paper Technology Basic Information
10.7.2 Admiral Overseas Corporation E-Paper Technology Product Overview
10.7.3 Admiral Overseas Corporation E-Paper Technology Product Market Performance
10.7.4 Admiral Overseas Corporation Business Overview
10.7.5 Admiral Overseas Corporation Recent Developments
10.8 Refond
10.8.1 Refond E-Paper Technology Basic Information
10.8.2 Refond E-Paper Technology Product Overview
10.8.3 Refond E-Paper Technology Product Market Performance
10.8.4 Refond Business Overview
10.8.5 Refond Recent Developments
11 E-Paper Technology Market Forecast by Region
11.1 Global E-Paper Technology Market Size Forecast
11.2 Global E-Paper Technology Market Forecast by Region
11.2.1 North America Market Size Forecast by Country
11.2.2 Europe E-Paper Technology Market Size Forecast by Country
11.2.3 Asia Pacific E-Paper Technology Market Size Forecast by Region
11.2.4 South America E-Paper Technology Market Size Forecast by Country
11.2.5 Middle East and Africa Forecasted Consumption of E-Paper Technology by Country
12 Forecast Market by Type and by Application (2025-2032)
12.1 Global E-Paper Technology Market Forecast by Type (2025-2032)
12.1.1 Global Forecasted Sales of E-Paper Technology by Type (2025-2032)
12.1.2 Global E-Paper Technology Market Size Forecast by Type (2025-2032)
12.1.3 Global Forecasted Price of E-Paper Technology by Type (2025-2032)
12.2 Global E-Paper Technology Market Forecast by Application (2025-2032)
12.2.1 Global E-Paper Technology Sales (K Units) Forecast by Application
12.2.2 Global E-Paper Technology Market Size (M USD) Forecast by Application (2025-2032)
13 Conclusion and Key FindingsList of Tables
Table 1. Introduction of the Type
Table 2. Introduction of the Application
Table 3. Market Size (M USD) Segment Executive Summary
Table 4. E-Paper Technology Market Size Comparison by Region (M USD)
Table 5. Global E-Paper Technology Sales (K Units) by Manufacturers (2019-2025)
Table 6. Global E-Paper Technology Sales Market Share by Manufacturers (2019-2025)
Table 7. Global E-Paper Technology Revenue (M USD) by Manufacturers (2019-2025)
Table 8. Global E-Paper Technology Revenue Share by Manufacturers (2019-2025)
Table 9. Company Type (Tier 1, Tier 2, and Tier 3) & (based on the Revenue in E-Paper Technology as of 2022)
Table 10. Global Market E-Paper Technology Average Price (USD/Unit) of Key Manufacturers (2019-2025)
Table 11. Manufacturers E-Paper Technology Sales Sites and Area Served
Table 12. Manufacturers E-Paper Technology Product Type
Table 13. Global E-Paper Technology Manufacturers Market Concentration Ratio (CR5 and HHI)
Table 14. Mergers & Acquisitions, Expansion Plans
Table 15. Industry Chain Map of E-Paper Technology
Table 16. Market Overview of Key Raw Materials
Table 17. Midstream Market Analysis
Table 18. Downstream Customer Analysis
Table 19. Key Development Trends
Table 20. Driving Factors
Table 21. E-Paper Technology Market Challenges
Table 22. Global E-Paper Technology Sales by Type (K Units)
Table 23. Global E-Paper Technology Market Size by Type (M USD)
Table 24. Global E-Paper Technology Sales (K Units) by Type (2019-2025)
Table 25. Global E-Paper Technology Sales Market Share by Type (2019-2025)
Table 26. Global E-Paper Technology Market Size (M USD) by Type (2019-2025)
Table 27. Global E-Paper Technology Market Size Share by Type (2019-2025)
Table 28. Global E-Paper Technology Price (USD/Unit) by Type (2019-2025)
Table 29. Global E-Paper Technology Sales (K Units) by Application
Table 30. Global E-Paper Technology Market Size by Application
Table 31. Global E-Paper Technology Sales by Application (2019-2025) & (K Units)
Table 32. Global E-Paper Technology Sales Market Share by Application (2019-2025)
Table 33. Global E-Paper Technology Sales by Application (2019-2025) & (M USD)
Table 34. Global E-Paper Technology Market Share by Application (2019-2025)
Table 35. Global E-Paper Technology Sales Growth Rate by Application (2019-2025)
Table 36. Global E-Paper Technology Sales by Region (2019-2025) & (K Units)
Table 37. Global E-Paper Technology Sales Market Share by Region (2019-2025)
Table 38. North America E-Paper Technology Sales by Country (2019-2025) & (K Units)
Table 39. Europe E-Paper Technology Sales by Country (2019-2025) & (K Units)
Table 40. Asia Pacific E-Paper Technology Sales by Region (2019-2025) & (K Units)
Table 41. South America E-Paper Technology Sales by Country (2019-2025) & (K Units)
Table 42. Middle East and Africa E-Paper Technology Sales by Region (2019-2025) & (K Units)
Table 43. Global E-Paper Technology Production (K Units) by Region (2019-2025)
Table 44. Global E-Paper Technology Revenue (US$ Million) by Region (2019-2025)
Table 45. Global E-Paper Technology Revenue Market Share by Region (2019-2025)
Table 46. Global E-Paper Technology Production (K Units), Revenue (US$ Million), Price (USD/Unit) and Gross Margin (2019-2025)
Table 47. North America E-Paper Technology Production (K Units), Revenue (US$ Million), Price (USD/Unit) and Gross Margin (2019-2025)
Table 48. Europe E-Paper Technology Production (K Units), Revenue (US$ Million), Price (USD/Unit) and Gross Margin (2019-2025)
Table 49. Japan E-Paper Technology Production (K Units), Revenue (US$ Million), Price (USD/Unit) and Gross Margin (2019-2025)
Table 50. China E-Paper Technology Production (K Units), Revenue (US$ Million), Price (USD/Unit) and Gross Margin (2019-2025)
Table 51. E Ink Holdings Incorporated E-Paper Technology Basic Information
Table 52. E Ink Holdings Incorporated E-Paper Technology Product Overview
Table 53. E Ink Holdings Incorporated E-Paper Technology Sales (K Units), Revenue (M USD), Price (USD/Unit) and Gross Margin (2019-2025)
Table 54. E Ink Holdings Incorporated Business Overview
Table 55. E Ink Holdings Incorporated E-Paper Technology SWOT Analysis
Table 56. E Ink Holdings Incorporated Recent Developments
Table 57. Pervisive Displays E-Paper Technology Basic Information
Table 58. Pervisive Displays E-Paper Technology Product Overview
Table 59. Pervisive Displays E-Paper Technology Sales (K Units), Revenue (M USD), Price (USD/Unit) and Gross Margin (2019-2025)
Table 60. Pervisive Displays Business Overview
Table 61. Pervisive Displays E-Paper Technology SWOT Analysis
Table 62. Pervisive Displays Recent Developments
Table 63. Seekink E-Paper Technology Basic Information
Table 64. Seekink E-Paper Technology Product Overview
Table 65. Seekink E-Paper Technology Sales (K Units), Revenue (M USD), Price (USD/Unit) and Gross Margin (2019-2025)
Table 66. Seekink E-Paper Technology SWOT Analysis
Table 67. Seekink Business Overview
Table 68. Seekink Recent Developments
Table 69. Tianma Microelectronics Co.,Ltd. E-Paper Technology Basic Information
Table 70. Tianma Microelectronics Co.,Ltd. E-Paper Technology Product Overview
Table 71. Tianma Microelectronics Co.,Ltd. E-Paper Technology Sales (K Units), Revenue (M USD), Price (USD/Unit) and Gross Margin (2019-2025)
Table 72. Tianma Microelectronics Co.,Ltd. Business Overview
Table 73. Tianma Microelectronics Co.,Ltd. Recent Developments
Table 74. Samsung E-Paper Technology Basic Information
Table 75. Samsung E-Paper Technology Product Overview
Table 76. Samsung E-Paper Technology Sales (K Units), Revenue (M USD), Price (USD/Unit) and Gross Margin (2019-2025)
Table 77. Samsung Business Overview
Table 78. Samsung Recent Developments
Table 79. Shenzhen Laibao Hi-tech Co.,Ltd. E-Paper Technology Basic Information
Table 80. Shenzhen Laibao Hi-tech Co.,Ltd. E-Paper Technology Product Overview
Table 81. Shenzhen Laibao Hi-tech Co.,Ltd. E-Paper Technology Sales (K Units), Revenue (M USD), Price (USD/Unit) and Gross Margin (2019-2025)
Table 82. Shenzhen Laibao Hi-tech Co.,Ltd. Business Overview
Table 83. Shenzhen Laibao Hi-tech Co.,Ltd. Recent Developments
Table 84. Admiral Overseas Corporation E-Paper Technology Basic Information
Table 85. Admiral Overseas Corporation E-Paper Technology Product Overview
Table 86. Admiral Overseas Corporation E-Paper Technology Sales (K Units), Revenue (M USD), Price (USD/Unit) and Gross Margin (2019-2025)
Table 87. Admiral Overseas Corporation Business Overview
Table 88. Admiral Overseas Corporation Recent Developments
Table 89. Refond E-Paper Technology Basic Information
Table 90. Refond E-Paper Technology Product Overview
Table 91. Refond E-Paper Technology Sales (K Units), Revenue (M USD), Price (USD/Unit) and Gross Margin (2019-2025)
Table 92. Refond Business Overview
Table 93. Refond Recent Developments
Table 94. Global E-Paper Technology Sales Forecast by Region (2025-2032) & (K Units)
Table 95. Global E-Paper Technology Market Size Forecast by Region (2025-2032) & (M USD)
Table 96. North America E-Paper Technology Sales Forecast by Country (2025-2032) & (K Units)
Table 97. North America E-Paper Technology Market Size Forecast by Country (2025-2032) & (M USD)
Table 98. Europe E-Paper Technology Sales Forecast by Country (2025-2032) & (K Units)
Table 99. Europe E-Paper Technology Market Size Forecast by Country (2025-2032) & (M USD)
Table 100. Asia Pacific E-Paper Technology Sales Forecast by Region (2025-2032) & (K Units)
Table 101. Asia Pacific E-Paper Technology Market Size Forecast by Region (2025-2032) & (M USD)
Table 102. South America E-Paper Technology Sales Forecast by Country (2025-2032) & (K Units)
Table 103. South America E-Paper Technology Market Size Forecast by Country (2025-2032) & (M USD)
Table 104. Middle East and Africa E-Paper Technology Consumption Forecast by Country (2025-2032) & (Units)
Table 105. Middle East and Africa E-Paper Technology Market Size Forecast by Country (2025-2032) & (M USD)
Table 106. Global E-Paper Technology Sales Forecast by Type (2025-2032) & (K Units)
Table 107. Global E-Paper Technology Market Size Forecast by Type (2025-2032) & (M USD)
Table 108. Global E-Paper Technology Price Forecast by Type (2025-2032) & (USD/Unit)
Table 109. Global E-Paper Technology Sales (K Units) Forecast by Application (2025-2032)
Table 110. Global E-Paper Technology Market Size Forecast by Application (2025-2032) & (M USD)
List of Figures
Figure 1. Product Picture of E-Paper Technology
Figure 2. Data Triangulation
Figure 3. Key Caveats
Figure 4. Global E-Paper Technology Market Size (M USD), 2019-2032
Figure 5. Global E-Paper Technology Market Size (M USD) (2019-2032)
Figure 6. Global E-Paper Technology Sales (K Units) & (2019-2032)
Figure 7. Evaluation Matrix of Segment Market Development Potential (Type)
Figure 8. Evaluation Matrix of Segment Market Development Potential (Application)
Figure 9. Evaluation Matrix of Regional Market Development Potential
Figure 10. E-Paper Technology Market Size by Country (M USD)
Figure 11. E-Paper Technology Sales Share by Manufacturers in 2023
Figure 12. Global E-Paper Technology Revenue Share by Manufacturers in 2023
Figure 13. E-Paper Technology Market Share by Company Type (Tier 1, Tier 2 and Tier 3): 2023
Figure 14. Global Market E-Paper Technology Average Price (USD/Unit) of Key Manufacturers in 2023
Figure 15. The Global 5 and 10 Largest Players: Market Share by E-Paper Technology Revenue in 2023
Figure 16. Evaluation Matrix of Segment Market Development Potential (Type)
Figure 17. Global E-Paper Technology Market Share by Type
Figure 18. Sales Market Share of E-Paper Technology by Type (2019-2025)
Figure 19. Sales Market Share of E-Paper Technology by Type in 2023
Figure 20. Market Size Share of E-Paper Technology by Type (2019-2025)
Figure 21. Market Size Market Share of E-Paper Technology by Type in 2023
Figure 22. Evaluation Matrix of Segment Market Development Potential (Application)
Figure 23. Global E-Paper Technology Market Share by Application
Figure 24. Global E-Paper Technology Sales Market Share by Application (2019-2025)
Figure 25. Global E-Paper Technology Sales Market Share by Application in 2023
Figure 26. Global E-Paper Technology Market Share by Application (2019-2025)
Figure 27. Global E-Paper Technology Market Share by Application in 2023
Figure 28. Global E-Paper Technology Sales Growth Rate by Application (2019-2025)
Figure 29. Global E-Paper Technology Sales Market Share by Region (2019-2025)
Figure 30. North America E-Paper Technology Sales and Growth Rate (2019-2025) & (K Units)
Figure 31. North America E-Paper Technology Sales Market Share by Country in 2023
Figure 32. U.S. E-Paper Technology Sales and Growth Rate (2019-2025) & (K Units)
Figure 33. Canada E-Paper Technology Sales (K Units) and Growth Rate (2019-2025)
Figure 34. Mexico E-Paper Technology Sales (Units) and Growth Rate (2019-2025)
Figure 35. Europe E-Paper Technology Sales and Growth Rate (2019-2025) & (K Units)
Figure 36. Europe E-Paper Technology Sales Market Share by Country in 2023
Figure 37. Germany E-Paper Technology Sales and Growth Rate (2019-2025) & (K Units)
Figure 38. France E-Paper Technology Sales and Growth Rate (2019-2025) & (K Units)
Figure 39. U.K. E-Paper Technology Sales and Growth Rate (2019-2025) & (K Units)
Figure 40. Italy E-Paper Technology Sales and Growth Rate (2019-2025) & (K Units)
Figure 41. Russia E-Paper Technology Sales and Growth Rate (2019-2025) & (K Units)
Figure 42. Asia Pacific E-Paper Technology Sales and Growth Rate (K Units)
Figure 43. Asia Pacific E-Paper Technology Sales Market Share by Region in 2023
Figure 44. China E-Paper Technology Sales and Growth Rate (2019-2025) & (K Units)
Figure 45. Japan E-Paper Technology Sales and Growth Rate (2019-2025) & (K Units)
Figure 46. South Korea E-Paper Technology Sales and Growth Rate (2019-2025) & (K Units)
Figure 47. India E-Paper Technology Sales and Growth Rate (2019-2025) & (K Units)
Figure 48. Southeast Asia E-Paper Technology Sales and Growth Rate (2019-2025) & (K Units)
Figure 49. South America E-Paper Technology Sales and Growth Rate (K Units)
Figure 50. South America E-Paper Technology Sales Market Share by Country in 2023
Figure 51. Brazil E-Paper Technology Sales and Growth Rate (2019-2025) & (K Units)
Figure 52. Argentina E-Paper Technology Sales and Growth Rate (2019-2025) & (K Units)
Figure 53. Columbia E-Paper Technology Sales and Growth Rate (2019-2025) & (K Units)
Figure 54. Middle East and Africa E-Paper Technology Sales and Growth Rate (K Units)
Figure 55. Middle East and Africa E-Paper Technology Sales Market Share by Region in 2023
Figure 56. Saudi Arabia E-Paper Technology Sales and Growth Rate (2019-2025) & (K Units)
Figure 57. UAE E-Paper Technology Sales and Growth Rate (2019-2025) & (K Units)
Figure 58. Egypt E-Paper Technology Sales and Growth Rate (2019-2025) & (K Units)
Figure 59. Nigeria E-Paper Technology Sales and Growth Rate (2019-2025) & (K Units)
Figure 60. South Africa E-Paper Technology Sales and Growth Rate (2019-2025) & (K Units)
Figure 61. Global E-Paper Technology Production Market Share by Region (2019-2025)
Figure 62. North America E-Paper Technology Production (K Units) Growth Rate (2019-2025)
Figure 63. Europe E-Paper Technology Production (K Units) Growth Rate (2019-2025)
Figure 64. Japan E-Paper Technology Production (K Units) Growth Rate (2019-2025)
Figure 65. China E-Paper Technology Production (K Units) Growth Rate (2019-2025)
Figure 66. Global E-Paper Technology Sales Forecast by Volume (2019-2032) & (K Units)
Figure 67. Global E-Paper Technology Market Size Forecast by Value (2019-2032) & (M USD)
Figure 68. Global E-Paper Technology Sales Market Share Forecast by Type (2025-2032)
Figure 69. Global E-Paper Technology Market Share Forecast by Type (2025-2032)
Figure 70. Global E-Paper Technology Sales Forecast by Application (2025-2032)
Figure 71. Global E-Paper Technology Market Share Forecast by Application (2025-2032)