E-paper Display Signage Market Overview
E-paper is an electronic device that is designed to look a lot like real paper. Is main difference to a regular display is that is reflects light instead of emitting it. E-paper displays are screens that display text and graphics digitally without losing the positive characteristics of paper. They do not consume much power and, thanks to e-paper technology, are easy on the eyes. Due to the viewing angle stability and high contrast, text can be read very well, especially over a longer period of time, whereas conventional LCD displays lead to eye fatigue in the long run. Since sunlight has little effect on the readability of the E-Ink screen, E-paper displays can be used both indoors and outdoors.
This report provides a deep insight into the global E-paper Display Signage market covering all its essential aspects. This ranges from a macro overview of the market to micro details of the market size, competitive landscape, development trend, niche market, key market drivers and challenges, SWOT analysis, value chain analysis, etc.
The analysis helps the reader to shape the competition within the industries and strategies for the competitive environment to enhance the potential profit. Furthermore, it provides a simple framework for evaluating and accessing the position of the business organization. The report structure also focuses on the competitive landscape of the Global E-paper Display Signage Market, this report introduces in detail the market share, market performance, product situation, operation situation, etc. of the main players, which helps the readers in the industry to identify the main competitors and deeply understand the competition pattern of the market.
In a word, this report is a must-read for industry players, investors, researchers, consultants, business strategists, and all those who have any kind of stake or are planning to foray into the E-paper Display Signage market in any manner.
E-paper Display Signage Market Analysis:
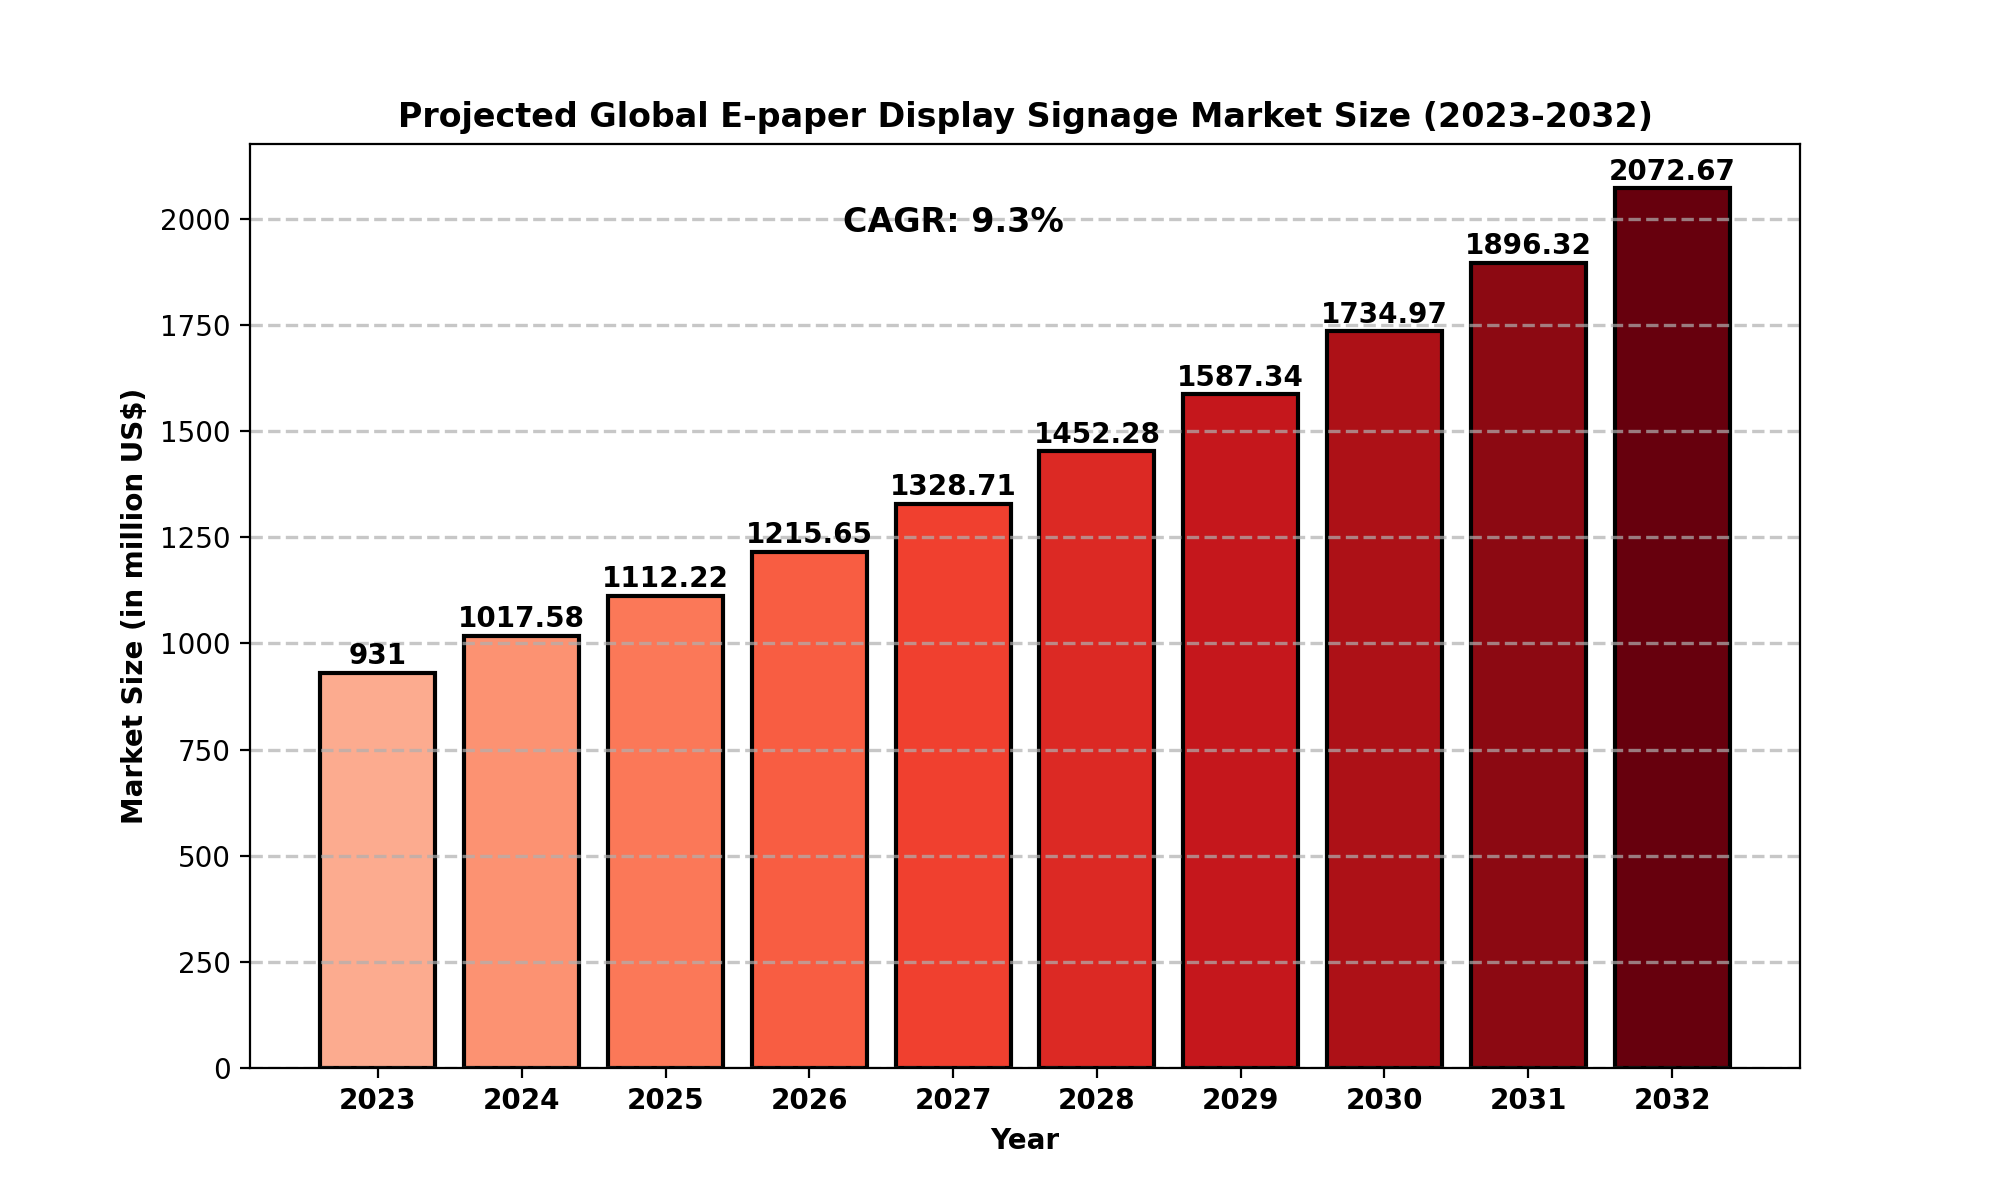
The global E-paper Display Signage Market size was estimated at USD 931 million in 2023 and is projected to reach USD 2072.67 million by 2032, exhibiting a CAGR of 9.30% during the forecast period.
North America E-paper Display Signage market size was estimated at USD 282.81 million in 2023, at a CAGR of 7.97% during the forecast period of 2025 through 2032.
E-paper Display Signage Key Market Trends :
Growing Adoption in Public Transport
The demand for E-paper display signage is rising in public transport systems for real-time schedule updates, wayfinding, and passenger information.Advancements in Color E-paper Technology
The development of full-color E-paper displays is enhancing their applications in digital signage, advertising, and retail environments.Increased Energy Efficiency and Sustainability
E-paper displays consume minimal power and are increasingly being adopted by businesses looking for energy-efficient and eco-friendly solutions.Expansion in Outdoor Digital Signage
The ability of E-paper screens to remain visible in direct sunlight is boosting their usage in outdoor environments such as bus stops, railway stations, and public spaces.Rising Investments in Smart Retail Solutions
Retailers are adopting E-paper signage for electronic shelf labels (ESLs) and digital price tags to improve customer engagement and operational efficiency.
E-paper Display Signage Market Regional Analysis :

North America:
Strong demand driven by EVs, 5G infrastructure, and renewable energy, with the U.S. leading the market.
Europe:
Growth fueled by automotive electrification, renewable energy, and strong regulatory support, with Germany as a key player.
Asia-Pacific:
Dominates the market due to large-scale manufacturing in China and Japan, with growing demand from EVs, 5G, and semiconductors.
South America:
Emerging market, driven by renewable energy and EV adoption, with Brazil leading growth.
Middle East & Africa:
Gradual growth, mainly due to investments in renewable energy and EV infrastructure, with Saudi Arabia and UAE as key contributors.
E-paper Display Signage Market Segmentation :
The research report includes specific segments by region (country), manufacturers, Type, and Application. Market segmentation creates subsets of a market based on product type, end-user or application, Geographic, and other factors. By understanding the market segments, the decision-maker can leverage this targeting in the product, sales, and marketing strategies. Market segments can power your product development cycles by informing how you create product offerings for different segments.
Key Company
- Sharp NEC Display Solutions
- E Ink Holdings Incorporated
- Seekink
- CREA
- Papercast
- Visionect
- ZEMSO Group
- Plastic Logic
- Visix
Market Segmentation (by Type)
- Grayscale Display Signage
- Color Display Signage
Market Segmentation (by Application)
- Public Transport
- Advertising
- Others
Market Drivers
Eco-friendly and Energy-saving Technology
E-paper displays consume significantly less power compared to traditional digital screens, making them ideal for sustainable business solutions.Better Readability and Eye Comfort
The high contrast and wide viewing angles of E-paper screens make them easier to read, reducing eye strain compared to LCD displays.Growing Demand for Digital Signage
Industries such as retail, transportation, and corporate offices are increasingly adopting E-paper signage for improved customer communication.
Market Restraints
Higher Initial Cost
E-paper displays can be more expensive upfront compared to traditional LCD or LED screens, which may limit their adoption.Limited Color Capabilities
While grayscale E-paper displays are widely used, full-color technology is still developing and may not match the vibrancy of LCD screens.Slow Refresh Rate
E-paper screens take longer to update content compared to LED or OLED screens, which may not be suitable for dynamic content needs.
Market Opportunities
Expansion in Smart Cities
Governments are integrating E-paper signage in smart city projects for public information boards, traffic updates, and digital notices.Rising Use in Healthcare
E-paper displays are increasingly used in hospitals for patient information boards, electronic prescriptions, and wayfinding systems.Integration with IoT and AI
The combination of E-paper with IoT and AI can improve automation in retail and transportation sectors for real-time updates and data-driven signage.
Market Challenges
Competition from LED and OLED Displays
Traditional display technologies offer more vibrant colors and faster refresh rates, posing a challenge for E-paper adoption.Durability in Extreme Weather Conditions
E-paper displays used in outdoor settings must withstand extreme temperatures, which can affect performance and longevity.Limited Awareness and Adoption
Many businesses are still unaware of the advantages of E-paper technology, which slows down market penetration.
Key Benefits of This Market Research:
- Industry drivers, restraints, and opportunities covered in the study
- Neutral perspective on the market performance
- Recent industry trends and developments
- Competitive landscape & strategies of key players
- Potential & niche segments and regions exhibiting promising growth covered
- Historical, current, and projected market size, in terms of value
- In-depth analysis of the E-paper Display Signage Market
- Overview of the regional outlook of the E-paper Display Signage Market:
Key Reasons to Buy this Report:
- Access to date statistics compiled by our researchers. These provide you with historical and forecast data, which is analyzed to tell you why your market is set to change
- This enables you to anticipate market changes to remain ahead of your competitors
- You will be able to copy data from the Excel spreadsheet straight into your marketing plans, business presentations, or other strategic documents
- The concise analysis, clear graph, and table format will enable you to pinpoint the information you require quickly
- Provision of market value data for each segment and sub-segment
- Indicates the region and segment that is expected to witness the fastest growth as well as to dominate the market
- Provides insight into the market through Value Chain
- Market dynamics scenario, along with growth opportunities of the market in the years to come
- 6-month post-sales analyst support
Customization of the Report
In case of any queries or customization requirements, please connect with our sales team, who will ensure that your requirements are met.
FAQs
Q: What are the key driving factors and opportunities in the E-paper Display Signage market?
A: The key drivers include energy efficiency, better readability, and rising demand for digital signage. Opportunities lie in smart cities, healthcare applications, and integration with IoT.
Q: Which region is projected to have the largest market share?
A: North America is expected to dominate the E-paper Display Signage market, driven by technological advancements and strong adoption in retail and transportation sectors.
Q: Who are the top players in the global E-paper Display Signage market?
A: Leading companies include Sharp NEC Display Solutions, E Ink Holdings Incorporated, Seekink, CREA, Papercast, Visionect, and Plastic Logic.
Q: What are the latest technological advancements in the industry?
A: Advancements include full-color E-paper displays, improved refresh rates, and integration with AI and IoT for smarter digital signage solutions.
Q: What is the current size of the global E-paper Display Signage market?
A: The market was valued at USD 931 million in 2023 and is projected to reach USD 2072.67 million by 2032, growing at a CAGR of 9.30%.

Get Sample Report PDF for Exclusive Insights
Report Sample Includes
- Table of Contents
- List of Tables & Figures
- Charts, Research Methodology, and more...