E-paper Display (EPD) Market, Size, Trends, Business Strategies 2025-2032

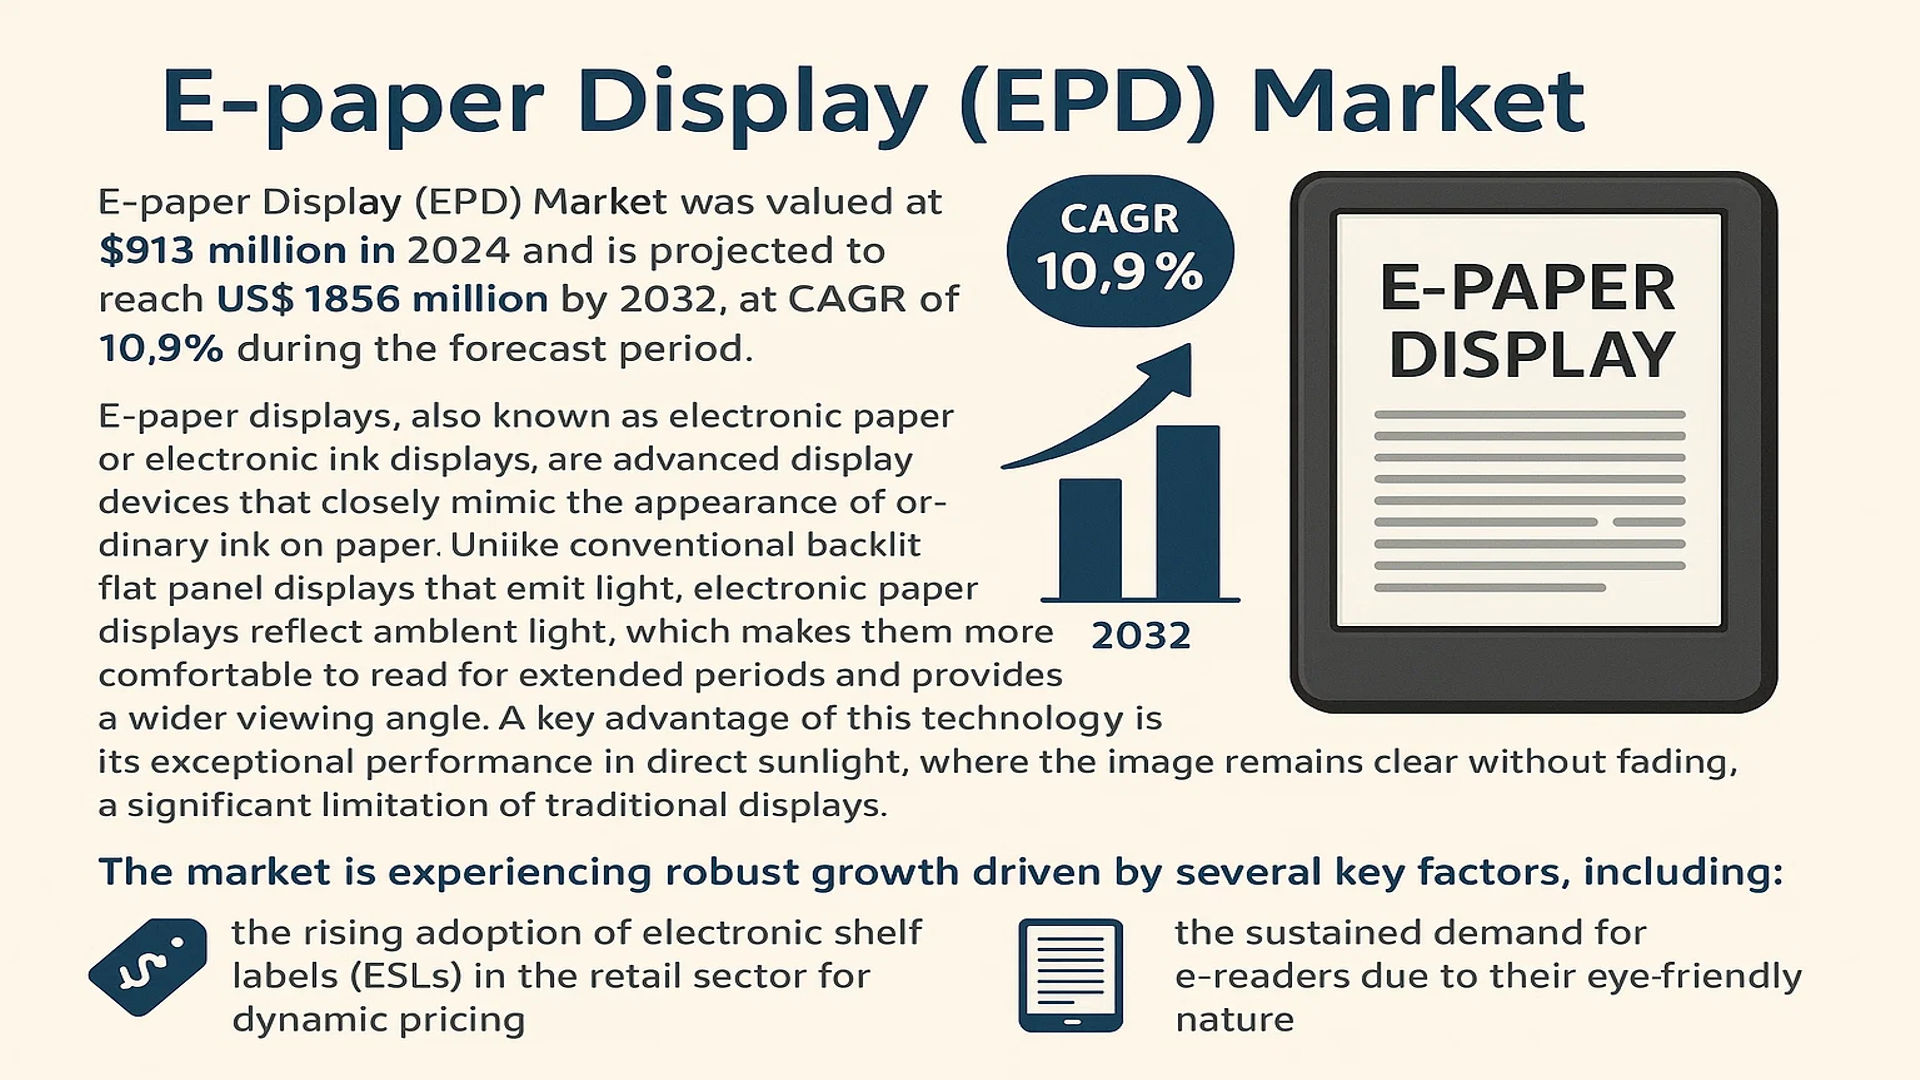
E-paper Display (EPD) Market was valued at 913 million in 2024 and is projected to reach US$ 1856 million by 2032, at a CAGR of 10.9% during the forecast period

PDF Icon Download Sample Report PDF
  • Quick Dispatch

    All Orders

  • Secure Payment

    100% Secure Payment

Price range: $1,500.00 through $4,250.00

Clear

MARKET INSIGHTS

The global E-paper Display (EPD) Market was valued at 913 million in 2024 and is projected to reach US$ 1856 million by 2032, at a CAGR of 10.9% during the forecast period.

E-paper displays, also known as electronic paper or electronic ink displays, are advanced display devices that closely mimic the appearance of ordinary ink on paper. Unlike conventional backlit flat panel displays that emit light, electronic paper displays reflect ambient light, which makes them more comfortable to read for extended periods and provides a wider viewing angle. A key advantage of this technology is its exceptional performance in direct sunlight, where the image remains clear without fading, a significant limitation of traditional displays.

The market is experiencing robust growth driven by several key factors, including the rising adoption of electronic shelf labels (ESLs) in the retail sector for dynamic pricing and the sustained demand for e-readers due to their eye-friendly nature. Furthermore, advancements in flexible and color EPD technologies are opening new applications in wearables, public transportation signage, and smart logistics. The market is also highly concentrated, with the top five manufacturers holding a collective market share exceeding 80%. E Ink Holdings Inc. is the dominant player, with other significant contributors including LG Display, Pervasive Displays, and OED Technologies.
E-paper Display (EPD) Market

MARKET DYNAMICS

MARKET DRIVERS

Rising Demand for Energy-Efficient Display Solutions to Propel Market Growth

The global push toward sustainability and energy conservation is significantly driving the adoption of E-paper Display (EPD) technology. Unlike conventional LCD or OLED displays that require constant power to maintain images, EPDs consume power only during image changes, making them exceptionally energy-efficient. This characteristic is particularly valuable in applications requiring always-on displays, such as electronic shelf labels (ESLs) and digital signage. The retail sector’s growing emphasis on reducing energy consumption—where traditional displays can account for up to 40% of a store’s energy usage—is accelerating EPD integration. With global energy costs rising and sustainability regulations tightening, businesses are increasingly adopting EPD solutions to lower operational expenses and meet environmental targets.

Expansion of IoT and Smart Infrastructure to Boost EPD Adoption

The rapid growth of the Internet of Things (IoT) ecosystem and smart city initiatives worldwide is creating substantial opportunities for E-paper displays. EPDs are ideal for IoT applications due to their low power consumption, sunlight readability, and ability to operate for extended periods without maintenance. Smart transportation systems, for instance, are deploying EPDs in electronic bus stop signs and railway information displays, where visibility in direct sunlight and minimal power requirements are critical. The global IoT market’s expansion, projected to connect over 29 billion devices by 2030, is driving demand for energy-efficient display technologies that can operate reliably in diverse environmental conditions without frequent battery replacements or external power sources.

Furthermore, innovations in flexible and large-format EPDs are enabling new applications in smart packaging, wearable technology, and architectural integration, expanding the technology’s reach beyond traditional e-readers and retail labels.

For instance, several European cities have implemented solar-powered EPD information kiosks that operate continuously without grid connection, demonstrating the technology’s suitability for sustainable urban infrastructure.

The convergence of EPD technology with energy harvesting systems and low-power wireless communication protocols is further enhancing its value proposition for distributed IoT applications, positioning it as a key enabling technology for the next generation of smart devices and infrastructure.

MARKET CHALLENGES

Limited Color Reproduction and Refresh Rates to Constrain Application Scope

Despite significant advancements, E-paper displays face inherent technological limitations that challenge their adoption in certain applications. The most prominent constraint is the limited color reproduction capability compared to emissive display technologies. While recent developments have introduced color EPDs, they typically offer a limited color gamut and lower saturation levels than LCD or OLED alternatives. This restriction makes them less suitable for applications requiring vibrant multimedia content or detailed color graphics. Additionally, the relatively slow refresh rates of EPD technology—typically ranging from 500 milliseconds to several seconds—create challenges for dynamic content applications where real-time updates are essential.

Other Challenges

Manufacturing Scale and Cost Efficiency
The specialized manufacturing processes required for EPD production present scalability challenges. While the market has grown substantially, production volumes remain significantly lower than those of mainstream display technologies, resulting in higher per-unit costs. The complex layer structure involving microcapsules or electrophoretic fluids requires precise manufacturing conditions and specialized equipment, limiting the number of facilities capable of mass production. This manufacturing complexity contributes to cost structures that are approximately 30-40% higher than comparable-sized LCD panels, creating adoption barriers in price-sensitive market segments.

Environmental Sensitivity and Durability Concerns
EPD performance can be affected by extreme environmental conditions, particularly temperature variations. The electrophoretic fluids or electronic inks used in these displays have operational temperature ranges typically between 0°C and 50°C, limiting deployment in harsh environments. Additionally, while EPDs excel in sunlight readability, prolonged exposure to UV radiation can gradually degrade display performance over time. These environmental sensitivities require careful consideration in outdoor applications and necessitate protective measures that can increase total system costs.

MARKET RESTRAINTS

Competition from Advanced Display Technologies to Limit Market Penetration

The E-paper display market faces intense competition from continually improving alternative display technologies. LCD manufacturers have developed ultra-low-power variants that approach EPD’s energy efficiency while offering superior color performance and refresh rates. Similarly, OLED technology advancements have produced reflective and low-power variants that challenge EPD’s value proposition in certain applications. These competing technologies benefit from massive manufacturing scale and ongoing R&D investments driven by consumer electronics markets, enabling rapid cost reductions and performance improvements that EPD manufacturers struggle to match.

Furthermore, the development of hybrid display solutions that combine EPD with other technologies creates competitive pressure. Some manufacturers are integrating partial EPD elements with conventional displays to achieve energy savings while maintaining performance characteristics, potentially reducing the market for pure EPD solutions in applications where compromise is acceptable.

MARKET OPPORTUNITIES

Emerging Applications in Healthcare and Education to Create New Growth Pathways

The healthcare and education sectors present significant growth opportunities for E-paper display technology. In healthcare, EPDs are increasingly used for patient wristbands, medical signage, and portable diagnostic equipment displays where readability, low power consumption, and sterilization compatibility are critical requirements. The global healthcare digitization trend, accelerated by the need for contactless solutions and efficient patient management systems, is driving adoption of EPD-based solutions that can operate for years without battery replacement while maintaining clear information display.

In educational applications, EPD technology enables the development of digital textbooks and note-taking devices that mimic paper’s readability while providing digital convenience. The growing adoption of digital learning platforms and the push toward reducing paper consumption in educational institutions create favorable conditions for EPD integration. Several educational technology providers have launched E-paper based devices specifically designed for academic use, combining the eye comfort of paper with the functionality of digital devices.

Additionally, the development of advanced EPD technologies with improved color capabilities, faster refresh rates, and flexible form factors is opening new application areas in consumer electronics, automotive displays, and smart packaging. These technological advancements, combined with growing environmental awareness and regulatory support for energy-efficient technologies, position EPD for expanded market penetration across multiple sectors.

E-PAPER DISPLAY (EPD) MARKET TRENDS

Advancements in Color and Flexible EPD Technology to Emerge as a Trend in the Market

Advancements in color and flexible electronic paper display technology are fundamentally reshaping the market landscape and expanding its application potential. While traditional monochrome EPDs have dominated e-readers for years, the recent commercial rollout of advanced color e-paper, such as E Ink’s Gallery™ Palette and Print Color ePaper, is unlocking new verticals. These technologies utilize advanced color filter arrays and improved pigments to achieve a color gamut that is increasingly viable for retail signage and educational tools. Furthermore, the development of truly flexible and even rollable e-paper substrates is progressing beyond the prototype stage. This evolution is crucial because it enables integration into non-traditional form factors, such as curved smart surfaces on consumer electronics and wearable devices, creating a new addressable market beyond rigid displays. While the initial cost premium remains a barrier, manufacturing efficiencies are expected to bring these advanced displays into more competitive price points, further accelerating adoption.

Other Trends

Sustainability and Energy Efficiency Driving Retail Adoption

The global push for sustainability and energy efficiency is a powerful driver for EPD adoption, particularly within the retail sector for Electronic Shelf Labels (ESLs). Unlike conventional LCD or LED price tags, EPDs consume power only when the image is changed, leading to exceptionally low energy consumption. A single ESL can operate for up to five years on a small coin-cell battery, eliminating the need for wiring and reducing maintenance costs. This energy-saving characteristic is a significant operational advantage for large retail chains managing thousands of labels. Consequently, the ESL segment is experiencing robust growth, with deployments accelerating in Europe and North America as retailers seek to modernize stores, enable dynamic pricing, and bolster their green credentials. The scalability of these systems makes them an attractive investment for achieving long-term operational efficiency.

Expansion into New Application Verticals Beyond E-Readers

The expansion of E-paper displays into new application verticals beyond the mature e-reader market is a defining trend for future growth. While e-readers still account for a substantial portion of the market, innovation is fueling penetration into diverse fields. In transportation and logistics, EPDs are being widely adopted for smart baggage tags at airports and parcel tracking labels, valued for their durability and long battery life. The healthcare sector is utilizing them for patient bed charts and medical wristbands because they reduce screen fatigue and can be updated wirelessly. Furthermore, the architecture, engineering, and construction (AEC) industry is exploring their use in dynamic blueprints and site signage. This diversification is critical for the market’s health because it reduces reliance on a single application and taps into the growing Internet of Things (IoT) ecosystem, where always-on, low-power displays are essential.

COMPETITIVE LANDSCAPE

Key Industry Players

Companies Strive to Strengthen their Product Portfolio to Sustain Competition

The global E-paper Display (EPD) market exhibits a semi-consolidated competitive structure, characterized by a mix of dominant technology innovators and specialized manufacturers vying for market share. E Ink Holdings Inc. stands as the undisputed market leader, commanding a significant portion of global revenues due to its pioneering electrophoretic display technology and extensive patent portfolio. The company’s strategic partnerships with major e-reader brands and expansion into retail electronic shelf labels (ESLs) have solidified its position, particularly across Asia and North America.

LG Display and Pervasive Displays also hold considerable market influence, driven by their advanced manufacturing capabilities and diverse application focus. LG Display’s investment in large-format EPDs for advertising and public transport signage, combined with Pervasive Displays’ strength in the e-reader and IoT device segments, has enabled both companies to capture substantial value in this growing market. Their growth is further propelled by continuous innovation in display resolution, color technology, and energy efficiency.

Additionally, these industry leaders are actively pursuing growth through geographical expansion and new product launches. For instance, recent developments include the introduction of flexible E-paper displays and advanced color e-paper technologies, which are expected to open new application avenues in wearable technology and smart packaging. Such initiatives are anticipated to significantly enhance their market presence over the coming years.

Meanwhile, players like Qualcomm (through its Mirasol display technology) and Plastic Logic are strengthening their positions through substantial R&D investments and strategic collaborations. Qualcomm’s focus on low-power, high-refresh-rate displays for smartwatches and IoT devices, and Plastic Logic’s development of ultra-thin, flexible EPDs for niche applications, demonstrate the diverse strategies employed to compete and innovate in this dynamic landscape.

List of Key E-paper Display (EPD) Companies Profiled

  • E Ink Holdings Inc. (Taiwan)
  • LG Display Co., Ltd. (South Korea)
  • Pervasive Displays Inc. (Taiwan)
  • Qualcomm Technologies, Inc. (U.S.)
  • Liquavista B.V. (Netherlands)
  • Plastic Logic GmbH (Germany)
  • OED Technologies Co., Ltd. (China)
  • Gamma Dynamics (U.S.)
  • Industrial Technology Research Institute (ITRI) (Taiwan)

Segment Analysis:

By Technology

Electrophoretic Display (EPD) Segment Dominates the Market Due to its Mature Technology and Widespread Adoption in E-Readers

The market is segmented based on technology into:

  • Electrophoretic Display (EPD)
    • Subtypes: Microcapsule, Microcup, and others
  • Electrowetting Display (EWD)
  • Electrochromic Display (ECD)
  • Cholesteric Liquid Crystal Display (Ch-LCD)
  • Others

By Application

E-Reader Segment Leads Due to High Consumer Demand for Low-Power, Eye-Friendly Reading Devices

The market is segmented based on application into:

  • E-Reader
  • Electronic Shelf Label (ESL)
  • Wearables
    • Subtypes: Smartwatches, Fitness trackers, and others
  • Public and Retail Signage
  • Others

By Size

Medium-Sized Displays Hold Significant Share Owing to their Versatility Across Key Applications

The market is segmented based on size into:

  • Small (Less than 6 inches)
  • Medium (6 inches to 10 inches)
  • Large (More than 10 inches)

By Substrate

Glass Substrate Segment is Prevalent Due to its Rigidity and Established Manufacturing Processes

The market is segmented based on substrate into:

  • Glass
  • Plastic/Flexible
  • Metal
  • Others

Regional Analysis: E-paper Display (EPD) Market

Asia-Pacific
The Asia-Pacific region is the undisputed global leader in the E-paper Display market, accounting for over 60% of global consumption by volume. This dominance is primarily driven by China, which alone represents the largest single market, followed by significant manufacturing and consumption hubs in Taiwan and South Korea. The region’s leadership is underpinned by its massive electronics manufacturing ecosystem, which produces the vast majority of the world’s e-readers. Furthermore, the rapid adoption of Electronic Shelf Labels (ESLs) in the retail sectors of countries like China, Japan, and South Korea, fueled by urbanization and the push for smart retail infrastructure, is a major growth driver. While cost sensitivity remains a factor, the region is also a hotbed for innovation, with local players and major global manufacturers like E Ink (headquartered in Taiwan) driving advancements in display technology.

North America
North America represents a mature and high-value market for EPD technology, characterized by strong demand for premium e-reading devices and early adoption of innovative applications. The United States is the core of this region, with a consumer base that has a high affinity for technology and a retail sector increasingly investing in digitalization through Electronic Shelf Labels for dynamic pricing and inventory management. Significant potential exists in niche applications such as smart home displays, wearable technology, and digital signage in corporate and public spaces. The market is driven by a focus on energy efficiency, the superior readability of E-paper, and sustainability initiatives, as these displays consume power only when the image changes. Leading technology companies and retailers in the region are key partners for EPD manufacturers.

Europe
Europe is a steadily growing market for E-paper displays, with demand largely fueled by stringent environmental regulations and a strong focus on sustainability. The region’s well-established retail sector, particularly in Western European nations like Germany, France, and the UK, is a primary adopter of Electronic Shelf Label systems to enhance operational efficiency and reduce paper waste. Furthermore, European consumers show a high propensity for e-readers, supporting a stable market for EPDs in that segment. The market is also seeing increased integration in public transportation systems for passenger information displays and in smart city infrastructure. Innovation is key, with research institutions and companies exploring advanced color E-paper and flexible display applications, aligning with the region’s broader goals of energy conservation and technological advancement.

South America
The E-paper Display market in South America is nascent but shows promising long-term growth potential. Economic volatility and infrastructure challenges have historically slowed the widespread adoption of newer technologies. However, the region’s large and growing retail sector, especially in major economies like Brazil and Argentina, presents a significant opportunity for Electronic Shelf Labels as a tool for modernization and efficiency. The adoption rate is gradual, often hindered by higher initial costs compared to traditional paper labels and a need for greater awareness of the long-term ROI. As economic conditions stabilize and digital infrastructure improves, the market is expected to gain momentum, driven by the need for retail automation and the growing popularity of e-books.

Middle East & Africa
The Middle East and Africa region represents an emerging market for E-paper displays, with growth currently concentrated in more developed economies and specific sectors. In the Middle East, particularly in Gulf Cooperation Council (GCC) countries like the UAE and Saudi Arabia, investments in smart city projects and modern retail infrastructure are creating demand for ESLs and informational displays. The African market is at a much earlier stage of development, with adoption limited by infrastructure gaps and economic constraints. However, the region’s overall potential is significant, driven by a young, tech-savvy population and ongoing urbanization. The long-term outlook is positive, with growth expected to accelerate as digital penetration increases and the benefits of low-power, sunlight-readable displays become more widely recognized.

Report Scope

This market research report provides a comprehensive analysis of the global and regional E-paper Display (EPD) markets, covering the forecast period 2025–2032. It offers detailed insights into market dynamics, technological advancements, competitive landscape, and key trends shaping the industry.

Key focus areas of the report include:

  • Market Size & Forecast: Historical data and future projections for revenue, unit shipments, and market value across major regions and segments.
  • Segmentation Analysis: Detailed breakdown by product type, technology, application, and end-user industry to identify high-growth segments and investment opportunities.
  • Regional Outlook: Insights into market performance across North America, Europe, Asia-Pacific, Latin America, and the Middle East & Africa, including country-level analysis where relevant.
  • Competitive Landscape: Profiles of leading market participants, including their product offerings, R&D focus, manufacturing capacity, pricing strategies, and recent developments such as mergers, acquisitions, and partnerships.
  • Technology Trends & Innovation: Assessment of emerging technologies, integration of AI/IoT, semiconductor design trends, fabrication techniques, and evolving industry standards.
  • Market Drivers & Restraints: Evaluation of factors driving market growth along with challenges, supply chain constraints, regulatory issues, and market-entry barriers.
  • Stakeholder Analysis: Insights for component suppliers, OEMs, system integrators, investors, and policymakers regarding the evolving ecosystem and strategic opportunities.

Primary and secondary research methods are employed, including interviews with industry experts, data from verified sources, and real-time market intelligence to ensure the accuracy and reliability of the insights presented.

FREQUENTLY ASKED QUESTIONS:

What is the current market size of Global E-paper Display (EPD) Market?

-> E-paper Display (EPD) Market was valued at 913 million in 2024 and is projected to reach US$ 1856 million by 2032, at a CAGR of 10.9% during the forecast period.

Which key companies operate in Global E-paper Display (EPD) Market?

-> Key players include E Ink, LG Display, Liquavistar, Pervisive Displays, and OED, among others.

What are the key growth drivers?

-> Key growth drivers include rising demand for energy-efficient displays, expansion of the e-reader market, and adoption in retail for electronic shelf labels.

Which region dominates the market?

-> Asia-Pacific is the largest market, with China holding over 60% share, followed by China Taiwan.

What are the emerging trends?

-> Emerging trends include development of color EPD technology, flexible substrates, and integration into IoT devices and smart packaging.

E-paper Display (EPD) Market, Size, Trends, Business Strategies 2025-2032

Get Sample Report PDF for Exclusive Insights

Report Sample Includes

  • Table of Contents
  • List of Tables & Figures
  • Charts, Research Methodology, and more...

PDF Icon Download Sample Report PDF

Download Sample Report

Table of Content

Table of Contents
1 Research Methodology and Statistical Scope
1.1 Market Definition and Statistical Scope of E-paper Display (EPD)
1.2 Key Market Segments
1.2.1 E-paper Display (EPD) Segment by Type
1.2.2 E-paper Display (EPD) Segment by Application
1.3 Methodology & Sources of Information
1.3.1 Research Methodology
1.3.2 Research Process
1.3.3 Market Breakdown and Data Triangulation
1.3.4 Base Year
1.3.5 Report Assumptions & Caveats
2 E-paper Display (EPD) Market Overview
2.1 Global Market Overview
2.1.1 Global E-paper Display (EPD) Market Size (M USD) Estimates and Forecasts (2019-2032)
2.1.2 Global E-paper Display (EPD) Sales Estimates and Forecasts (2019-2032)
2.2 Market Segment Executive Summary
2.3 Global Market Size by Region
3 E-paper Display (EPD) Market Competitive Landscape
3.1 Global E-paper Display (EPD) Sales by Manufacturers (2019-2025)
3.2 Global E-paper Display (EPD) Revenue Market Share by Manufacturers (2019-2025)
3.3 E-paper Display (EPD) Market Share by Company Type (Tier 1, Tier 2, and Tier 3)
3.4 Global E-paper Display (EPD) Average Price by Manufacturers (2019-2025)
3.5 Manufacturers E-paper Display (EPD) Sales Sites, Area Served, Product Type
3.6 E-paper Display (EPD) Market Competitive Situation and Trends
3.6.1 E-paper Display (EPD) Market Concentration Rate
3.6.2 Global 5 and 10 Largest E-paper Display (EPD) Players Market Share by Revenue
3.6.3 Mergers & Acquisitions, Expansion
4 E-paper Display (EPD) Industry Chain Analysis
4.1 E-paper Display (EPD) Industry Chain Analysis
4.2 Market Overview of Key Raw Materials
4.3 Midstream Market Analysis
4.4 Downstream Customer Analysis
5 The Development and Dynamics of E-paper Display (EPD) Market
5.1 Key Development Trends
5.2 Driving Factors
5.3 Market Challenges
5.4 Market Restraints
5.5 Industry News
5.5.1 New Product Developments
5.5.2 Mergers & Acquisitions
5.5.3 Expansions
5.5.4 Collaboration/Supply Contracts
5.6 Industry Policies
6 E-paper Display (EPD) Market Segmentation by Type
6.1 Evaluation Matrix of Segment Market Development Potential (Type)
6.2 Global E-paper Display (EPD) Sales Market Share by Type (2019-2025)
6.3 Global E-paper Display (EPD) Market Size Market Share by Type (2019-2025)
6.4 Global E-paper Display (EPD) Price by Type (2019-2025)
7 E-paper Display (EPD) Market Segmentation by Application
7.1 Evaluation Matrix of Segment Market Development Potential (Application)
7.2 Global E-paper Display (EPD) Market Sales by Application (2019-2025)
7.3 Global E-paper Display (EPD) Market Size (M USD) by Application (2019-2025)
7.4 Global E-paper Display (EPD) Sales Growth Rate by Application (2019-2025)
8 E-paper Display (EPD) Market Consumption by Region
8.1 Global E-paper Display (EPD) Sales by Region
8.1.1 Global E-paper Display (EPD) Sales by Region
8.1.2 Global E-paper Display (EPD) Sales Market Share by Region
8.2 North America
8.2.1 North America E-paper Display (EPD) Sales by Country
8.2.2 U.S.
8.2.3 Canada
8.2.4 Mexico
8.3 Europe
8.3.1 Europe E-paper Display (EPD) Sales by Country
8.3.2 Germany
8.3.3 France
8.3.4 U.K.
8.3.5 Italy
8.3.6 Russia
8.4 Asia Pacific
8.4.1 Asia Pacific E-paper Display (EPD) Sales by Region
8.4.2 China
8.4.3 Japan
8.4.4 South Korea
8.4.5 India
8.4.6 Southeast Asia
8.5 South America
8.5.1 South America E-paper Display (EPD) Sales by Country
8.5.2 Brazil
8.5.3 Argentina
8.5.4 Columbia
8.6 Middle East and Africa
8.6.1 Middle East and Africa E-paper Display (EPD) Sales by Region
8.6.2 Saudi Arabia
8.6.3 UAE
8.6.4 Egypt
8.6.5 Nigeria
8.6.6 South Africa
9 E-paper Display (EPD) Market Production by Region
9.1 Global Production of E-paper Display (EPD) by Region (2019-2025)
9.2 Global E-paper Display (EPD) Revenue Market Share by Region (2019-2025)
9.3 Global E-paper Display (EPD) Production, Revenue, Price and Gross Margin (2019-2025)
9.4 North America E-paper Display (EPD) Production
9.4.1 North America E-paper Display (EPD) Production Growth Rate (2019-2025)
9.4.2 North America E-paper Display (EPD) Production, Revenue, Price and Gross Margin (2019-2025)
9.5 Europe E-paper Display (EPD) Production
9.5.1 Europe E-paper Display (EPD) Production Growth Rate (2019-2025)
9.5.2 Europe E-paper Display (EPD) Production, Revenue, Price and Gross Margin (2019-2025)
9.6 Japan E-paper Display (EPD) Production (2019-2025)
9.6.1 Japan E-paper Display (EPD) Production Growth Rate (2019-2025)
9.6.2 Japan E-paper Display (EPD) Production, Revenue, Price and Gross Margin (2019-2025)
9.7 China E-paper Display (EPD) Production (2019-2025)
9.7.1 China E-paper Display (EPD) Production Growth Rate (2019-2025)
9.7.2 China E-paper Display (EPD) Production, Revenue, Price and Gross Margin (2019-2025)
10 Key Companies Profile
10.1 E Ink
10.1.1 E Ink E-paper Display (EPD) Basic Information
10.1.2 E Ink E-paper Display (EPD) Product Overview
10.1.3 E Ink E-paper Display (EPD) Product Market Performance
10.1.4 E Ink Business Overview
10.1.5 E Ink E-paper Display (EPD) SWOT Analysis
10.1.6 E Ink Recent Developments
10.2 OED
10.2.1 OED E-paper Display (EPD) Basic Information
10.2.2 OED E-paper Display (EPD) Product Overview
10.2.3 OED E-paper Display (EPD) Product Market Performance
10.2.4 OED Business Overview
10.2.5 OED E-paper Display (EPD) SWOT Analysis
10.2.6 OED Recent Developments
10.3 Qualcomm
10.3.1 Qualcomm E-paper Display (EPD) Basic Information
10.3.2 Qualcomm E-paper Display (EPD) Product Overview
10.3.3 Qualcomm E-paper Display (EPD) Product Market Performance
10.3.4 Qualcomm E-paper Display (EPD) SWOT Analysis
10.3.5 Qualcomm Business Overview
10.3.6 Qualcomm Recent Developments
10.4 Liquavistar
10.4.1 Liquavistar E-paper Display (EPD) Basic Information
10.4.2 Liquavistar E-paper Display (EPD) Product Overview
10.4.3 Liquavistar E-paper Display (EPD) Product Market Performance
10.4.4 Liquavistar Business Overview
10.4.5 Liquavistar Recent Developments
10.5 Plastic Logic
10.5.1 Plastic Logic E-paper Display (EPD) Basic Information
10.5.2 Plastic Logic E-paper Display (EPD) Product Overview
10.5.3 Plastic Logic E-paper Display (EPD) Product Market Performance
10.5.4 Plastic Logic Business Overview
10.5.5 Plastic Logic Recent Developments
10.6 Pervisive Displays
10.6.1 Pervisive Displays E-paper Display (EPD) Basic Information
10.6.2 Pervisive Displays E-paper Display (EPD) Product Overview
10.6.3 Pervisive Displays E-paper Display (EPD) Product Market Performance
10.6.4 Pervisive Displays Business Overview
10.6.5 Pervisive Displays Recent Developments
10.7 LG Display
10.7.1 LG Display E-paper Display (EPD) Basic Information
10.7.2 LG Display E-paper Display (EPD) Product Overview
10.7.3 LG Display E-paper Display (EPD) Product Market Performance
10.7.4 LG Display Business Overview
10.7.5 LG Display Recent Developments
10.8 Gamma Dynamics
10.8.1 Gamma Dynamics E-paper Display (EPD) Basic Information
10.8.2 Gamma Dynamics E-paper Display (EPD) Product Overview
10.8.3 Gamma Dynamics E-paper Display (EPD) Product Market Performance
10.8.4 Gamma Dynamics Business Overview
10.8.5 Gamma Dynamics Recent Developments
10.9 ITRI
10.9.1 ITRI E-paper Display (EPD) Basic Information
10.9.2 ITRI E-paper Display (EPD) Product Overview
10.9.3 ITRI E-paper Display (EPD) Product Market Performance
10.9.4 ITRI Business Overview
10.9.5 ITRI Recent Developments
11 E-paper Display (EPD) Market Forecast by Region
11.1 Global E-paper Display (EPD) Market Size Forecast
11.2 Global E-paper Display (EPD) Market Forecast by Region
11.2.1 North America Market Size Forecast by Country
11.2.2 Europe E-paper Display (EPD) Market Size Forecast by Country
11.2.3 Asia Pacific E-paper Display (EPD) Market Size Forecast by Region
11.2.4 South America E-paper Display (EPD) Market Size Forecast by Country
11.2.5 Middle East and Africa Forecasted Consumption of E-paper Display (EPD) by Country
12 Forecast Market by Type and by Application (2025-2032)
12.1 Global E-paper Display (EPD) Market Forecast by Type (2025-2032)
12.1.1 Global Forecasted Sales of E-paper Display (EPD) by Type (2025-2032)
12.1.2 Global E-paper Display (EPD) Market Size Forecast by Type (2025-2032)
12.1.3 Global Forecasted Price of E-paper Display (EPD) by Type (2025-2032)
12.2 Global E-paper Display (EPD) Market Forecast by Application (2025-2032)
12.2.1 Global E-paper Display (EPD) Sales (K Units) Forecast by Application
12.2.2 Global E-paper Display (EPD) Market Size (M USD) Forecast by Application (2025-2032)
13 Conclusion and Key FindingsList of Tables
Table 1. Introduction of the Type
Table 2. Introduction of the Application
Table 3. Market Size (M USD) Segment Executive Summary
Table 4. E-paper Display (EPD) Market Size Comparison by Region (M USD)
Table 5. Global E-paper Display (EPD) Sales (K Units) by Manufacturers (2019-2025)
Table 6. Global E-paper Display (EPD) Sales Market Share by Manufacturers (2019-2025)
Table 7. Global E-paper Display (EPD) Revenue (M USD) by Manufacturers (2019-2025)
Table 8. Global E-paper Display (EPD) Revenue Share by Manufacturers (2019-2025)
Table 9. Company Type (Tier 1, Tier 2, and Tier 3) & (based on the Revenue in E-paper Display (EPD) as of 2022)
Table 10. Global Market E-paper Display (EPD) Average Price (USD/Unit) of Key Manufacturers (2019-2025)
Table 11. Manufacturers E-paper Display (EPD) Sales Sites and Area Served
Table 12. Manufacturers E-paper Display (EPD) Product Type
Table 13. Global E-paper Display (EPD) Manufacturers Market Concentration Ratio (CR5 and HHI)
Table 14. Mergers & Acquisitions, Expansion Plans
Table 15. Industry Chain Map of E-paper Display (EPD)
Table 16. Market Overview of Key Raw Materials
Table 17. Midstream Market Analysis
Table 18. Downstream Customer Analysis
Table 19. Key Development Trends
Table 20. Driving Factors
Table 21. E-paper Display (EPD) Market Challenges
Table 22. Global E-paper Display (EPD) Sales by Type (K Units)
Table 23. Global E-paper Display (EPD) Market Size by Type (M USD)
Table 24. Global E-paper Display (EPD) Sales (K Units) by Type (2019-2025)
Table 25. Global E-paper Display (EPD) Sales Market Share by Type (2019-2025)
Table 26. Global E-paper Display (EPD) Market Size (M USD) by Type (2019-2025)
Table 27. Global E-paper Display (EPD) Market Size Share by Type (2019-2025)
Table 28. Global E-paper Display (EPD) Price (USD/Unit) by Type (2019-2025)
Table 29. Global E-paper Display (EPD) Sales (K Units) by Application
Table 30. Global E-paper Display (EPD) Market Size by Application
Table 31. Global E-paper Display (EPD) Sales by Application (2019-2025) & (K Units)
Table 32. Global E-paper Display (EPD) Sales Market Share by Application (2019-2025)
Table 33. Global E-paper Display (EPD) Sales by Application (2019-2025) & (M USD)
Table 34. Global E-paper Display (EPD) Market Share by Application (2019-2025)
Table 35. Global E-paper Display (EPD) Sales Growth Rate by Application (2019-2025)
Table 36. Global E-paper Display (EPD) Sales by Region (2019-2025) & (K Units)
Table 37. Global E-paper Display (EPD) Sales Market Share by Region (2019-2025)
Table 38. North America E-paper Display (EPD) Sales by Country (2019-2025) & (K Units)
Table 39. Europe E-paper Display (EPD) Sales by Country (2019-2025) & (K Units)
Table 40. Asia Pacific E-paper Display (EPD) Sales by Region (2019-2025) & (K Units)
Table 41. South America E-paper Display (EPD) Sales by Country (2019-2025) & (K Units)
Table 42. Middle East and Africa E-paper Display (EPD) Sales by Region (2019-2025) & (K Units)
Table 43. Global E-paper Display (EPD) Production (K Units) by Region (2019-2025)
Table 44. Global E-paper Display (EPD) Revenue (US$ Million) by Region (2019-2025)
Table 45. Global E-paper Display (EPD) Revenue Market Share by Region (2019-2025)
Table 46. Global E-paper Display (EPD) Production (K Units), Revenue (US$ Million), Price (USD/Unit) and Gross Margin (2019-2025)
Table 47. North America E-paper Display (EPD) Production (K Units), Revenue (US$ Million), Price (USD/Unit) and Gross Margin (2019-2025)
Table 48. Europe E-paper Display (EPD) Production (K Units), Revenue (US$ Million), Price (USD/Unit) and Gross Margin (2019-2025)
Table 49. Japan E-paper Display (EPD) Production (K Units), Revenue (US$ Million), Price (USD/Unit) and Gross Margin (2019-2025)
Table 50. China E-paper Display (EPD) Production (K Units), Revenue (US$ Million), Price (USD/Unit) and Gross Margin (2019-2025)
Table 51. E Ink E-paper Display (EPD) Basic Information
Table 52. E Ink E-paper Display (EPD) Product Overview
Table 53. E Ink E-paper Display (EPD) Sales (K Units), Revenue (M USD), Price (USD/Unit) and Gross Margin (2019-2025)
Table 54. E Ink Business Overview
Table 55. E Ink E-paper Display (EPD) SWOT Analysis
Table 56. E Ink Recent Developments
Table 57. OED E-paper Display (EPD) Basic Information
Table 58. OED E-paper Display (EPD) Product Overview
Table 59. OED E-paper Display (EPD) Sales (K Units), Revenue (M USD), Price (USD/Unit) and Gross Margin (2019-2025)
Table 60. OED Business Overview
Table 61. OED E-paper Display (EPD) SWOT Analysis
Table 62. OED Recent Developments
Table 63. Qualcomm E-paper Display (EPD) Basic Information
Table 64. Qualcomm E-paper Display (EPD) Product Overview
Table 65. Qualcomm E-paper Display (EPD) Sales (K Units), Revenue (M USD), Price (USD/Unit) and Gross Margin (2019-2025)
Table 66. Qualcomm E-paper Display (EPD) SWOT Analysis
Table 67. Qualcomm Business Overview
Table 68. Qualcomm Recent Developments
Table 69. Liquavistar E-paper Display (EPD) Basic Information
Table 70. Liquavistar E-paper Display (EPD) Product Overview
Table 71. Liquavistar E-paper Display (EPD) Sales (K Units), Revenue (M USD), Price (USD/Unit) and Gross Margin (2019-2025)
Table 72. Liquavistar Business Overview
Table 73. Liquavistar Recent Developments
Table 74. Plastic Logic E-paper Display (EPD) Basic Information
Table 75. Plastic Logic E-paper Display (EPD) Product Overview
Table 76. Plastic Logic E-paper Display (EPD) Sales (K Units), Revenue (M USD), Price (USD/Unit) and Gross Margin (2019-2025)
Table 77. Plastic Logic Business Overview
Table 78. Plastic Logic Recent Developments
Table 79. Pervisive Displays E-paper Display (EPD) Basic Information
Table 80. Pervisive Displays E-paper Display (EPD) Product Overview
Table 81. Pervisive Displays E-paper Display (EPD) Sales (K Units), Revenue (M USD), Price (USD/Unit) and Gross Margin (2019-2025)
Table 82. Pervisive Displays Business Overview
Table 83. Pervisive Displays Recent Developments
Table 84. LG Display E-paper Display (EPD) Basic Information
Table 85. LG Display E-paper Display (EPD) Product Overview
Table 86. LG Display E-paper Display (EPD) Sales (K Units), Revenue (M USD), Price (USD/Unit) and Gross Margin (2019-2025)
Table 87. LG Display Business Overview
Table 88. LG Display Recent Developments
Table 89. Gamma Dynamics E-paper Display (EPD) Basic Information
Table 90. Gamma Dynamics E-paper Display (EPD) Product Overview
Table 91. Gamma Dynamics E-paper Display (EPD) Sales (K Units), Revenue (M USD), Price (USD/Unit) and Gross Margin (2019-2025)
Table 92. Gamma Dynamics Business Overview
Table 93. Gamma Dynamics Recent Developments
Table 94. ITRI E-paper Display (EPD) Basic Information
Table 95. ITRI E-paper Display (EPD) Product Overview
Table 96. ITRI E-paper Display (EPD) Sales (K Units), Revenue (M USD), Price (USD/Unit) and Gross Margin (2019-2025)
Table 97. ITRI Business Overview
Table 98. ITRI Recent Developments
Table 99. Global E-paper Display (EPD) Sales Forecast by Region (2025-2032) & (K Units)
Table 100. Global E-paper Display (EPD) Market Size Forecast by Region (2025-2032) & (M USD)
Table 101. North America E-paper Display (EPD) Sales Forecast by Country (2025-2032) & (K Units)
Table 102. North America E-paper Display (EPD) Market Size Forecast by Country (2025-2032) & (M USD)
Table 103. Europe E-paper Display (EPD) Sales Forecast by Country (2025-2032) & (K Units)
Table 104. Europe E-paper Display (EPD) Market Size Forecast by Country (2025-2032) & (M USD)
Table 105. Asia Pacific E-paper Display (EPD) Sales Forecast by Region (2025-2032) & (K Units)
Table 106. Asia Pacific E-paper Display (EPD) Market Size Forecast by Region (2025-2032) & (M USD)
Table 107. South America E-paper Display (EPD) Sales Forecast by Country (2025-2032) & (K Units)
Table 108. South America E-paper Display (EPD) Market Size Forecast by Country (2025-2032) & (M USD)
Table 109. Middle East and Africa E-paper Display (EPD) Consumption Forecast by Country (2025-2032) & (Units)
Table 110. Middle East and Africa E-paper Display (EPD) Market Size Forecast by Country (2025-2032) & (M USD)
Table 111. Global E-paper Display (EPD) Sales Forecast by Type (2025-2032) & (K Units)
Table 112. Global E-paper Display (EPD) Market Size Forecast by Type (2025-2032) & (M USD)
Table 113. Global E-paper Display (EPD) Price Forecast by Type (2025-2032) & (USD/Unit)
Table 114. Global E-paper Display (EPD) Sales (K Units) Forecast by Application (2025-2032)
Table 115. Global E-paper Display (EPD) Market Size Forecast by Application (2025-2032) & (M USD)
List of Figures
Figure 1. Product Picture of E-paper Display (EPD)
Figure 2. Data Triangulation
Figure 3. Key Caveats
Figure 4. Global E-paper Display (EPD) Market Size (M USD), 2019-2032
Figure 5. Global E-paper Display (EPD) Market Size (M USD) (2019-2032)
Figure 6. Global E-paper Display (EPD) Sales (K Units) & (2019-2032)
Figure 7. Evaluation Matrix of Segment Market Development Potential (Type)
Figure 8. Evaluation Matrix of Segment Market Development Potential (Application)
Figure 9. Evaluation Matrix of Regional Market Development Potential
Figure 10. E-paper Display (EPD) Market Size by Country (M USD)
Figure 11. E-paper Display (EPD) Sales Share by Manufacturers in 2023
Figure 12. Global E-paper Display (EPD) Revenue Share by Manufacturers in 2023
Figure 13. E-paper Display (EPD) Market Share by Company Type (Tier 1, Tier 2 and Tier 3): 2023
Figure 14. Global Market E-paper Display (EPD) Average Price (USD/Unit) of Key Manufacturers in 2023
Figure 15. The Global 5 and 10 Largest Players: Market Share by E-paper Display (EPD) Revenue in 2023
Figure 16. Evaluation Matrix of Segment Market Development Potential (Type)
Figure 17. Global E-paper Display (EPD) Market Share by Type
Figure 18. Sales Market Share of E-paper Display (EPD) by Type (2019-2025)
Figure 19. Sales Market Share of E-paper Display (EPD) by Type in 2023
Figure 20. Market Size Share of E-paper Display (EPD) by Type (2019-2025)
Figure 21. Market Size Market Share of E-paper Display (EPD) by Type in 2023
Figure 22. Evaluation Matrix of Segment Market Development Potential (Application)
Figure 23. Global E-paper Display (EPD) Market Share by Application
Figure 24. Global E-paper Display (EPD) Sales Market Share by Application (2019-2025)
Figure 25. Global E-paper Display (EPD) Sales Market Share by Application in 2023
Figure 26. Global E-paper Display (EPD) Market Share by Application (2019-2025)
Figure 27. Global E-paper Display (EPD) Market Share by Application in 2023
Figure 28. Global E-paper Display (EPD) Sales Growth Rate by Application (2019-2025)
Figure 29. Global E-paper Display (EPD) Sales Market Share by Region (2019-2025)
Figure 30. North America E-paper Display (EPD) Sales and Growth Rate (2019-2025) & (K Units)
Figure 31. North America E-paper Display (EPD) Sales Market Share by Country in 2023
Figure 32. U.S. E-paper Display (EPD) Sales and Growth Rate (2019-2025) & (K Units)
Figure 33. Canada E-paper Display (EPD) Sales (K Units) and Growth Rate (2019-2025)
Figure 34. Mexico E-paper Display (EPD) Sales (Units) and Growth Rate (2019-2025)
Figure 35. Europe E-paper Display (EPD) Sales and Growth Rate (2019-2025) & (K Units)
Figure 36. Europe E-paper Display (EPD) Sales Market Share by Country in 2023
Figure 37. Germany E-paper Display (EPD) Sales and Growth Rate (2019-2025) & (K Units)
Figure 38. France E-paper Display (EPD) Sales and Growth Rate (2019-2025) & (K Units)
Figure 39. U.K. E-paper Display (EPD) Sales and Growth Rate (2019-2025) & (K Units)
Figure 40. Italy E-paper Display (EPD) Sales and Growth Rate (2019-2025) & (K Units)
Figure 41. Russia E-paper Display (EPD) Sales and Growth Rate (2019-2025) & (K Units)
Figure 42. Asia Pacific E-paper Display (EPD) Sales and Growth Rate (K Units)
Figure 43. Asia Pacific E-paper Display (EPD) Sales Market Share by Region in 2023
Figure 44. China E-paper Display (EPD) Sales and Growth Rate (2019-2025) & (K Units)
Figure 45. Japan E-paper Display (EPD) Sales and Growth Rate (2019-2025) & (K Units)
Figure 46. South Korea E-paper Display (EPD) Sales and Growth Rate (2019-2025) & (K Units)
Figure 47. India E-paper Display (EPD) Sales and Growth Rate (2019-2025) & (K Units)
Figure 48. Southeast Asia E-paper Display (EPD) Sales and Growth Rate (2019-2025) & (K Units)
Figure 49. South America E-paper Display (EPD) Sales and Growth Rate (K Units)
Figure 50. South America E-paper Display (EPD) Sales Market Share by Country in 2023
Figure 51. Brazil E-paper Display (EPD) Sales and Growth Rate (2019-2025) & (K Units)
Figure 52. Argentina E-paper Display (EPD) Sales and Growth Rate (2019-2025) & (K Units)
Figure 53. Columbia E-paper Display (EPD) Sales and Growth Rate (2019-2025) & (K Units)
Figure 54. Middle East and Africa E-paper Display (EPD) Sales and Growth Rate (K Units)
Figure 55. Middle East and Africa E-paper Display (EPD) Sales Market Share by Region in 2023
Figure 56. Saudi Arabia E-paper Display (EPD) Sales and Growth Rate (2019-2025) & (K Units)
Figure 57. UAE E-paper Display (EPD) Sales and Growth Rate (2019-2025) & (K Units)
Figure 58. Egypt E-paper Display (EPD) Sales and Growth Rate (2019-2025) & (K Units)
Figure 59. Nigeria E-paper Display (EPD) Sales and Growth Rate (2019-2025) & (K Units)
Figure 60. South Africa E-paper Display (EPD) Sales and Growth Rate (2019-2025) & (K Units)
Figure 61. Global E-paper Display (EPD) Production Market Share by Region (2019-2025)
Figure 62. North America E-paper Display (EPD) Production (K Units) Growth Rate (2019-2025)
Figure 63. Europe E-paper Display (EPD) Production (K Units) Growth Rate (2019-2025)
Figure 64. Japan E-paper Display (EPD) Production (K Units) Growth Rate (2019-2025)
Figure 65. China E-paper Display (EPD) Production (K Units) Growth Rate (2019-2025)
Figure 66. Global E-paper Display (EPD) Sales Forecast by Volume (2019-2032) & (K Units)
Figure 67. Global E-paper Display (EPD) Market Size Forecast by Value (2019-2032) & (M USD)
Figure 68. Global E-paper Display (EPD) Sales Market Share Forecast by Type (2025-2032)
Figure 69. Global E-paper Display (EPD) Market Share Forecast by Type (2025-2032)
Figure 70. Global E-paper Display (EPD) Sales Forecast by Application (2025-2032)
Figure 71. Global E-paper Display (EPD) Market Share Forecast by Application (2025-2032)