Dual-pass Opacity Monitor Market, Trends, Business Strategies 2025-2032

Dual-pass Opacity Monitor Market was valued at 596 million in 2024 and is projected to reach US$ 946 million by 2032, at a CAGR of 6.9% during the forecast period

PDF Icon Download Sample Report PDF
  • Quick Dispatch

    All Orders

  • Secure Payment

    100% Secure Payment

Price range: $1,500.00 through $4,250.00

Clear

MARKET INSIGHTS

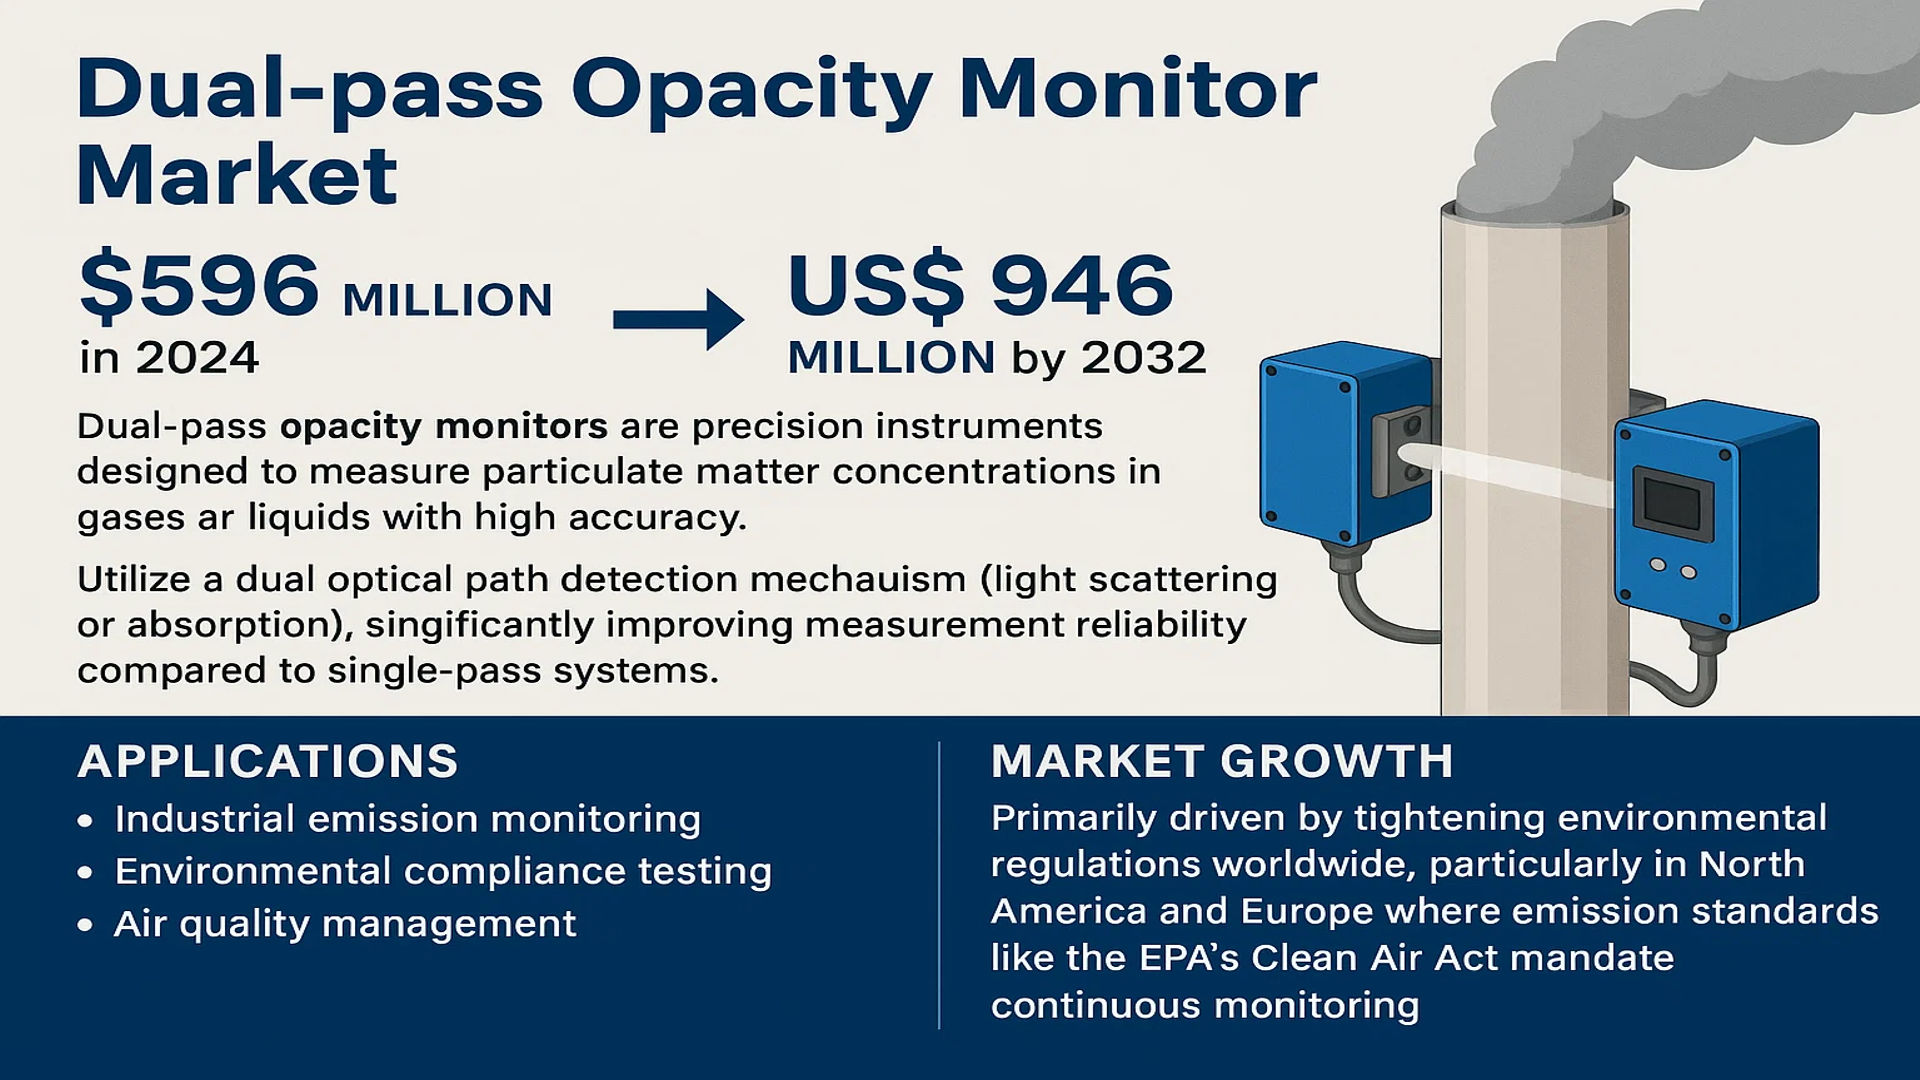
The global Dual-pass Opacity Monitor Market was valued at 596 million in 2024 and is projected to reach US$ 946 million by 2032, at a CAGR of 6.9% during the forecast period.

Dual-pass opacity monitors are precision instruments designed to measure particulate matter concentrations in gases or liquids with high accuracy. These devices utilize a dual optical path detection mechanism (light scattering or absorption), significantly improving measurement reliability compared to single-pass systems. They play a critical role in industrial emission monitoring, environmental compliance testing, and air quality management across sectors like power generation, manufacturing, and waste incineration.

Market growth is primarily driven by tightening environmental regulations worldwide, particularly in North America and Europe where emission standards like the EPA’s Clean Air Act mandate continuous monitoring. The light scattering method segment currently dominates the technology landscape due to its superior sensitivity for fine particulate detection. Meanwhile, Asia-Pacific emerges as the fastest-growing regional market, with China’s industrial expansion and air pollution control initiatives contributing significantly to demand. Key industry players including AMETEK Land, SICK, and Durag are expanding their product portfolios with advanced IoT-enabled monitors to capitalize on this growth.

Dual-pass Opacity Monitor Market

MARKET DYNAMICS

MARKET DRIVERS

Stringent Emission Regulations Fuel Adoption of Dual-Pass Opacity Monitors

The global push towards cleaner air quality has led to the implementation of stringent emission standards across industries, significantly driving demand for precise monitoring solutions. Governments worldwide are enforcing lower particulate matter (PM) thresholds, with many regions now requiring continuous opacity monitoring for compliance. For example, recent updates to industrial emission standards now mandate real-time particulate monitoring in power plants, cement factories, and chemical processing units. This regulatory pressure compels industries to adopt advanced dual-pass opacity monitors that provide the required measurement accuracy and reliability.

Growing Industrialization in Emerging Markets Creates Sustained Demand

Rapid industrialization across developing economies presents a significant growth opportunity for the dual-pass opacity monitor market. Regions like Asia-Pacific are witnessing unprecedented industrial expansion, particularly in sectors that generate substantial particulate emissions. Manufacturing output in these markets has grown significantly, necessitating advanced monitoring equipment to comply with both local and international environmental standards. The superior accuracy of dual-pass technology compared to single-pass systems makes it the preferred choice for industries facing increasing regulatory scrutiny.

Technological Advancements Enhance Performance and Reliability

Continuous innovations in optical measurement technologies are elevating the capabilities of dual-pass opacity monitors. Modern systems now incorporate advanced signal processing algorithms, improved optical components, and enhanced self-diagnostic features. These technological improvements result in higher measurement precision, reduced maintenance requirements, and better performance in challenging industrial environments. The development of smart monitoring systems with predictive maintenance capabilities further increases their value proposition for industrial operators.

MARKET RESTRAINTS

High Initial Costs Limit Adoption Among Small-Scale Industries

While dual-pass opacity monitors offer superior performance, their higher price point compared to conventional monitoring solutions presents a significant adoption barrier. The sophisticated optical systems and advanced electronics required for dual-pass measurement significantly increase manufacturing costs. For small and medium enterprises operating with limited capital budgets, this cost differential often makes basic monitoring systems more attractive despite their lower accuracy.

Additional Challenges

Complex Installation and Maintenance Requirements
The precise alignment required for dual-pass measurement systems increases installation complexity and ongoing maintenance needs. Unlike simpler single-pass systems, dual-pass monitors require careful optical path alignment and regular calibration to maintain measurement accuracy. This creates operational challenges in harsh industrial environments where equipment may be subject to vibration, temperature variations, and particulate buildup.

Competition from Alternative Monitoring Technologies
Emerging particulate monitoring technologies using different measurement principles pose competitive challenges. Some newer systems offer comparable accuracy at potentially lower costs, creating price pressure on traditional opacity monitoring solutions. This dynamic may slow market growth for dual-pass systems in cost-sensitive applications.

MARKET OPPORTUNITIES

Expansion of Continuous Emission Monitoring Systems (CEMS) Creates New Applications

The growing adoption of comprehensive CEMS in industrial facilities presents significant opportunities for dual-pass opacity monitor manufacturers. These integrated monitoring solutions increasingly require high-accuracy particulate measurement components. The ability of dual-pass systems to provide reliable, low-maintenance monitoring makes them ideal for integration into these complex systems. Recent regulatory trends favoring continuous monitoring over periodic testing further strengthen this opportunity.

Emerging Applications in Ambient Air Quality Monitoring Expand Market Potential

While traditionally focused on industrial emissions, dual-pass opacity technology is finding new applications in ambient air quality monitoring networks. The need for more precise particulate measurement in urban environments and near industrial zones creates demand for advanced monitoring solutions. These applications benefit from the technology’s ability to maintain accuracy across varying environmental conditions.

Strategic Partnerships with Regulatory Bodies Create Market Access Opportunities

Collaborations between monitor manufacturers and environmental agencies present pathways for market expansion. Many regulatory bodies are actively seeking input from technology providers as they develop new monitoring standards and protocols. Companies that establish these strategic relationships can influence future regulatory requirements while positioning their products as preferred solutions.

MARKET CHALLENGES

Technical Limitations in Extreme Operating Conditions

Dual-pass opacity monitors face significant performance challenges in certain industrial environments. High-temperature exhaust streams, heavily laden with particulates, can degrade optical components over time. Similarly, applications involving corrosive gases or high humidity levels may compromise measurement accuracy and equipment longevity. These limitations constrain adoption in some of the most challenging industrial applications.

Other Challenges

Data Integration and Compatibility Issues
The increasing digitization of environmental monitoring creates integration challenges for legacy opacity monitoring systems. Ensuring seamless data transfer between monitors and modern plant information systems requires continuous software updates and hardware modifications. This evolving integration landscape adds complexity to product development and deployment.

Intense Global Competition Pressures Profit Margins
The opacity monitoring market has become increasingly competitive, with manufacturers facing price pressure from both established players and new market entrants. This competitive intensity makes it challenging to maintain profitability while continuing to invest in research and development. Companies must balance cost optimization with the need to innovate and differentiate their offerings.

DUAL-PASS OPACITY MONITOR MARKET TRENDS

Advancements in Measurement Technologies to Drive Market Growth

The global dual-pass opacity monitor market is experiencing significant growth, driven by technological advancements in particulate matter measurement. Manufacturers are increasingly adopting light scattering and absorption-based technologies to improve measurement accuracy and reliability. The development of integrated IoT-enabled monitoring systems has further enhanced real-time data collection and analysis, making these devices indispensable for environmental compliance and industrial process control. Recent improvements in optical sensor durability and calibration stability have extended product lifespans by approximately 30%, reducing total cost of ownership for end-users.

Other Trends

Stringent Environmental Regulations

Governments worldwide are implementing stricter emission norms, creating sustained demand for high-precision opacity monitoring solutions. The EPA’s Clean Air Act amendments and equivalent EU directives have mandated continuous emission monitoring systems (CEMS) across power plants and manufacturing facilities. This regulatory push has increased adoption rates by 15-20% annually in regulated industries, with particularly strong growth in Asia-Pacific regions where industrialization continues rapidly alongside environmental policy development.

Industrial Digitization and Smart Factory Integration

The Industry 4.0 revolution is transforming how opacity monitors are deployed and utilized. Modern dual-pass systems now feature cloud connectivity and predictive maintenance capabilities, allowing for more efficient plant operations. Major manufacturers report that smart monitoring solutions can reduce unplanned downtime by up to 25% in continuous process industries. The integration of AI-powered analytics is further enhancing the ability to detect particulate matter patterns and predict emission events before they occur, creating new value propositions for industrial users.

Expansion of Application Areas

While traditional applications in power generation and cement manufacturing continue to dominate, new use cases are emerging in waste incineration, chemical processing, and semiconductor manufacturing. The transportation sector is also adopting portable opacity monitors for vehicle emissions testing. This diversification is expected to contribute significantly to market growth, with niche applications projected to account for nearly 20% of total revenue by 2032. The development of compact, lower-cost models has further enabled this expansion into new verticals.

COMPETITIVE LANDSCAPE

Key Industry Players

Technological Innovation and Strategic Expansion Define Market Competition

The global dual-pass opacity monitor market is characterized by a moderately fragmented competitive landscape, with established multinational corporations competing alongside regional specialists. Acoem and SICK AG currently lead the market, collectively accounting for approximately 28% of global revenue in 2024. Their dominance stems from comprehensive product portfolios covering both light scattering and absorption technologies, coupled with extensive service networks across North America and Europe.

While European manufacturers like Durag and AMETEK Land maintain strong positions in industrial emission monitoring applications, Asian players such as Shanghai Shouli Industry and Juguang Technology are rapidly gaining traction through competitive pricing and localized support. This regional specialization creates distinct competitive dynamics across different geographical markets.

The market has witnessed increased consolidation activity in recent years, with larger firms acquiring specialized technology providers to enhance their measurement capabilities. A notable example includes AMETEK Land’s 2023 acquisition of a UK-based optical measurement specialist, strengthening its position in the energy sector. Such strategic moves are reshaping competitive balances while accelerating technological advancements.

Emerging competition comes from digitally-native monitoring solution providers integrating IoT capabilities with traditional opacity measurement. Companies like Redkoh and HNL Systems are differentiating themselves through cloud-based data analytics platforms, creating new value propositions beyond hardware accuracy alone. This evolution suggests future competition will increasingly center on data integration capabilities rather than purely on measurement precision.

List of Key Dual-pass Opacity Monitor Manufacturers

Segment Analysis:

By Type

Light Scattering Method Dominates the Market Due to Superior Accuracy in Particulate Measurement

The market is segmented based on type into:

  • Light Scattering Method
    • Subtypes: Forward Scattering, Backward Scattering, and others
  • Light Absorption Method

By Application

Industrial Emission Monitoring Segment Leads Due to Strict Government Regulations Worldwide

The market is segmented based on application into:

  • Industrial Emission Monitoring
  • Ambient Air Quality Monitoring
  • Transportation and Energy
  • Others

By End User

Environmental Agencies Hold Significant Share as Key Regulators of Air Quality Standards

The market is segmented based on end user into:

  • Government and Environmental Agencies
  • Industrial Facilities
  • Research Institutions
  • Others

Regional Analysis: Dual-pass Opacity Monitor Market

Asia-Pacific
The Asia-Pacific region dominates the global dual-pass opacity monitor market, driven by rapid industrialization and strict enforcement of air quality regulations in countries like China and India. China holds the largest market share, with government initiatives such as the Air Pollution Prevention and Control Action Plan mandating emission monitoring across key industries. The growing adoption of light scattering method opacity monitors in power plants and manufacturing facilities, coupled with increasing investment in smart city projects, fuels market expansion. India’s expanding cement and chemical industries further contribute to demand. However, price sensitivity remains a challenge, pushing manufacturers to develop cost-effective solutions without compromising accuracy.

North America
Stringent environmental regulations, particularly the U.S. EPA’s Clean Air Act, drive the adoption of high-precision dual-pass opacity monitors in industrial emission monitoring applications. The U.S. market benefits from technological advancements by key players like AMETEK Land and SICK, which focus on integrating AI-driven analytics for real-time data interpretation. Canada’s oil & gas sector also contributes significantly to market growth, with opacity monitors being widely used in refineries. While the region prioritizes compliance and accuracy, the shift toward remote monitoring solutions presents new opportunities for innovation and efficiency.

Europe
Europe’s market growth is propelled by stringent EU emission standards (e.g., Industrial Emissions Directive) and the increasing focus on sustainable industrial practices. Germany and the U.K. lead regional demand, with industries such as automotive and pharmaceuticals adopting dual-pass monitors to adhere to environmental norms. Water-based and low-maintenance opacity monitors are gaining traction, particularly in countries enforcing circular economy principles. Additionally, partnerships between manufacturers and regulatory bodies ensure continuous product upgrades, making Europe a hub for advanced monitoring solutions.

South America
The market in South America is emerging, with Brazil and Argentina showing moderate growth due to expanding mining and energy sectors. While regulatory frameworks are evolving, inconsistent enforcement limits widespread adoption. The region’s preference for economical monitoring solutions, however, has led to the popularity of refurbished and locally manufactured devices. Investments in infrastructure and rising environmental awareness provide long-term opportunities, though economic volatility remains a hurdle for large-scale deployment of high-end opacity monitors.

Middle East & Africa
Demand for dual-pass opacity monitors in the Middle East is primarily driven by the oil & gas and petrochemical industries, with Saudi Arabia and the UAE leading the market. Strict emission norms in free zones and industrial cities are accelerating adoption. Africa’s market, though nascent, shows potential with increasing mining activities in South Africa and Nigeria. Funding constraints and lack of technical expertise hinder faster growth, but foreign investments in industrial projects are expected to boost demand for advanced monitoring systems in the coming years.

Report Scope

This market research report provides a comprehensive analysis of the global and regional Dual-pass Opacity Monitor markets, covering the forecast period 2024–2032. It offers detailed insights into market dynamics, technological advancements, competitive landscape, and key trends shaping the industry.

Key focus areas of the report include:

  • Market Size & Forecast: Historical data and future projections for revenue, unit shipments, and market value across major regions and segments. The global market was valued at USD 596 million in 2024 and is projected to reach USD 946 million by 2032, growing at a CAGR of 6.9%.
  • Segmentation Analysis: Detailed breakdown by product type (Light Scattering Method, Light Absorption Method), application (Industrial Emission Monitoring, Ambient Air Quality Monitoring, Transportation and Energy, Others), and end-user industry.
  • Regional Outlook: Insights into market performance across North America, Europe, Asia-Pacific, Latin America, and the Middle East & Africa. The U.S. and China are key markets with significant growth potential.
  • Competitive Landscape: Profiles of leading market participants including Acoem, SICK, Durag, AMETEK Land, and LISUN Electronics, covering their product portfolios, market share, and strategic initiatives.
  • Technology Trends & Innovation: Assessment of emerging measurement technologies, integration with IoT platforms, and advancements in optical sensing techniques.
  • Market Drivers & Restraints: Evaluation of factors such as stringent environmental regulations, industrial emission standards, and technological limitations affecting market growth.
  • Stakeholder Analysis: Strategic insights for equipment manufacturers, environmental monitoring agencies, industrial facilities, and regulatory bodies.

The report employs primary and secondary research methodologies, including expert interviews and analysis of verified market data, to ensure accuracy and reliability.

FREQUENTLY ASKED QUESTIONS:

What is the current market size of Global Dual-pass Opacity Monitor Market?

-> Dual-pass Opacity Monitor Market was valued at 596 million in 2024 and is projected to reach US$ 946 million by 2032, at a CAGR of 6.9% during the forecast period.

Which key companies operate in Global Dual-pass Opacity Monitor Market?

-> Key players include Acoem, SICK, Durag, AMETEK Land, LISUN Electronics, CODEL, and MRU Instruments, among others.

What are the key growth drivers?

-> Key growth drivers include stringent environmental regulations, increasing industrial emissions monitoring requirements, and technological advancements in optical measurement systems.

Which region dominates the market?

-> North America currently leads in market share, while Asia-Pacific is expected to witness the fastest growth during the forecast period.

What are the emerging trends?

-> Emerging trends include integration of AI for predictive maintenance, development of portable monitoring solutions, and increasing adoption in emerging economies.

Dual-pass Opacity Monitor Market, Trends, Business Strategies 2025-2032

Get Sample Report PDF for Exclusive Insights

Report Sample Includes

  • Table of Contents
  • List of Tables & Figures
  • Charts, Research Methodology, and more...
PDF Icon Download Sample Report PDF
SKU: 7b45d39c5d16
Category:

Download Sample Report

Table of Content

1 Introduction to Research & Analysis Reports
1.1 Dual-pass Opacity Monitor Market Definition
1.2 Market Segments
1.2.1 Segment by Type
1.2.2 Segment by Application
1.3 Global Dual-pass Opacity Monitor Market Overview
1.4 Features & Benefits of This Report
1.5 Methodology & Sources of Information
1.5.1 Research Methodology
1.5.2 Research Process
1.5.3 Base Year
1.5.4 Report Assumptions & Caveats
2 Global Dual-pass Opacity Monitor Overall Market Size
2.1 Global Dual-pass Opacity Monitor Market Size: 2024 VS 2032
2.2 Global Dual-pass Opacity Monitor Market Size, Prospects & Forecasts: 2020-2032
2.3 Global Dual-pass Opacity Monitor Sales: 2020-2032
3 Company Landscape
3.1 Top Dual-pass Opacity Monitor Players in Global Market
3.2 Top Global Dual-pass Opacity Monitor Companies Ranked by Revenue
3.3 Global Dual-pass Opacity Monitor Revenue by Companies
3.4 Global Dual-pass Opacity Monitor Sales by Companies
3.5 Global Dual-pass Opacity Monitor Price by Manufacturer (2020-2025)
3.6 Top 3 and Top 5 Dual-pass Opacity Monitor Companies in Global Market, by Revenue in 2024
3.7 Global Manufacturers Dual-pass Opacity Monitor Product Type
3.8 Tier 1, Tier 2, and Tier 3 Dual-pass Opacity Monitor Players in Global Market
3.8.1 List of Global Tier 1 Dual-pass Opacity Monitor Companies
3.8.2 List of Global Tier 2 and Tier 3 Dual-pass Opacity Monitor Companies
4 Sights by Product
4.1 Overview
4.1.1 Segment by Type – Global Dual-pass Opacity Monitor Market Size Markets, 2024 & 2032
4.1.2 Light Scattering Method
4.1.3 Light Absorption Method
4.2 Segment by Type – Global Dual-pass Opacity Monitor Revenue & Forecasts
4.2.1 Segment by Type – Global Dual-pass Opacity Monitor Revenue, 2020-2025
4.2.2 Segment by Type – Global Dual-pass Opacity Monitor Revenue, 2026-2032
4.2.3 Segment by Type – Global Dual-pass Opacity Monitor Revenue Market Share, 2020-2032
4.3 Segment by Type – Global Dual-pass Opacity Monitor Sales & Forecasts
4.3.1 Segment by Type – Global Dual-pass Opacity Monitor Sales, 2020-2025
4.3.2 Segment by Type – Global Dual-pass Opacity Monitor Sales, 2026-2032
4.3.3 Segment by Type – Global Dual-pass Opacity Monitor Sales Market Share, 2020-2032
4.4 Segment by Type – Global Dual-pass Opacity Monitor Price (Manufacturers Selling Prices), 2020-2032
5 Sights by Application
5.1 Overview
5.1.1 Segment by Application – Global Dual-pass Opacity Monitor Market Size, 2024 & 2032
5.1.2 Industrial Emission Monitoring
5.1.3 Ambient Air Quality Monitoring
5.1.4 Transportation and Energy
5.1.5 Others
5.2 Segment by Application – Global Dual-pass Opacity Monitor Revenue & Forecasts
5.2.1 Segment by Application – Global Dual-pass Opacity Monitor Revenue, 2020-2025
5.2.2 Segment by Application – Global Dual-pass Opacity Monitor Revenue, 2026-2032
5.2.3 Segment by Application – Global Dual-pass Opacity Monitor Revenue Market Share, 2020-2032
5.3 Segment by Application – Global Dual-pass Opacity Monitor Sales & Forecasts
5.3.1 Segment by Application – Global Dual-pass Opacity Monitor Sales, 2020-2025
5.3.2 Segment by Application – Global Dual-pass Opacity Monitor Sales, 2026-2032
5.3.3 Segment by Application – Global Dual-pass Opacity Monitor Sales Market Share, 2020-2032
5.4 Segment by Application – Global Dual-pass Opacity Monitor Price (Manufacturers Selling Prices), 2020-2032
6 Sights by Region
6.1 By Region – Global Dual-pass Opacity Monitor Market Size, 2024 & 2032
6.2 By Region – Global Dual-pass Opacity Monitor Revenue & Forecasts
6.2.1 By Region – Global Dual-pass Opacity Monitor Revenue, 2020-2025
6.2.2 By Region – Global Dual-pass Opacity Monitor Revenue, 2026-2032
6.2.3 By Region – Global Dual-pass Opacity Monitor Revenue Market Share, 2020-2032
6.3 By Region – Global Dual-pass Opacity Monitor Sales & Forecasts
6.3.1 By Region – Global Dual-pass Opacity Monitor Sales, 2020-2025
6.3.2 By Region – Global Dual-pass Opacity Monitor Sales, 2026-2032
6.3.3 By Region – Global Dual-pass Opacity Monitor Sales Market Share, 2020-2032
6.4 North America
6.4.1 By Country – North America Dual-pass Opacity Monitor Revenue, 2020-2032
6.4.2 By Country – North America Dual-pass Opacity Monitor Sales, 2020-2032
6.4.3 United States Dual-pass Opacity Monitor Market Size, 2020-2032
6.4.4 Canada Dual-pass Opacity Monitor Market Size, 2020-2032
6.4.5 Mexico Dual-pass Opacity Monitor Market Size, 2020-2032
6.5 Europe
6.5.1 By Country – Europe Dual-pass Opacity Monitor Revenue, 2020-2032
6.5.2 By Country – Europe Dual-pass Opacity Monitor Sales, 2020-2032
6.5.3 Germany Dual-pass Opacity Monitor Market Size, 2020-2032
6.5.4 France Dual-pass Opacity Monitor Market Size, 2020-2032
6.5.5 U.K. Dual-pass Opacity Monitor Market Size, 2020-2032
6.5.6 Italy Dual-pass Opacity Monitor Market Size, 2020-2032
6.5.7 Russia Dual-pass Opacity Monitor Market Size, 2020-2032
6.5.8 Nordic Countries Dual-pass Opacity Monitor Market Size, 2020-2032
6.5.9 Benelux Dual-pass Opacity Monitor Market Size, 2020-2032
6.6 Asia
6.6.1 By Region – Asia Dual-pass Opacity Monitor Revenue, 2020-2032
6.6.2 By Region – Asia Dual-pass Opacity Monitor Sales, 2020-2032
6.6.3 China Dual-pass Opacity Monitor Market Size, 2020-2032
6.6.4 Japan Dual-pass Opacity Monitor Market Size, 2020-2032
6.6.5 South Korea Dual-pass Opacity Monitor Market Size, 2020-2032
6.6.6 Southeast Asia Dual-pass Opacity Monitor Market Size, 2020-2032
6.6.7 India Dual-pass Opacity Monitor Market Size, 2020-2032
6.7 South America
6.7.1 By Country – South America Dual-pass Opacity Monitor Revenue, 2020-2032
6.7.2 By Country – South America Dual-pass Opacity Monitor Sales, 2020-2032
6.7.3 Brazil Dual-pass Opacity Monitor Market Size, 2020-2032
6.7.4 Argentina Dual-pass Opacity Monitor Market Size, 2020-2032
6.8 Middle East & Africa
6.8.1 By Country – Middle East & Africa Dual-pass Opacity Monitor Revenue, 2020-2032
6.8.2 By Country – Middle East & Africa Dual-pass Opacity Monitor Sales, 2020-2032
6.8.3 Turkey Dual-pass Opacity Monitor Market Size, 2020-2032
6.8.4 Israel Dual-pass Opacity Monitor Market Size, 2020-2032
6.8.5 Saudi Arabia Dual-pass Opacity Monitor Market Size, 2020-2032
6.8.6 UAE Dual-pass Opacity Monitor Market Size, 2020-2032
7 Manufacturers & Brands Profiles
7.1 Acoem
7.1.1 Acoem Company Summary
7.1.2 Acoem Business Overview
7.1.3 Acoem Dual-pass Opacity Monitor Major Product Offerings
7.1.4 Acoem Dual-pass Opacity Monitor Sales and Revenue in Global (2020-2025)
7.1.5 Acoem Key News & Latest Developments
7.2 SICK
7.2.1 SICK Company Summary
7.2.2 SICK Business Overview
7.2.3 SICK Dual-pass Opacity Monitor Major Product Offerings
7.2.4 SICK Dual-pass Opacity Monitor Sales and Revenue in Global (2020-2025)
7.2.5 SICK Key News & Latest Developments
7.3 Durag
7.3.1 Durag Company Summary
7.3.2 Durag Business Overview
7.3.3 Durag Dual-pass Opacity Monitor Major Product Offerings
7.3.4 Durag Dual-pass Opacity Monitor Sales and Revenue in Global (2020-2025)
7.3.5 Durag Key News & Latest Developments
7.4 AMETEK Land
7.4.1 AMETEK Land Company Summary
7.4.2 AMETEK Land Business Overview
7.4.3 AMETEK Land Dual-pass Opacity Monitor Major Product Offerings
7.4.4 AMETEK Land Dual-pass Opacity Monitor Sales and Revenue in Global (2020-2025)
7.4.5 AMETEK Land Key News & Latest Developments
7.5 LISUN Electronics
7.5.1 LISUN Electronics Company Summary
7.5.2 LISUN Electronics Business Overview
7.5.3 LISUN Electronics Dual-pass Opacity Monitor Major Product Offerings
7.5.4 LISUN Electronics Dual-pass Opacity Monitor Sales and Revenue in Global (2020-2025)
7.5.5 LISUN Electronics Key News & Latest Developments
7.6 CODEL
7.6.1 CODEL Company Summary
7.6.2 CODEL Business Overview
7.6.3 CODEL Dual-pass Opacity Monitor Major Product Offerings
7.6.4 CODEL Dual-pass Opacity Monitor Sales and Revenue in Global (2020-2025)
7.6.5 CODEL Key News & Latest Developments
7.7 HNL Systems
7.7.1 HNL Systems Company Summary
7.7.2 HNL Systems Business Overview
7.7.3 HNL Systems Dual-pass Opacity Monitor Major Product Offerings
7.7.4 HNL Systems Dual-pass Opacity Monitor Sales and Revenue in Global (2020-2025)
7.7.5 HNL Systems Key News & Latest Developments
7.8 Redkoh
7.8.1 Redkoh Company Summary
7.8.2 Redkoh Business Overview
7.8.3 Redkoh Dual-pass Opacity Monitor Major Product Offerings
7.8.4 Redkoh Dual-pass Opacity Monitor Sales and Revenue in Global (2020-2025)
7.8.5 Redkoh Key News & Latest Developments
7.9 Environmental Monitor Service
7.9.1 Environmental Monitor Service Company Summary
7.9.2 Environmental Monitor Service Business Overview
7.9.3 Environmental Monitor Service Dual-pass Opacity Monitor Major Product Offerings
7.9.4 Environmental Monitor Service Dual-pass Opacity Monitor Sales and Revenue in Global (2020-2025)
7.9.5 Environmental Monitor Service Key News & Latest Developments
7.10 MRU Instruments
7.10.1 MRU Instruments Company Summary
7.10.2 MRU Instruments Business Overview
7.10.3 MRU Instruments Dual-pass Opacity Monitor Major Product Offerings
7.10.4 MRU Instruments Dual-pass Opacity Monitor Sales and Revenue in Global (2020-2025)
7.10.5 MRU Instruments Key News & Latest Developments
7.11 Shanghai Shouli Industry
7.11.1 Shanghai Shouli Industry Company Summary
7.11.2 Shanghai Shouli Industry Business Overview
7.11.3 Shanghai Shouli Industry Dual-pass Opacity Monitor Major Product Offerings
7.11.4 Shanghai Shouli Industry Dual-pass Opacity Monitor Sales and Revenue in Global (2020-2025)
7.11.5 Shanghai Shouli Industry Key News & Latest Developments
7.12 Shanghai Precision Instruments
7.12.1 Shanghai Precision Instruments Company Summary
7.12.2 Shanghai Precision Instruments Business Overview
7.12.3 Shanghai Precision Instruments Dual-pass Opacity Monitor Major Product Offerings
7.12.4 Shanghai Precision Instruments Dual-pass Opacity Monitor Sales and Revenue in Global (2020-2025)
7.12.5 Shanghai Precision Instruments Key News & Latest Developments
7.13 Juguang Technology
7.13.1 Juguang Technology Company Summary
7.13.2 Juguang Technology Business Overview
7.13.3 Juguang Technology Dual-pass Opacity Monitor Major Product Offerings
7.13.4 Juguang Technology Dual-pass Opacity Monitor Sales and Revenue in Global (2020-2025)
7.13.5 Juguang Technology Key News & Latest Developments
7.14 Yuxing Technology
7.14.1 Yuxing Technology Company Summary
7.14.2 Yuxing Technology Business Overview
7.14.3 Yuxing Technology Dual-pass Opacity Monitor Major Product Offerings
7.14.4 Yuxing Technology Dual-pass Opacity Monitor Sales and Revenue in Global (2020-2025)
7.14.5 Yuxing Technology Key News & Latest Developments
7.15 Longhe Scientific Instruments (Shanghai)
7.15.1 Longhe Scientific Instruments (Shanghai) Company Summary
7.15.2 Longhe Scientific Instruments (Shanghai) Business Overview
7.15.3 Longhe Scientific Instruments (Shanghai) Dual-pass Opacity Monitor Major Product Offerings
7.15.4 Longhe Scientific Instruments (Shanghai) Dual-pass Opacity Monitor Sales and Revenue in Global (2020-2025)
7.15.5 Longhe Scientific Instruments (Shanghai) Key News & Latest Developments
7.16 Sichuan Keruisi Technology
7.16.1 Sichuan Keruisi Technology Company Summary
7.16.2 Sichuan Keruisi Technology Business Overview
7.16.3 Sichuan Keruisi Technology Dual-pass Opacity Monitor Major Product Offerings
7.16.4 Sichuan Keruisi Technology Dual-pass Opacity Monitor Sales and Revenue in Global (2020-2025)
7.16.5 Sichuan Keruisi Technology Key News & Latest Developments
7.17 Beijing United Measurement and Control Technology
7.17.1 Beijing United Measurement and Control Technology Company Summary
7.17.2 Beijing United Measurement and Control Technology Business Overview
7.17.3 Beijing United Measurement and Control Technology Dual-pass Opacity Monitor Major Product Offerings
7.17.4 Beijing United Measurement and Control Technology Dual-pass Opacity Monitor Sales and Revenue in Global (2020-2025)
7.17.5 Beijing United Measurement and Control Technology Key News & Latest Developments
8 Global Dual-pass Opacity Monitor Production Capacity, Analysis
8.1 Global Dual-pass Opacity Monitor Production Capacity, 2020-2032
8.2 Dual-pass Opacity Monitor Production Capacity of Key Manufacturers in Global Market
8.3 Global Dual-pass Opacity Monitor Production by Region
9 Key Market Trends, Opportunity, Drivers and Restraints
9.1 Market Opportunities & Trends
9.2 Market Drivers
9.3 Market Restraints
10 Dual-pass Opacity Monitor Supply Chain Analysis
10.1 Dual-pass Opacity Monitor Industry Value Chain
10.2 Dual-pass Opacity Monitor Upstream Market
10.3 Dual-pass Opacity Monitor Downstream and Clients
10.4 Marketing Channels Analysis
10.4.1 Marketing Channels
10.4.2 Dual-pass Opacity Monitor Distributors and Sales Agents in Global
11 Conclusion
12 Appendix
12.1 Note
12.2 Examples of Clients
12.3 DisclaimerList of Tables
Table 1. Key Players of Dual-pass Opacity Monitor in Global Market
Table 2. Top Dual-pass Opacity Monitor Players in Global Market, Ranking by Revenue (2024)
Table 3. Global Dual-pass Opacity Monitor Revenue by Companies, (US$, Mn), 2020-2025
Table 4. Global Dual-pass Opacity Monitor Revenue Share by Companies, 2020-2025
Table 5. Global Dual-pass Opacity Monitor Sales by Companies, (K Units), 2020-2025
Table 6. Global Dual-pass Opacity Monitor Sales Share by Companies, 2020-2025
Table 7. Key Manufacturers Dual-pass Opacity Monitor Price (2020-2025) & (US$/Unit)
Table 8. Global Manufacturers Dual-pass Opacity Monitor Product Type
Table 9. List of Global Tier 1 Dual-pass Opacity Monitor Companies, Revenue (US$, Mn) in 2024 and Market Share
Table 10. List of Global Tier 2 and Tier 3 Dual-pass Opacity Monitor Companies, Revenue (US$, Mn) in 2024 and Market Share
Table 11. Segment by Type – Global Dual-pass Opacity Monitor Revenue, (US$, Mn), 2024 & 2032
Table 12. Segment by Type – Global Dual-pass Opacity Monitor Revenue (US$, Mn), 2020-2025
Table 13. Segment by Type – Global Dual-pass Opacity Monitor Revenue (US$, Mn), 2026-2032
Table 14. Segment by Type – Global Dual-pass Opacity Monitor Sales (K Units), 2020-2025
Table 15. Segment by Type – Global Dual-pass Opacity Monitor Sales (K Units), 2026-2032
Table 16. Segment by Application – Global Dual-pass Opacity Monitor Revenue, (US$, Mn), 2024 & 2032
Table 17. Segment by Application – Global Dual-pass Opacity Monitor Revenue, (US$, Mn), 2020-2025
Table 18. Segment by Application – Global Dual-pass Opacity Monitor Revenue, (US$, Mn), 2026-2032
Table 19. Segment by Application – Global Dual-pass Opacity Monitor Sales, (K Units), 2020-2025
Table 20. Segment by Application – Global Dual-pass Opacity Monitor Sales, (K Units), 2026-2032
Table 21. By Region – Global Dual-pass Opacity Monitor Revenue, (US$, Mn), 2025-2032
Table 22. By Region – Global Dual-pass Opacity Monitor Revenue, (US$, Mn), 2020-2025
Table 23. By Region – Global Dual-pass Opacity Monitor Revenue, (US$, Mn), 2026-2032
Table 24. By Region – Global Dual-pass Opacity Monitor Sales, (K Units), 2020-2025
Table 25. By Region – Global Dual-pass Opacity Monitor Sales, (K Units), 2026-2032
Table 26. By Country – North America Dual-pass Opacity Monitor Revenue, (US$, Mn), 2020-2025
Table 27. By Country – North America Dual-pass Opacity Monitor Revenue, (US$, Mn), 2026-2032
Table 28. By Country – North America Dual-pass Opacity Monitor Sales, (K Units), 2020-2025
Table 29. By Country – North America Dual-pass Opacity Monitor Sales, (K Units), 2026-2032
Table 30. By Country – Europe Dual-pass Opacity Monitor Revenue, (US$, Mn), 2020-2025
Table 31. By Country – Europe Dual-pass Opacity Monitor Revenue, (US$, Mn), 2026-2032
Table 32. By Country – Europe Dual-pass Opacity Monitor Sales, (K Units), 2020-2025
Table 33. By Country – Europe Dual-pass Opacity Monitor Sales, (K Units), 2026-2032
Table 34. By Region – Asia Dual-pass Opacity Monitor Revenue, (US$, Mn), 2020-2025
Table 35. By Region – Asia Dual-pass Opacity Monitor Revenue, (US$, Mn), 2026-2032
Table 36. By Region – Asia Dual-pass Opacity Monitor Sales, (K Units), 2020-2025
Table 37. By Region – Asia Dual-pass Opacity Monitor Sales, (K Units), 2026-2032
Table 38. By Country – South America Dual-pass Opacity Monitor Revenue, (US$, Mn), 2020-2025
Table 39. By Country – South America Dual-pass Opacity Monitor Revenue, (US$, Mn), 2026-2032
Table 40. By Country – South America Dual-pass Opacity Monitor Sales, (K Units), 2020-2025
Table 41. By Country – South America Dual-pass Opacity Monitor Sales, (K Units), 2026-2032
Table 42. By Country – Middle East & Africa Dual-pass Opacity Monitor Revenue, (US$, Mn), 2020-2025
Table 43. By Country – Middle East & Africa Dual-pass Opacity Monitor Revenue, (US$, Mn), 2026-2032
Table 44. By Country – Middle East & Africa Dual-pass Opacity Monitor Sales, (K Units), 2020-2025
Table 45. By Country – Middle East & Africa Dual-pass Opacity Monitor Sales, (K Units), 2026-2032
Table 46. Acoem Company Summary
Table 47. Acoem Dual-pass Opacity Monitor Product Offerings
Table 48. Acoem Dual-pass Opacity Monitor Sales (K Units), Revenue (US$, Mn) and Average Price (US$/Unit) & (2020-2025)
Table 49. Acoem Key News & Latest Developments
Table 50. SICK Company Summary
Table 51. SICK Dual-pass Opacity Monitor Product Offerings
Table 52. SICK Dual-pass Opacity Monitor Sales (K Units), Revenue (US$, Mn) and Average Price (US$/Unit) & (2020-2025)
Table 53. SICK Key News & Latest Developments
Table 54. Durag Company Summary
Table 55. Durag Dual-pass Opacity Monitor Product Offerings
Table 56. Durag Dual-pass Opacity Monitor Sales (K Units), Revenue (US$, Mn) and Average Price (US$/Unit) & (2020-2025)
Table 57. Durag Key News & Latest Developments
Table 58. AMETEK Land Company Summary
Table 59. AMETEK Land Dual-pass Opacity Monitor Product Offerings
Table 60. AMETEK Land Dual-pass Opacity Monitor Sales (K Units), Revenue (US$, Mn) and Average Price (US$/Unit) & (2020-2025)
Table 61. AMETEK Land Key News & Latest Developments
Table 62. LISUN Electronics Company Summary
Table 63. LISUN Electronics Dual-pass Opacity Monitor Product Offerings
Table 64. LISUN Electronics Dual-pass Opacity Monitor Sales (K Units), Revenue (US$, Mn) and Average Price (US$/Unit) & (2020-2025)
Table 65. LISUN Electronics Key News & Latest Developments
Table 66. CODEL Company Summary
Table 67. CODEL Dual-pass Opacity Monitor Product Offerings
Table 68. CODEL Dual-pass Opacity Monitor Sales (K Units), Revenue (US$, Mn) and Average Price (US$/Unit) & (2020-2025)
Table 69. CODEL Key News & Latest Developments
Table 70. HNL Systems Company Summary
Table 71. HNL Systems Dual-pass Opacity Monitor Product Offerings
Table 72. HNL Systems Dual-pass Opacity Monitor Sales (K Units), Revenue (US$, Mn) and Average Price (US$/Unit) & (2020-2025)
Table 73. HNL Systems Key News & Latest Developments
Table 74. Redkoh Company Summary
Table 75. Redkoh Dual-pass Opacity Monitor Product Offerings
Table 76. Redkoh Dual-pass Opacity Monitor Sales (K Units), Revenue (US$, Mn) and Average Price (US$/Unit) & (2020-2025)
Table 77. Redkoh Key News & Latest Developments
Table 78. Environmental Monitor Service Company Summary
Table 79. Environmental Monitor Service Dual-pass Opacity Monitor Product Offerings
Table 80. Environmental Monitor Service Dual-pass Opacity Monitor Sales (K Units), Revenue (US$, Mn) and Average Price (US$/Unit) & (2020-2025)
Table 81. Environmental Monitor Service Key News & Latest Developments
Table 82. MRU Instruments Company Summary
Table 83. MRU Instruments Dual-pass Opacity Monitor Product Offerings
Table 84. MRU Instruments Dual-pass Opacity Monitor Sales (K Units), Revenue (US$, Mn) and Average Price (US$/Unit) & (2020-2025)
Table 85. MRU Instruments Key News & Latest Developments
Table 86. Shanghai Shouli Industry Company Summary
Table 87. Shanghai Shouli Industry Dual-pass Opacity Monitor Product Offerings
Table 88. Shanghai Shouli Industry Dual-pass Opacity Monitor Sales (K Units), Revenue (US$, Mn) and Average Price (US$/Unit) & (2020-2025)
Table 89. Shanghai Shouli Industry Key News & Latest Developments
Table 90. Shanghai Precision Instruments Company Summary
Table 91. Shanghai Precision Instruments Dual-pass Opacity Monitor Product Offerings
Table 92. Shanghai Precision Instruments Dual-pass Opacity Monitor Sales (K Units), Revenue (US$, Mn) and Average Price (US$/Unit) & (2020-2025)
Table 93. Shanghai Precision Instruments Key News & Latest Developments
Table 94. Juguang Technology Company Summary
Table 95. Juguang Technology Dual-pass Opacity Monitor Product Offerings
Table 96. Juguang Technology Dual-pass Opacity Monitor Sales (K Units), Revenue (US$, Mn) and Average Price (US$/Unit) & (2020-2025)
Table 97. Juguang Technology Key News & Latest Developments
Table 98. Yuxing Technology Company Summary
Table 99. Yuxing Technology Dual-pass Opacity Monitor Product Offerings
Table 100. Yuxing Technology Dual-pass Opacity Monitor Sales (K Units), Revenue (US$, Mn) and Average Price (US$/Unit) & (2020-2025)
Table 101. Yuxing Technology Key News & Latest Developments
Table 102. Longhe Scientific Instruments (Shanghai) Company Summary
Table 103. Longhe Scientific Instruments (Shanghai) Dual-pass Opacity Monitor Product Offerings
Table 104. Longhe Scientific Instruments (Shanghai) Dual-pass Opacity Monitor Sales (K Units), Revenue (US$, Mn) and Average Price (US$/Unit) & (2020-2025)
Table 105. Longhe Scientific Instruments (Shanghai) Key News & Latest Developments
Table 106. Sichuan Keruisi Technology Company Summary
Table 107. Sichuan Keruisi Technology Dual-pass Opacity Monitor Product Offerings
Table 108. Sichuan Keruisi Technology Dual-pass Opacity Monitor Sales (K Units), Revenue (US$, Mn) and Average Price (US$/Unit) & (2020-2025)
Table 109. Sichuan Keruisi Technology Key News & Latest Developments
Table 110. Beijing United Measurement and Control Technology Company Summary
Table 111. Beijing United Measurement and Control Technology Dual-pass Opacity Monitor Product Offerings
Table 112. Beijing United Measurement and Control Technology Dual-pass Opacity Monitor Sales (K Units), Revenue (US$, Mn) and Average Price (US$/Unit) & (2020-2025)
Table 113. Beijing United Measurement and Control Technology Key News & Latest Developments
Table 114. Dual-pass Opacity Monitor Capacity of Key Manufacturers in Global Market, 2023-2025 (K Units)
Table 115. Global Dual-pass Opacity Monitor Capacity Market Share of Key Manufacturers, 2023-2025
Table 116. Global Dual-pass Opacity Monitor Production by Region, 2020-2025 (K Units)
Table 117. Global Dual-pass Opacity Monitor Production by Region, 2026-2032 (K Units)
Table 118. Dual-pass Opacity Monitor Market Opportunities & Trends in Global Market
Table 119. Dual-pass Opacity Monitor Market Drivers in Global Market
Table 120. Dual-pass Opacity Monitor Market Restraints in Global Market
Table 121. Dual-pass Opacity Monitor Raw Materials
Table 122. Dual-pass Opacity Monitor Raw Materials Suppliers in Global Market
Table 123. Typical Dual-pass Opacity Monitor Downstream
Table 124. Dual-pass Opacity Monitor Downstream Clients in Global Market
Table 125. Dual-pass Opacity Monitor Distributors and Sales Agents in Global Market

List of Figures
Figure 1. Dual-pass Opacity Monitor Product Picture
Figure 2. Dual-pass Opacity Monitor Segment by Type in 2024
Figure 3. Dual-pass Opacity Monitor Segment by Application in 2024
Figure 4. Global Dual-pass Opacity Monitor Market Overview: 2024
Figure 5. Key Caveats
Figure 6. Global Dual-pass Opacity Monitor Market Size: 2024 VS 2032 (US$, Mn)
Figure 7. Global Dual-pass Opacity Monitor Revenue: 2020-2032 (US$, Mn)
Figure 8. Dual-pass Opacity Monitor Sales in Global Market: 2020-2032 (K Units)
Figure 9. The Top 3 and 5 Players Market Share by Dual-pass Opacity Monitor Revenue in 2024
Figure 10. Segment by Type – Global Dual-pass Opacity Monitor Revenue, (US$, Mn), 2024 & 2032
Figure 11. Segment by Type – Global Dual-pass Opacity Monitor Revenue Market Share, 2020-2032
Figure 12. Segment by Type – Global Dual-pass Opacity Monitor Sales Market Share, 2020-2032
Figure 13. Segment by Type – Global Dual-pass Opacity Monitor Price (US$/Unit), 2020-2032
Figure 14. Segment by Application – Global Dual-pass Opacity Monitor Revenue, (US$, Mn), 2024 & 2032
Figure 15. Segment by Application – Global Dual-pass Opacity Monitor Revenue Market Share, 2020-2032
Figure 16. Segment by Application – Global Dual-pass Opacity Monitor Sales Market Share, 2020-2032
Figure 17. Segment by Application -Global Dual-pass Opacity Monitor Price (US$/Unit), 2020-2032
Figure 18. By Region – Global Dual-pass Opacity Monitor Revenue, (US$, Mn), 2025 & 2032
Figure 19. By Region – Global Dual-pass Opacity Monitor Revenue Market Share, 2020 VS 2024 VS 2032
Figure 20. By Region – Global Dual-pass Opacity Monitor Revenue Market Share, 2020-2032
Figure 21. By Region – Global Dual-pass Opacity Monitor Sales Market Share, 2020-2032
Figure 22. By Country – North America Dual-pass Opacity Monitor Revenue Market Share, 2020-2032
Figure 23. By Country – North America Dual-pass Opacity Monitor Sales Market Share, 2020-2032
Figure 24. United States Dual-pass Opacity Monitor Revenue, (US$, Mn), 2020-2032
Figure 25. Canada Dual-pass Opacity Monitor Revenue, (US$, Mn), 2020-2032
Figure 26. Mexico Dual-pass Opacity Monitor Revenue, (US$, Mn), 2020-2032
Figure 27. By Country – Europe Dual-pass Opacity Monitor Revenue Market Share, 2020-2032
Figure 28. By Country – Europe Dual-pass Opacity Monitor Sales Market Share, 2020-2032
Figure 29. Germany Dual-pass Opacity Monitor Revenue, (US$, Mn), 2020-2032
Figure 30. France Dual-pass Opacity Monitor Revenue, (US$, Mn), 2020-2032
Figure 31. U.K. Dual-pass Opacity Monitor Revenue, (US$, Mn), 2020-2032
Figure 32. Italy Dual-pass Opacity Monitor Revenue, (US$, Mn), 2020-2032
Figure 33. Russia Dual-pass Opacity Monitor Revenue, (US$, Mn), 2020-2032
Figure 34. Nordic Countries Dual-pass Opacity Monitor Revenue, (US$, Mn), 2020-2032
Figure 35. Benelux Dual-pass Opacity Monitor Revenue, (US$, Mn), 2020-2032
Figure 36. By Region – Asia Dual-pass Opacity Monitor Revenue Market Share, 2020-2032
Figure 37. By Region – Asia Dual-pass Opacity Monitor Sales Market Share, 2020-2032
Figure 38. China Dual-pass Opacity Monitor Revenue, (US$, Mn), 2020-2032
Figure 39. Japan Dual-pass Opacity Monitor Revenue, (US$, Mn), 2020-2032
Figure 40. South Korea Dual-pass Opacity Monitor Revenue, (US$, Mn), 2020-2032
Figure 41. Southeast Asia Dual-pass Opacity Monitor Revenue, (US$, Mn), 2020-2032
Figure 42. India Dual-pass Opacity Monitor Revenue, (US$, Mn), 2020-2032
Figure 43. By Country – South America Dual-pass Opacity Monitor Revenue Market Share, 2020-2032
Figure 44. By Country – South America Dual-pass Opacity Monitor Sales, Market Share, 2020-2032
Figure 45. Brazil Dual-pass Opacity Monitor Revenue, (US$, Mn), 2020-2032
Figure 46. Argentina Dual-pass Opacity Monitor Revenue, (US$, Mn), 2020-2032
Figure 47. By Country – Middle East & Africa Dual-pass Opacity Monitor Revenue, Market Share, 2020-2032
Figure 48. By Country – Middle East & Africa Dual-pass Opacity Monitor Sales, Market Share, 2020-2032
Figure 49. Turkey Dual-pass Opacity Monitor Revenue, (US$, Mn), 2020-2032
Figure 50. Israel Dual-pass Opacity Monitor Revenue, (US$, Mn), 2020-2032
Figure 51. Saudi Arabia Dual-pass Opacity Monitor Revenue, (US$, Mn), 2020-2032
Figure 52. UAE Dual-pass Opacity Monitor Revenue, (US$, Mn), 2020-2032
Figure 53. Global Dual-pass Opacity Monitor Production Capacity (K Units), 2020-2032
Figure 54. The Percentage of Production Dual-pass Opacity Monitor by Region, 2024 VS 2032
Figure 55. Dual-pass Opacity Monitor Industry Value Chain
Figure 56. Marketing Channels