Digital Video Walls Market, Trends, Business Strategies 2025-2032

Digital Video Walls Market was valued at USD 5.8 billion in 2024 and is projected to reach USD 12.3 billion by 2032, exhibiting a CAGR of 9.7% during the forecast period.

PDF Icon Download Sample Report PDF
  • Quick Dispatch

    All Orders

  • Secure Payment

    100% Secure Payment

Price range: $1,500.00 through $4,250.00

Clear

MARKET INSIGHTS

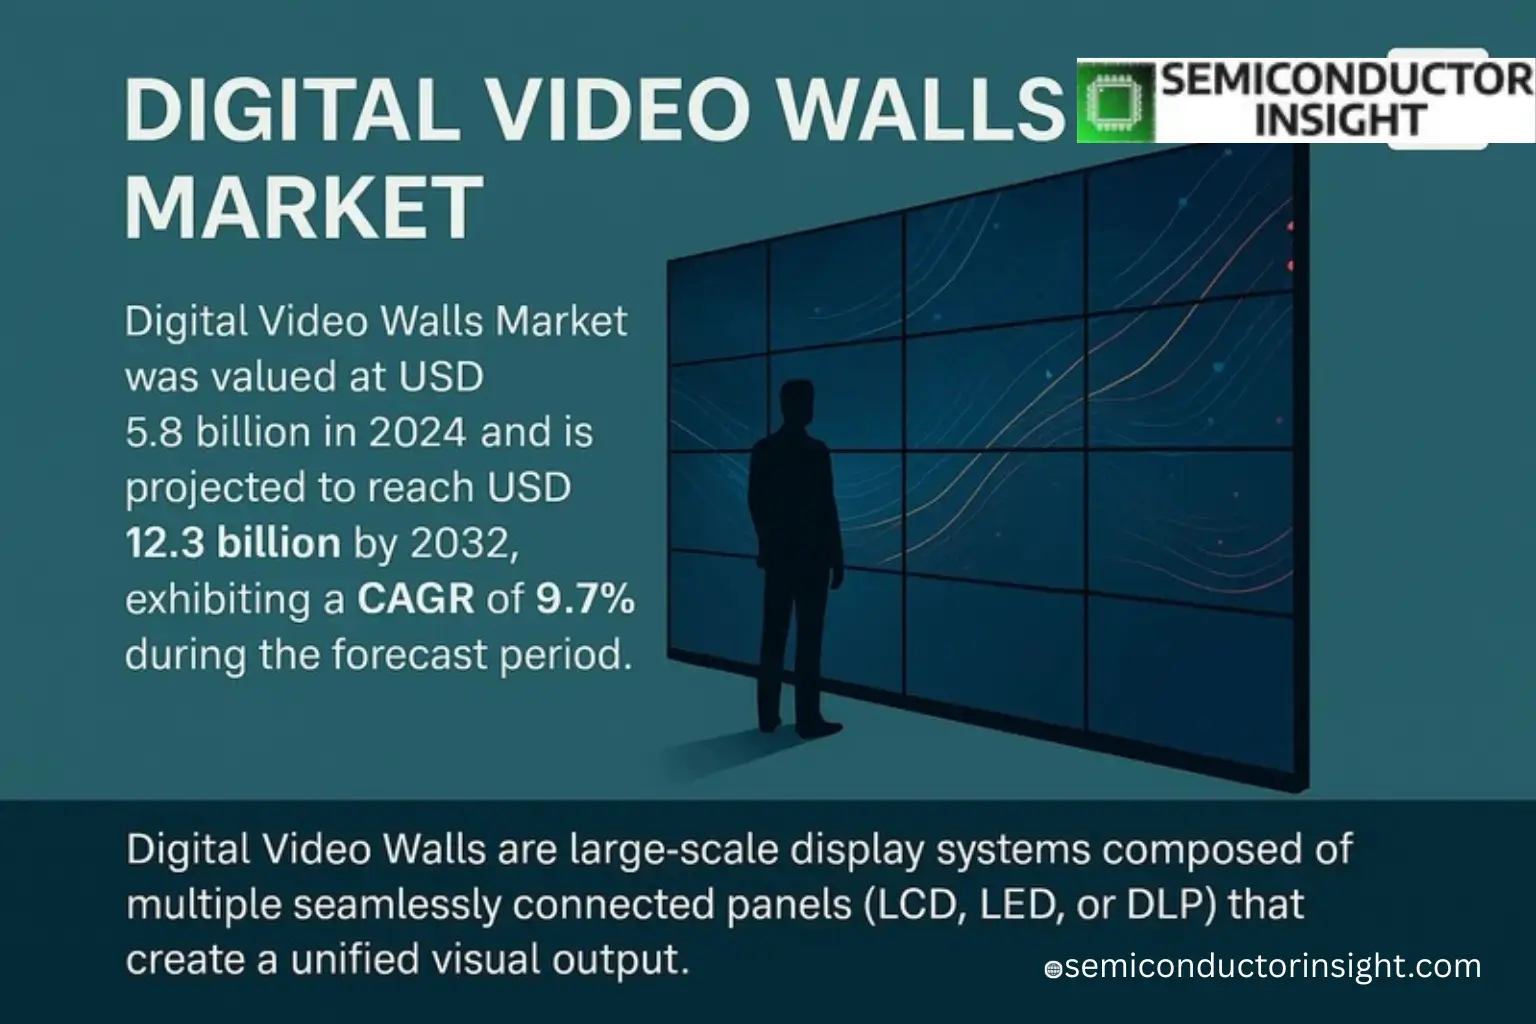
Global Digital Video Walls Market was valued at USD 5.8 billion in 2024 and is projected to reach USD 12.3 billion by 2032, exhibiting a CAGR of 9.7% during the forecast period.

Digital Video Walls are large-scale display systems composed of multiple seamlessly connected panels (LCD, LED, or DLP) that create a unified visual output. These systems integrate advanced controllers and software to process and distribute content across displays, enabling high-resolution, customizable layouts for real-time data visualization. Key applications span control rooms, retail advertising, transportation hubs, and corporate environments where dynamic information sharing is critical.

The market growth is driven by rising demand for immersive advertising displays and smart city infrastructure upgrades. Technological advancements like fine-pitch LED and bezel-free designs enhance viewing experiences, while AI-driven content management systems optimize operational efficiency. Major players such as Samsung Electronics Co., Ltd., LG Electronics Inc., and Barco NV dominate the sector with innovations in modular displays and energy-efficient solutions. For instance, in Q1 2024, NEC Corporation launched a new series of ultra-narrow-bezel LCD video walls targeting the education and enterprise sectors

Xyz market size & forecast

MARKET DRIVERS

Growing Demand for Immersive Brand Experiences

The Digital Video Walls Market is expanding rapidly due to increasing demand for high-impact visual communication in retail, corporate, and public spaces. Businesses leverage digital video wall solutions to create engaging brand experiences, with over 65% of retailers reporting higher customer engagement through dynamic displays. This trend is particularly strong in sectors prioritizing visual storytelling.

Technological Advancements Driving Adoption

Recent innovations in LED and LCD technologies have enhanced display quality while reducing costs, making digital video walls more accessible. The average brightness of commercial displays has increased by 40% in the past three years, improving visibility in various lighting conditions. Seamless tiling capabilities now allow for unlimited screen size configurations with minimal bezels.

Integration with AI-powered content management systems enables real-time updates and personalized messaging, further boosting deployment across smart cities and transportation hubs.

MARKET CHALLENGES

High Initial Investment and Installation Complexities

Despite declining hardware costs, enterprise-grade digital video wall solutions require significant capital expenditure, with complete installations ranging from USD 50,000 to USD 500,000 depending on size and functionality. This creates barriers for small and medium businesses seeking to implement large-scale displays.

Other Challenges

Content Creation and Maintenance Costs
Ongoing expenses for professional content development and system updates account for approximately 35% of total cost of ownership for digital video wall deployments, requiring specialized technical expertise.

MARKET RESTRAINTS

Limited ROI Clarity for Some Verticals

While retail and hospitality sectors demonstrate clear returns from digital video wall installations, other industries face challenges quantifying direct business impact. Approximately 28% of corporate adopters report difficulty measuring engagement metrics against implementation costs, slowing broader market penetration.

MARKET OPPORTUNITIES

Expansion in Smart City Infrastructure

Municipalities worldwide are investing in digital video wall technology for public information systems, with urban centers allocating 15-20% of smart city budgets to interactive displays. This creates significant growth potential for vendors offering weatherproof and vandal-resistant solutions.

Healthcare Sector Adoption Rising

Hospitals are implementing digital video wall systems for wayfinding, patient education, and emergency communication. The healthcare vertical is projected to grow at 9.1% annually through 2027, driven by the need for real-time information sharing in medical facilities.
Digital Video Walls Market Trends

Rising Demand for High-Resolution Visual Solutions

Global Digital Video Walls Market is experiencing robust growth, projected to reach multimillion-dollar valuation by 2032 with a steady CAGR. This expansion is driven by increasing adoption across government, retail, and transportation sectors, where large-scale, high-resolution displays are essential for effective information dissemination and decision-making. Advanced display technologies like Mini LED and seamless splicing are enhancing visual quality while reducing bezel interference.

Other Trends

Technology Integration and Smart Features

Modern Digital Video Walls now incorporate AI-based image recognition and big data analytics, transforming them into intelligent visualization tools. These systems support real-time data processing, remote management, and multi-screen synchronization, meeting growing demand in smart city projects and security operations. The integration of IoT capabilities allows for predictive maintenance and energy-efficient operations.

Market Expansion Through Vertical Applications

Commercial sectors such as retail and education are increasingly adopting Digital Video Walls for immersive advertising and interactive learning. The healthcare sector utilizes them for surgical visualization and patient monitoring. Emerging applications in control rooms and broadcast studios are driving demand for ultra-narrow bezel displays with 24/7 operational reliability.

Competitive Landscape and Innovation

Leading manufacturers are focusing on product differentiation through advanced features like high brightness, wide color gamut, and modular designs. The market sees intense competition between established players and emerging regional suppliers, particularly in Asia-Pacific where production capabilities are expanding rapidly.

Challenges in Supply Chain and Standardization

Despite growth prospects, the Digital Video Walls Market faces challenges including dependence on specialized components and the need for standardized control protocols. Price pressures from commoditization and increasing customer demands for integrated solutions require manufacturers to balance innovation with cost optimization.

COMPETITIVE LANDSCAPE

Key Industry Players

Global Digital Video Walls Market Dominated by Display Technology Leaders

The Digital Video Walls Market is characterized by strong competition among established display technology providers and specialized video wall manufacturers. Barco and Christie lead the market with their high-end control room solutions, leveraging decades of experience in professional visualization. Samsung and LG Electronics hold significant shares through their vertically integrated display technologies, particularly in the commercial LED segment. Japanese brands like Panasonic, NEC, and Sony maintain strong positions in mission-critical applications with their reliable LCD and DLP solutions.

Emerging players like Absen, Unilumin, and Leyard are gaining traction through competitive LED video wall offerings, especially in the Asia-Pacific region. Daktronics and Planar specialize in large-format outdoor digital signage solutions, while Lighthouse and Eyevis cater to niche markets with custom video wall installations. The competitive landscape also includes Chinese manufacturers such as Dahua and Konka, which are expanding globally with cost-effective alternatives.

List of Key Digital Video Walls Companies Profiled

  • Barco
  • Christie
  • Daktronics
  • Lighthouse
  • Planar
  • Mitsubishi Electric
  • Delta Electronics
  • Samsung Electronics
  • NEC Display Solutions
  • Panasonic
  • LG Electronics
  • Eyevis
  • Sharp
  • Philips
  • DynaScan

Segment Analysis:

Segment Category Sub-Segments Key Insights
By Type
  • LCD
  • LED
  • DLP
LED Segment dominates due to:

  • Superior brightness and contrast ratios for diverse lighting environments
  • Seamless bezel-less designs enabling uninterrupted visual experiences
  • Longer lifespan and lower maintenance requirements compared to other technologies
By Application
  • Command & Control Centers
  • Retail & Advertising
  • Transportation Hubs
  • Education & Corporate
  • Others
Command & Control Segment shows strongest adoption because:

  • Critical need for real-time data visualization in security and operations monitoring
  • Increasing government investments in smart city infrastructure projects
  • Growing complexity of security systems requiring multi-source data integration
By End User
  • Government & Defense
  • Commercial Enterprises
  • Transportation Authorities
  • Educational Institutions
Government & Defense Segment leads the market for:

  • Heightened national security requirements driving surveillance infrastructure upgrades
  • Implementation of emergency response and disaster management systems
  • Strategic investments in digital infrastructure for public safety initiatives
By Installation Type
  • Fixed Installation
  • Modular Installation
  • Mobile Installation
Fixed Installation Segment remains dominant due to:

  • Permanent infrastructure needs for control rooms and public display locations
  • Higher reliability and stability for mission-critical applications
  • Customization options for architectural integration in corporate and public spaces
By Resolution
  • Full HD
  • 4K
  • 8K
4K Resolution Segment shows strongest growth because:

  • Increasing demand for detailed visualization in surveillance and data analysis
  • Content creators shifting towards higher resolution formats
  • Technological advancements making 4K solutions more cost-effective


Regional Analysis: Digital Video Walls Market

North America

North America dominates the Digital Video Walls Market due to early adoption of advanced display technologies and strong presence of leading technology providers. The region benefits from high corporate investments in digital signage solutions across retail, transportation, and corporate sectors. Major US cities are deploying large-scale digital wall installations in public spaces and commercial complexes, driven by decreasing LED panel costs and rising demand for immersive visual experiences. Canada shows particular growth in the healthcare and education sectors, where interactive video walls are transforming communication and collaboration spaces. Enterprise adoption remains strong with financial institutions and tech companies investing heavily in high-resolution video walls for data visualization and branding purposes.

Corporate Sector Adoption
US corporations are increasingly integrating digital video walls in office lobbies, boardrooms, and hospitality areas for brand storytelling and real-time data dashboards. The trend reflects growing workplace digital transformation initiatives focused on employee engagement and client presentations.
Retail Digital Signage
Major retail chains across North America are replacing traditional signage with dynamic video walls to enhance customer experiences. These installations serve both advertising and wayfinding purposes, with retail hubs like New York and Toronto witnessing exponential growth in large-format displays.
Transportation Hubs
Airports and transit systems across the region are adopting video walls for passenger information and advertising. Chicago O’Hare and Toronto Pearson airports showcase cutting-edge implementations that combine wayfinding with revenue-generating content displays.
Technology Partnerships
North America’s vibrant ecosystem of display manufacturers, content creators, and software developers accelerates innovation in video wall solutions. Strategic collaborations between Silicon Valley tech firms and Canadian digital media companies are pushing boundaries in interactive display technologies.

Europe
Europe maintains strong growth in the Digital Video Walls Market, particularly in Western European countries with advanced digital infrastructure. The UK and Germany lead in corporate and public sector deployments, while Scandinavian countries excel in sustainable display solutions. European regulations on energy-efficient displays are shaping product development, with manufacturers focusing on low-power consumption video walls. The region shows particular strength in museum and cultural institution installations, where heritage sites leverage video walls for interactive visitor experiences without compromising architectural integrity. Retail adoption grows steadily as physical stores compete with e-commerce through immersive in-store technologies.

Asia-Pacific
The Asia-Pacific Digital Video Walls Market is experiencing rapid growth, driven by urbanization and smart city initiatives across major economies. China dominates regional demand with massive deployments in transportation hubs and commercial centers, while Japan leads in technological innovation with ultra-high-resolution displays. Southeast Asian countries like Singapore and Malaysia show increasing adoption in the hospitality sector, integrating video walls with augmented reality features. India represents an emerging market with growing corporate sector demand, particularly in banking and IT services companies establishing modern office spaces.

Middle East & Africa
The Middle East demonstrates significant Digital Video Walls Market activity, particularly in GCC countries investing in smart city projects and luxury retail environments. Dubai leads with ambitious installations in airports, shopping malls, and government buildings as part of its smart city transformation. Saudi Arabia follows closely with large-scale deployments for the entertainment sector and religious tourism infrastructure. African markets show nascent but promising growth in South Africa and Nigeria, where corporate headquarters and premium retail spaces begin adopting video wall solutions.

South America
South America’s Digital Video Walls Market shows steady growth concentrated in Brazil, Argentina, and Chile. Major applications include retail advertising and corporate communications, with increasing adoption in banking sector branches. The region benefits from decreasing technology costs and growing awareness of digital signage benefits. Brazil leads in large-format installations for sports venues and shopping malls, while Colombia shows potential for growth in the hospitality sector as tourism rebounds post-pandemic.

Report Scope

This market research report provides a comprehensive analysis of the Digital Video Walls Market, covering the forecast period 2025–2032. It offers detailed insights into market dynamics, technological advancements, competitive landscape, and key trends shaping the industry.

Key focus areas of the report include:

  • Market Overview: The report begins with an overview outlining its current market scenario, key growth indicators, and industry transformation drivers. It discusses macroeconomic factors, demand–supply balance, technological advancements, and the strategic role of digital video walls across industries such as security monitoring, retail, education, transportation, and smart city infrastructure.
  • Market Size & Forecast: Historical data and future projections for revenue, unit shipments, and market value across major regions and segments.
  • Segmentation Analysis: Detailed breakdown by product type (LCD, LED, DLP), application (Indoor, Outdoor), and end-user industry to identify high-growth segments.
  • Regional Insights: Insights into market performance across North America, Europe, Asia-Pacific, Latin America, and the Middle East & Africa, including country-level analysis.
  • Competitive Landscape: Profiles of leading market participants with their product offerings, pricing strategies, and recent developments.
  • Technology Trends & Innovation: Assessment of emerging technologies including Mini LED, seamless splicing, AI integration, and intelligent control systems.
  • Market Drivers & Restraints: Evaluation of growth drivers and challenges including supply chain constraints and technology monopolies.
  • Stakeholder Insights: Strategic opportunities for OEMs, system integrators, and investors in the evolving digital video wall ecosystem.

Primary and secondary research methods are employed, including interviews with industry experts and data from verified sources to ensure accuracy.

FREQUENTLY ASKED QUESTIONS:

What is the current market size of Digital Video Walls Market?

-> Digital Video Walls Market was valued at USD 5.8 billion in 2024 and is projected to reach USD 12.3 billion by 2032, exhibiting a CAGR of 9.7% during the forecast period.

Which key companies operate in Digital Video Walls Market?

-> Key players include Barco, Christie, Daktronics, Lighthouse, Planar, Mitsubishi Electric, Delta, Samsung, NEC, Panasonic, LG, Eyevis, Sharp, Philips, DynaScan, Sony, Toshiba, Vtron, Sansi, Konka, Leyard, Odin, Absen, Dahua, GQY, Unilumin, Changhong, Liantronics, Vewell, Szretop, among others.

What are the key growth drivers?

-> Key growth drivers include smart city initiatives, security system upgrades, demand for commercial visual displays, and technological advancements in Mini LED and intelligent control systems.

Which region dominates the market?

-> Asia is a key growth region, particularly China, Japan, and South Korea, while North America and Europe remain significant markets.

What are the emerging trends?

-> Emerging trends include AI-based image recognition, real-time data visualization, fine-pitch LED technology, and modular video wall designs.

Digital Video Walls Market, Trends, Business Strategies 2025-2032

Get Sample Report PDF for Exclusive Insights

Report Sample Includes

  • Table of Contents
  • List of Tables & Figures
  • Charts, Research Methodology, and more...
PDF Icon Download Sample Report PDF

Download Sample Report

Table of Content

1 Introduction to Research & Analysis Reports
1.1 Digital Video Walls Market Definition
1.2 Market Segments
1.2.1 Segment by Type
1.2.2 Segment by Application
1.3 Global Digital Video Walls Market Overview
1.4 Features & Benefits of This Report
1.5 Methodology & Sources of Information
1.5.1 Research Methodology
1.5.2 Research Process
1.5.3 Base Year
1.5.4 Report Assumptions & Caveats
2 Global Digital Video Walls Overall Market Size
2.1 Global Digital Video Walls Market Size: 2024 VS 2032
2.2 Global Digital Video Walls Market Size, Prospects & Forecasts: 2020-2032
2.3 Global Digital Video Walls Sales: 2020-2032
3 Company Landscape
3.1 Top Digital Video Walls Players in Global Market
3.2 Top Global Digital Video Walls Companies Ranked by Revenue
3.3 Global Digital Video Walls Revenue by Companies
3.4 Global Digital Video Walls Sales by Companies
3.5 Global Digital Video Walls Price by Manufacturer (2020-2025)
3.6 Top 3 and Top 5 Digital Video Walls Companies in Global Market, by Revenue in 2024
3.7 Global Manufacturers Digital Video Walls Product Type
3.8 Tier 1, Tier 2, and Tier 3 Digital Video Walls Players in Global Market
3.8.1 List of Global Tier 1 Digital Video Walls Companies
3.8.2 List of Global Tier 2 and Tier 3 Digital Video Walls Companies
4 Sights by Product
4.1 Overview
4.1.1 Segment by Type – Global Digital Video Walls Market Size Markets, 2024 & 2032
4.1.2 LCD
4.1.3 LED
4.1.4 DLP
4.2 Segment by Type – Global Digital Video Walls Revenue & Forecasts
4.2.1 Segment by Type – Global Digital Video Walls Revenue, 2020-2025
4.2.2 Segment by Type – Global Digital Video Walls Revenue, 2026-2032
4.2.3 Segment by Type – Global Digital Video Walls Revenue Market Share, 2020-2032
4.3 Segment by Type – Global Digital Video Walls Sales & Forecasts
4.3.1 Segment by Type – Global Digital Video Walls Sales, 2020-2025
4.3.2 Segment by Type – Global Digital Video Walls Sales, 2026-2032
4.3.3 Segment by Type – Global Digital Video Walls Sales Market Share, 2020-2032
4.4 Segment by Type – Global Digital Video Walls Price (Manufacturers Selling Prices), 2020-2032
5 Sights by Application
5.1 Overview
5.1.1 Segment by Application – Global Digital Video Walls Market Size, 2024 & 2032
5.1.2 Indoor
5.1.3 Outdoor
5.2 Segment by Application – Global Digital Video Walls Revenue & Forecasts
5.2.1 Segment by Application – Global Digital Video Walls Revenue, 2020-2025
5.2.2 Segment by Application – Global Digital Video Walls Revenue, 2026-2032
5.2.3 Segment by Application – Global Digital Video Walls Revenue Market Share, 2020-2032
5.3 Segment by Application – Global Digital Video Walls Sales & Forecasts
5.3.1 Segment by Application – Global Digital Video Walls Sales, 2020-2025
5.3.2 Segment by Application – Global Digital Video Walls Sales, 2026-2032
5.3.3 Segment by Application – Global Digital Video Walls Sales Market Share, 2020-2032
5.4 Segment by Application – Global Digital Video Walls Price (Manufacturers Selling Prices), 2020-2032
6 Sights by Region
6.1 By Region – Global Digital Video Walls Market Size, 2024 & 2032
6.2 By Region – Global Digital Video Walls Revenue & Forecasts
6.2.1 By Region – Global Digital Video Walls Revenue, 2020-2025
6.2.2 By Region – Global Digital Video Walls Revenue, 2026-2032
6.2.3 By Region – Global Digital Video Walls Revenue Market Share, 2020-2032
6.3 By Region – Global Digital Video Walls Sales & Forecasts
6.3.1 By Region – Global Digital Video Walls Sales, 2020-2025
6.3.2 By Region – Global Digital Video Walls Sales, 2026-2032
6.3.3 By Region – Global Digital Video Walls Sales Market Share, 2020-2032
6.4 North America
6.4.1 By Country – North America Digital Video Walls Revenue, 2020-2032
6.4.2 By Country – North America Digital Video Walls Sales, 2020-2032
6.4.3 United States Digital Video Walls Market Size, 2020-2032
6.4.4 Canada Digital Video Walls Market Size, 2020-2032
6.4.5 Mexico Digital Video Walls Market Size, 2020-2032
6.5 Europe
6.5.1 By Country – Europe Digital Video Walls Revenue, 2020-2032
6.5.2 By Country – Europe Digital Video Walls Sales, 2020-2032
6.5.3 Germany Digital Video Walls Market Size, 2020-2032
6.5.4 France Digital Video Walls Market Size, 2020-2032
6.5.5 U.K. Digital Video Walls Market Size, 2020-2032
6.5.6 Italy Digital Video Walls Market Size, 2020-2032
6.5.7 Russia Digital Video Walls Market Size, 2020-2032
6.5.8 Nordic Countries Digital Video Walls Market Size, 2020-2032
6.5.9 Benelux Digital Video Walls Market Size, 2020-2032
6.6 Asia
6.6.1 By Region – Asia Digital Video Walls Revenue, 2020-2032
6.6.2 By Region – Asia Digital Video Walls Sales, 2020-2032
6.6.3 China Digital Video Walls Market Size, 2020-2032
6.6.4 Japan Digital Video Walls Market Size, 2020-2032
6.6.5 South Korea Digital Video Walls Market Size, 2020-2032
6.6.6 Southeast Asia Digital Video Walls Market Size, 2020-2032
6.6.7 India Digital Video Walls Market Size, 2020-2032
6.7 South America
6.7.1 By Country – South America Digital Video Walls Revenue, 2020-2032
6.7.2 By Country – South America Digital Video Walls Sales, 2020-2032
6.7.3 Brazil Digital Video Walls Market Size, 2020-2032
6.7.4 Argentina Digital Video Walls Market Size, 2020-2032
6.8 Middle East & Africa
6.8.1 By Country – Middle East & Africa Digital Video Walls Revenue, 2020-2032
6.8.2 By Country – Middle East & Africa Digital Video Walls Sales, 2020-2032
6.8.3 Turkey Digital Video Walls Market Size, 2020-2032
6.8.4 Israel Digital Video Walls Market Size, 2020-2032
6.8.5 Saudi Arabia Digital Video Walls Market Size, 2020-2032
6.8.6 UAE Digital Video Walls Market Size, 2020-2032
7 Manufacturers & Brands Profiles
7.1 Barco
7.1.1 Barco Company Summary
7.1.2 Barco Business Overview
7.1.3 Barco Digital Video Walls Major Product Offerings
7.1.4 Barco Digital Video Walls Sales and Revenue in Global (2020-2025)
7.1.5 Barco Key News & Latest Developments
7.2 Christie
7.2.1 Christie Company Summary
7.2.2 Christie Business Overview
7.2.3 Christie Digital Video Walls Major Product Offerings
7.2.4 Christie Digital Video Walls Sales and Revenue in Global (2020-2025)
7.2.5 Christie Key News & Latest Developments
7.3 Daktronics
7.3.1 Daktronics Company Summary
7.3.2 Daktronics Business Overview
7.3.3 Daktronics Digital Video Walls Major Product Offerings
7.3.4 Daktronics Digital Video Walls Sales and Revenue in Global (2020-2025)
7.3.5 Daktronics Key News & Latest Developments
7.4 Lighthouse
7.4.1 Lighthouse Company Summary
7.4.2 Lighthouse Business Overview
7.4.3 Lighthouse Digital Video Walls Major Product Offerings
7.4.4 Lighthouse Digital Video Walls Sales and Revenue in Global (2020-2025)
7.4.5 Lighthouse Key News & Latest Developments
7.5 Planar
7.5.1 Planar Company Summary
7.5.2 Planar Business Overview
7.5.3 Planar Digital Video Walls Major Product Offerings
7.5.4 Planar Digital Video Walls Sales and Revenue in Global (2020-2025)
7.5.5 Planar Key News & Latest Developments
7.6 Mitsubishi Electric
7.6.1 Mitsubishi Electric Company Summary
7.6.2 Mitsubishi Electric Business Overview
7.6.3 Mitsubishi Electric Digital Video Walls Major Product Offerings
7.6.4 Mitsubishi Electric Digital Video Walls Sales and Revenue in Global (2020-2025)
7.6.5 Mitsubishi Electric Key News & Latest Developments
7.7 Delta
7.7.1 Delta Company Summary
7.7.2 Delta Business Overview
7.7.3 Delta Digital Video Walls Major Product Offerings
7.7.4 Delta Digital Video Walls Sales and Revenue in Global (2020-2025)
7.7.5 Delta Key News & Latest Developments
7.8 Samsung
7.8.1 Samsung Company Summary
7.8.2 Samsung Business Overview
7.8.3 Samsung Digital Video Walls Major Product Offerings
7.8.4 Samsung Digital Video Walls Sales and Revenue in Global (2020-2025)
7.8.5 Samsung Key News & Latest Developments
7.9 NEC
7.9.1 NEC Company Summary
7.9.2 NEC Business Overview
7.9.3 NEC Digital Video Walls Major Product Offerings
7.9.4 NEC Digital Video Walls Sales and Revenue in Global (2020-2025)
7.9.5 NEC Key News & Latest Developments
7.10 Panasonic
7.10.1 Panasonic Company Summary
7.10.2 Panasonic Business Overview
7.10.3 Panasonic Digital Video Walls Major Product Offerings
7.10.4 Panasonic Digital Video Walls Sales and Revenue in Global (2020-2025)
7.10.5 Panasonic Key News & Latest Developments
7.11 LG
7.11.1 LG Company Summary
7.11.2 LG Business Overview
7.11.3 LG Digital Video Walls Major Product Offerings
7.11.4 LG Digital Video Walls Sales and Revenue in Global (2020-2025)
7.11.5 LG Key News & Latest Developments
7.12 Eyevis
7.12.1 Eyevis Company Summary
7.12.2 Eyevis Business Overview
7.12.3 Eyevis Digital Video Walls Major Product Offerings
7.12.4 Eyevis Digital Video Walls Sales and Revenue in Global (2020-2025)
7.12.5 Eyevis Key News & Latest Developments
7.13 Sharp
7.13.1 Sharp Company Summary
7.13.2 Sharp Business Overview
7.13.3 Sharp Digital Video Walls Major Product Offerings
7.13.4 Sharp Digital Video Walls Sales and Revenue in Global (2020-2025)
7.13.5 Sharp Key News & Latest Developments
7.14 Philips
7.14.1 Philips Company Summary
7.14.2 Philips Business Overview
7.14.3 Philips Digital Video Walls Major Product Offerings
7.14.4 Philips Digital Video Walls Sales and Revenue in Global (2020-2025)
7.14.5 Philips Key News & Latest Developments
7.15 DynaScan
7.15.1 DynaScan Company Summary
7.15.2 DynaScan Business Overview
7.15.3 DynaScan Digital Video Walls Major Product Offerings
7.15.4 DynaScan Digital Video Walls Sales and Revenue in Global (2020-2025)
7.15.5 DynaScan Key News & Latest Developments
7.16 Sony
7.16.1 Sony Company Summary
7.16.2 Sony Business Overview
7.16.3 Sony Digital Video Walls Major Product Offerings
7.16.4 Sony Digital Video Walls Sales and Revenue in Global (2020-2025)
7.16.5 Sony Key News & Latest Developments
7.17 Toshiba
7.17.1 Toshiba Company Summary
7.17.2 Toshiba Business Overview
7.17.3 Toshiba Digital Video Walls Major Product Offerings
7.17.4 Toshiba Digital Video Walls Sales and Revenue in Global (2020-2025)
7.17.5 Toshiba Key News & Latest Developments
7.18 Vtron
7.18.1 Vtron Company Summary
7.18.2 Vtron Business Overview
7.18.3 Vtron Digital Video Walls Major Product Offerings
7.18.4 Vtron Digital Video Walls Sales and Revenue in Global (2020-2025)
7.18.5 Vtron Key News & Latest Developments
7.19 Sansi
7.19.1 Sansi Company Summary
7.19.2 Sansi Business Overview
7.19.3 Sansi Digital Video Walls Major Product Offerings
7.19.4 Sansi Digital Video Walls Sales and Revenue in Global (2020-2025)
7.19.5 Sansi Key News & Latest Developments
7.20 Konka
7.20.1 Konka Company Summary
7.20.2 Konka Business Overview
7.20.3 Konka Digital Video Walls Major Product Offerings
7.20.4 Konka Digital Video Walls Sales and Revenue in Global (2020-2025)
7.20.5 Konka Key News & Latest Developments
7.21 Leyard
7.21.1 Leyard Company Summary
7.21.2 Leyard Business Overview
7.21.3 Leyard Digital Video Walls Major Product Offerings
7.21.4 Leyard Digital Video Walls Sales and Revenue in Global (2020-2025)
7.21.5 Leyard Key News & Latest Developments
7.22 Odin
7.22.1 Odin Company Summary
7.22.2 Odin Business Overview
7.22.3 Odin Digital Video Walls Major Product Offerings
7.22.4 Odin Digital Video Walls Sales and Revenue in Global (2020-2025)
7.22.5 Odin Key News & Latest Developments
7.23 Absen
7.23.1 Absen Company Summary
7.23.2 Absen Business Overview
7.23.3 Absen Digital Video Walls Major Product Offerings
7.23.4 Absen Digital Video Walls Sales and Revenue in Global (2020-2025)
7.23.5 Absen Key News & Latest Developments
7.24 Dahua
7.24.1 Dahua Company Summary
7.24.2 Dahua Business Overview
7.24.3 Dahua Digital Video Walls Major Product Offerings
7.24.4 Dahua Digital Video Walls Sales and Revenue in Global (2020-2025)
7.24.5 Dahua Key News & Latest Developments
7.25 GQY
7.25.1 GQY Company Summary
7.25.2 GQY Business Overview
7.25.3 GQY Digital Video Walls Major Product Offerings
7.25.4 GQY Digital Video Walls Sales and Revenue in Global (2020-2025)
7.25.5 GQY Key News & Latest Developments
7.26 Unilumin
7.26.1 Unilumin Company Summary
7.26.2 Unilumin Business Overview
7.26.3 Unilumin Digital Video Walls Major Product Offerings
7.26.4 Unilumin Digital Video Walls Sales and Revenue in Global (2020-2025)
7.26.5 Unilumin Key News & Latest Developments
7.27 Changhong
7.27.1 Changhong Company Summary
7.27.2 Changhong Business Overview
7.27.3 Changhong Digital Video Walls Major Product Offerings
7.27.4 Changhong Digital Video Walls Sales and Revenue in Global (2020-2025)
7.27.5 Changhong Key News & Latest Developments
7.28 Liantronics
7.28.1 Liantronics Company Summary
7.28.2 Liantronics Business Overview
7.28.3 Liantronics Digital Video Walls Major Product Offerings
7.28.4 Liantronics Digital Video Walls Sales and Revenue in Global (2020-2025)
7.28.5 Liantronics Key News & Latest Developments
7.29 Vewell
7.29.1 Vewell Company Summary
7.29.2 Vewell Business Overview
7.29.3 Vewell Digital Video Walls Major Product Offerings
7.29.4 Vewell Digital Video Walls Sales and Revenue in Global (2020-2025)
7.29.5 Vewell Key News & Latest Developments
7.30 Szretop
7.30.1 Szretop Company Summary
7.30.2 Szretop Business Overview
7.30.3 Szretop Digital Video Walls Major Product Offerings
7.30.4 Szretop Digital Video Walls Sales and Revenue in Global (2020-2025)
7.30.5 Szretop Key News & Latest Developments
8 Global Digital Video Walls Production Capacity, Analysis
8.1 Global Digital Video Walls Production Capacity, 2020-2032
8.2 Digital Video Walls Production Capacity of Key Manufacturers in Global Market
8.3 Global Digital Video Walls Production by Region
9 Key Market Trends, Opportunity, Drivers and Restraints
9.1 Market Opportunities & Trends
9.2 Market Drivers
9.3 Market Restraints
10 Digital Video Walls Supply Chain Analysis
10.1 Digital Video Walls Industry Value Chain
10.2 Digital Video Walls Upstream Market
10.3 Digital Video Walls Downstream and Clients
10.4 Marketing Channels Analysis
10.4.1 Marketing Channels
10.4.2 Digital Video Walls Distributors and Sales Agents in Global
11 Conclusion
12 Appendix
12.1 Note
12.2 Examples of Clients
12.3 DisclaimerList of Tables
Table 1. Key Players of Digital Video Walls in Global Market
Table 2. Top Digital Video Walls Players in Global Market, Ranking by Revenue (2024)
Table 3. Global Digital Video Walls Revenue by Companies, (US$, Mn), 2020-2025
Table 4. Global Digital Video Walls Revenue Share by Companies, 2020-2025
Table 5. Global Digital Video Walls Sales by Companies, (K Units), 2020-2025
Table 6. Global Digital Video Walls Sales Share by Companies, 2020-2025
Table 7. Key Manufacturers Digital Video Walls Price (2020-2025) & (USD/Unit)
Table 8. Global Manufacturers Digital Video Walls Product Type
Table 9. List of Global Tier 1 Digital Video Walls Companies, Revenue (US$, Mn) in 2024 and Market Share
Table 10. List of Global Tier 2 and Tier 3 Digital Video Walls Companies, Revenue (US$, Mn) in 2024 and Market Share
Table 11. Segment by Type – Global Digital Video Walls Revenue, (US$, Mn), 2024 & 2032
Table 12. Segment by Type – Global Digital Video Walls Revenue (US$, Mn), 2020-2025
Table 13. Segment by Type – Global Digital Video Walls Revenue (US$, Mn), 2026-2032
Table 14. Segment by Type – Global Digital Video Walls Sales (K Units), 2020-2025
Table 15. Segment by Type – Global Digital Video Walls Sales (K Units), 2026-2032
Table 16. Segment by Application – Global Digital Video Walls Revenue, (US$, Mn), 2024 & 2032
Table 17. Segment by Application – Global Digital Video Walls Revenue, (US$, Mn), 2020-2025
Table 18. Segment by Application – Global Digital Video Walls Revenue, (US$, Mn), 2026-2032
Table 19. Segment by Application – Global Digital Video Walls Sales, (K Units), 2020-2025
Table 20. Segment by Application – Global Digital Video Walls Sales, (K Units), 2026-2032
Table 21. By Region – Global Digital Video Walls Revenue, (US$, Mn), 2025-2032
Table 22. By Region – Global Digital Video Walls Revenue, (US$, Mn), 2020-2025
Table 23. By Region – Global Digital Video Walls Revenue, (US$, Mn), 2026-2032
Table 24. By Region – Global Digital Video Walls Sales, (K Units), 2020-2025
Table 25. By Region – Global Digital Video Walls Sales, (K Units), 2026-2032
Table 26. By Country – North America Digital Video Walls Revenue, (US$, Mn), 2020-2025
Table 27. By Country – North America Digital Video Walls Revenue, (US$, Mn), 2026-2032
Table 28. By Country – North America Digital Video Walls Sales, (K Units), 2020-2025
Table 29. By Country – North America Digital Video Walls Sales, (K Units), 2026-2032
Table 30. By Country – Europe Digital Video Walls Revenue, (US$, Mn), 2020-2025
Table 31. By Country – Europe Digital Video Walls Revenue, (US$, Mn), 2026-2032
Table 32. By Country – Europe Digital Video Walls Sales, (K Units), 2020-2025
Table 33. By Country – Europe Digital Video Walls Sales, (K Units), 2026-2032
Table 34. By Region – Asia Digital Video Walls Revenue, (US$, Mn), 2020-2025
Table 35. By Region – Asia Digital Video Walls Revenue, (US$, Mn), 2026-2032
Table 36. By Region – Asia Digital Video Walls Sales, (K Units), 2020-2025
Table 37. By Region – Asia Digital Video Walls Sales, (K Units), 2026-2032
Table 38. By Country – South America Digital Video Walls Revenue, (US$, Mn), 2020-2025
Table 39. By Country – South America Digital Video Walls Revenue, (US$, Mn), 2026-2032
Table 40. By Country – South America Digital Video Walls Sales, (K Units), 2020-2025
Table 41. By Country – South America Digital Video Walls Sales, (K Units), 2026-2032
Table 42. By Country – Middle East & Africa Digital Video Walls Revenue, (US$, Mn), 2020-2025
Table 43. By Country – Middle East & Africa Digital Video Walls Revenue, (US$, Mn), 2026-2032
Table 44. By Country – Middle East & Africa Digital Video Walls Sales, (K Units), 2020-2025
Table 45. By Country – Middle East & Africa Digital Video Walls Sales, (K Units), 2026-2032
Table 46. Barco Company Summary
Table 47. Barco Digital Video Walls Product Offerings
Table 48. Barco Digital Video Walls Sales (K Units), Revenue (US$, Mn) and Average Price (USD/Unit) & (2020-2025)
Table 49. Barco Key News & Latest Developments
Table 50. Christie Company Summary
Table 51. Christie Digital Video Walls Product Offerings
Table 52. Christie Digital Video Walls Sales (K Units), Revenue (US$, Mn) and Average Price (USD/Unit) & (2020-2025)
Table 53. Christie Key News & Latest Developments
Table 54. Daktronics Company Summary
Table 55. Daktronics Digital Video Walls Product Offerings
Table 56. Daktronics Digital Video Walls Sales (K Units), Revenue (US$, Mn) and Average Price (USD/Unit) & (2020-2025)
Table 57. Daktronics Key News & Latest Developments
Table 58. Lighthouse Company Summary
Table 59. Lighthouse Digital Video Walls Product Offerings
Table 60. Lighthouse Digital Video Walls Sales (K Units), Revenue (US$, Mn) and Average Price (USD/Unit) & (2020-2025)
Table 61. Lighthouse Key News & Latest Developments
Table 62. Planar Company Summary
Table 63. Planar Digital Video Walls Product Offerings
Table 64. Planar Digital Video Walls Sales (K Units), Revenue (US$, Mn) and Average Price (USD/Unit) & (2020-2025)
Table 65. Planar Key News & Latest Developments
Table 66. Mitsubishi Electric Company Summary
Table 67. Mitsubishi Electric Digital Video Walls Product Offerings
Table 68. Mitsubishi Electric Digital Video Walls Sales (K Units), Revenue (US$, Mn) and Average Price (USD/Unit) & (2020-2025)
Table 69. Mitsubishi Electric Key News & Latest Developments
Table 70. Delta Company Summary
Table 71. Delta Digital Video Walls Product Offerings
Table 72. Delta Digital Video Walls Sales (K Units), Revenue (US$, Mn) and Average Price (USD/Unit) & (2020-2025)
Table 73. Delta Key News & Latest Developments
Table 74. Samsung Company Summary
Table 75. Samsung Digital Video Walls Product Offerings
Table 76. Samsung Digital Video Walls Sales (K Units), Revenue (US$, Mn) and Average Price (USD/Unit) & (2020-2025)
Table 77. Samsung Key News & Latest Developments
Table 78. NEC Company Summary
Table 79. NEC Digital Video Walls Product Offerings
Table 80. NEC Digital Video Walls Sales (K Units), Revenue (US$, Mn) and Average Price (USD/Unit) & (2020-2025)
Table 81. NEC Key News & Latest Developments
Table 82. Panasonic Company Summary
Table 83. Panasonic Digital Video Walls Product Offerings
Table 84. Panasonic Digital Video Walls Sales (K Units), Revenue (US$, Mn) and Average Price (USD/Unit) & (2020-2025)
Table 85. Panasonic Key News & Latest Developments
Table 86. LG Company Summary
Table 87. LG Digital Video Walls Product Offerings
Table 88. LG Digital Video Walls Sales (K Units), Revenue (US$, Mn) and Average Price (USD/Unit) & (2020-2025)
Table 89. LG Key News & Latest Developments
Table 90. Eyevis Company Summary
Table 91. Eyevis Digital Video Walls Product Offerings
Table 92. Eyevis Digital Video Walls Sales (K Units), Revenue (US$, Mn) and Average Price (USD/Unit) & (2020-2025)
Table 93. Eyevis Key News & Latest Developments
Table 94. Sharp Company Summary
Table 95. Sharp Digital Video Walls Product Offerings
Table 96. Sharp Digital Video Walls Sales (K Units), Revenue (US$, Mn) and Average Price (USD/Unit) & (2020-2025)
Table 97. Sharp Key News & Latest Developments
Table 98. Philips Company Summary
Table 99. Philips Digital Video Walls Product Offerings
Table 100. Philips Digital Video Walls Sales (K Units), Revenue (US$, Mn) and Average Price (USD/Unit) & (2020-2025)
Table 101. Philips Key News & Latest Developments
Table 102. DynaScan Company Summary
Table 103. DynaScan Digital Video Walls Product Offerings
Table 104. DynaScan Digital Video Walls Sales (K Units), Revenue (US$, Mn) and Average Price (USD/Unit) & (2020-2025)
Table 105. DynaScan Key News & Latest Developments
Table 106. Sony Company Summary
Table 107. Sony Digital Video Walls Product Offerings
Table 108. Sony Digital Video Walls Sales (K Units), Revenue (US$, Mn) and Average Price (USD/Unit) & (2020-2025)
Table 109. Sony Key News & Latest Developments
Table 110. Toshiba Company Summary
Table 111. Toshiba Digital Video Walls Product Offerings
Table 112. Toshiba Digital Video Walls Sales (K Units), Revenue (US$, Mn) and Average Price (USD/Unit) & (2020-2025)
Table 113. Toshiba Key News & Latest Developments
Table 114. Vtron Company Summary
Table 115. Vtron Digital Video Walls Product Offerings
Table 116. Vtron Digital Video Walls Sales (K Units), Revenue (US$, Mn) and Average Price (USD/Unit) & (2020-2025)
Table 117. Vtron Key News & Latest Developments
Table 118. Sansi Company Summary
Table 119. Sansi Digital Video Walls Product Offerings
Table 120. Sansi Digital Video Walls Sales (K Units), Revenue (US$, Mn) and Average Price (USD/Unit) & (2020-2025)
Table 121. Sansi Key News & Latest Developments
Table 122. Konka Company Summary
Table 123. Konka Digital Video Walls Product Offerings
Table 124. Konka Digital Video Walls Sales (K Units), Revenue (US$, Mn) and Average Price (USD/Unit) & (2020-2025)
Table 125. Konka Key News & Latest Developments
Table 126. Leyard Company Summary
Table 127. Leyard Digital Video Walls Product Offerings
Table 128. Leyard Digital Video Walls Sales (K Units), Revenue (US$, Mn) and Average Price (USD/Unit) & (2020-2025)
Table 129. Leyard Key News & Latest Developments
Table 130. Odin Company Summary
Table 131. Odin Digital Video Walls Product Offerings
Table 132. Odin Digital Video Walls Sales (K Units), Revenue (US$, Mn) and Average Price (USD/Unit) & (2020-2025)
Table 133. Odin Key News & Latest Developments
Table 134. Absen Company Summary
Table 135. Absen Digital Video Walls Product Offerings
Table 136. Absen Digital Video Walls Sales (K Units), Revenue (US$, Mn) and Average Price (USD/Unit) & (2020-2025)
Table 137. Absen Key News & Latest Developments
Table 138. Dahua Company Summary
Table 139. Dahua Digital Video Walls Product Offerings
Table 140. Dahua Digital Video Walls Sales (K Units), Revenue (US$, Mn) and Average Price (USD/Unit) & (2020-2025)
Table 141. Dahua Key News & Latest Developments
Table 142. GQY Company Summary
Table 143. GQY Digital Video Walls Product Offerings
Table 144. GQY Digital Video Walls Sales (K Units), Revenue (US$, Mn) and Average Price (USD/Unit) & (2020-2025)
Table 145. GQY Key News & Latest Developments
Table 146. Unilumin Company Summary
Table 147. Unilumin Digital Video Walls Product Offerings
Table 148. Unilumin Digital Video Walls Sales (K Units), Revenue (US$, Mn) and Average Price (USD/Unit) & (2020-2025)
Table 149. Unilumin Key News & Latest Developments
Table 150. Changhong Company Summary
Table 151. Changhong Digital Video Walls Product Offerings
Table 152. Changhong Digital Video Walls Sales (K Units), Revenue (US$, Mn) and Average Price (USD/Unit) & (2020-2025)
Table 153. Changhong Key News & Latest Developments
Table 154. Liantronics Company Summary
Table 155. Liantronics Digital Video Walls Product Offerings
Table 156. Liantronics Digital Video Walls Sales (K Units), Revenue (US$, Mn) and Average Price (USD/Unit) & (2020-2025)
Table 157. Liantronics Key News & Latest Developments
Table 158. Vewell Company Summary
Table 159. Vewell Digital Video Walls Product Offerings
Table 160. Vewell Digital Video Walls Sales (K Units), Revenue (US$, Mn) and Average Price (USD/Unit) & (2020-2025)
Table 161. Vewell Key News & Latest Developments
Table 162. Szretop Company Summary
Table 163. Szretop Digital Video Walls Product Offerings
Table 164. Szretop Digital Video Walls Sales (K Units), Revenue (US$, Mn) and Average Price (USD/Unit) & (2020-2025)
Table 165. Szretop Key News & Latest Developments
Table 166. Digital Video Walls Capacity of Key Manufacturers in Global Market, 2023-2025 (K Units)
Table 167. Global Digital Video Walls Capacity Market Share of Key Manufacturers, 2023-2025
Table 168. Global Digital Video Walls Production by Region, 2020-2025 (K Units)
Table 169. Global Digital Video Walls Production by Region, 2026-2032 (K Units)
Table 170. Digital Video Walls Market Opportunities & Trends in Global Market
Table 171. Digital Video Walls Market Drivers in Global Market
Table 172. Digital Video Walls Market Restraints in Global Market
Table 173. Digital Video Walls Raw Materials
Table 174. Digital Video Walls Raw Materials Suppliers in Global Market
Table 175. Typical Digital Video Walls Downstream
Table 176. Digital Video Walls Downstream Clients in Global Market
Table 177. Digital Video Walls Distributors and Sales Agents in Global Market

List of Figures
Figure 1. Digital Video Walls Product Picture
Figure 2. Digital Video Walls Segment by Type in 2024
Figure 3. Digital Video Walls Segment by Application in 2024
Figure 4. Global Digital Video Walls Market Overview: 2024
Figure 5. Key Caveats
Figure 6. Global Digital Video Walls Market Size: 2024 VS 2032 (US$, Mn)
Figure 7. Global Digital Video Walls Revenue: 2020-2032 (US$, Mn)
Figure 8. Digital Video Walls Sales in Global Market: 2020-2032 (K Units)
Figure 9. The Top 3 and 5 Players Market Share by Digital Video Walls Revenue in 2024
Figure 10. Segment by Type – Global Digital Video Walls Revenue, (US$, Mn), 2024 & 2032
Figure 11. Segment by Type – Global Digital Video Walls Revenue Market Share, 2020-2032
Figure 12. Segment by Type – Global Digital Video Walls Sales Market Share, 2020-2032
Figure 13. Segment by Type – Global Digital Video Walls Price (USD/Unit), 2020-2032
Figure 14. Segment by Application – Global Digital Video Walls Revenue, (US$, Mn), 2024 & 2032
Figure 15. Segment by Application – Global Digital Video Walls Revenue Market Share, 2020-2032
Figure 16. Segment by Application – Global Digital Video Walls Sales Market Share, 2020-2032
Figure 17. Segment by Application -Global Digital Video Walls Price (USD/Unit), 2020-2032
Figure 18. By Region – Global Digital Video Walls Revenue, (US$, Mn), 2025 & 2032
Figure 19. By Region – Global Digital Video Walls Revenue Market Share, 2020 VS 2024 VS 2032
Figure 20. By Region – Global Digital Video Walls Revenue Market Share, 2020-2032
Figure 21. By Region – Global Digital Video Walls Sales Market Share, 2020-2032
Figure 22. By Country – North America Digital Video Walls Revenue Market Share, 2020-2032
Figure 23. By Country – North America Digital Video Walls Sales Market Share, 2020-2032
Figure 24. United States Digital Video Walls Revenue, (US$, Mn), 2020-2032
Figure 25. Canada Digital Video Walls Revenue, (US$, Mn), 2020-2032
Figure 26. Mexico Digital Video Walls Revenue, (US$, Mn), 2020-2032
Figure 27. By Country – Europe Digital Video Walls Revenue Market Share, 2020-2032
Figure 28. By Country – Europe Digital Video Walls Sales Market Share, 2020-2032
Figure 29. Germany Digital Video Walls Revenue, (US$, Mn), 2020-2032
Figure 30. France Digital Video Walls Revenue, (US$, Mn), 2020-2032
Figure 31. U.K. Digital Video Walls Revenue, (US$, Mn), 2020-2032
Figure 32. Italy Digital Video Walls Revenue, (US$, Mn), 2020-2032
Figure 33. Russia Digital Video Walls Revenue, (US$, Mn), 2020-2032
Figure 34. Nordic Countries Digital Video Walls Revenue, (US$, Mn), 2020-2032
Figure 35. Benelux Digital Video Walls Revenue, (US$, Mn), 2020-2032
Figure 36. By Region – Asia Digital Video Walls Revenue Market Share, 2020-2032
Figure 37. By Region – Asia Digital Video Walls Sales Market Share, 2020-2032
Figure 38. China Digital Video Walls Revenue, (US$, Mn), 2020-2032
Figure 39. Japan Digital Video Walls Revenue, (US$, Mn), 2020-2032
Figure 40. South Korea Digital Video Walls Revenue, (US$, Mn), 2020-2032
Figure 41. Southeast Asia Digital Video Walls Revenue, (US$, Mn), 2020-2032
Figure 42. India Digital Video Walls Revenue, (US$, Mn), 2020-2032
Figure 43. By Country – South America Digital Video Walls Revenue Market Share, 2020-2032
Figure 44. By Country – South America Digital Video Walls Sales, Market Share, 2020-2032
Figure 45. Brazil Digital Video Walls Revenue, (US$, Mn), 2020-2032
Figure 46. Argentina Digital Video Walls Revenue, (US$, Mn), 2020-2032
Figure 47. By Country – Middle East & Africa Digital Video Walls Revenue, Market Share, 2020-2032
Figure 48. By Country – Middle East & Africa Digital Video Walls Sales, Market Share, 2020-2032
Figure 49. Turkey Digital Video Walls Revenue, (US$, Mn), 2020-2032
Figure 50. Israel Digital Video Walls Revenue, (US$, Mn), 2020-2032
Figure 51. Saudi Arabia Digital Video Walls Revenue, (US$, Mn), 2020-2032
Figure 52. UAE Digital Video Walls Revenue, (US$, Mn), 2020-2032
Figure 53. Global Digital Video Walls Production Capacity (K Units), 2020-2032
Figure 54. The Percentage of Production Digital Video Walls by Region, 2024 VS 2032
Figure 55. Digital Video Walls Industry Value Chain
Figure 56. Marketing Channels