Digital Twin Visualization Market Insights
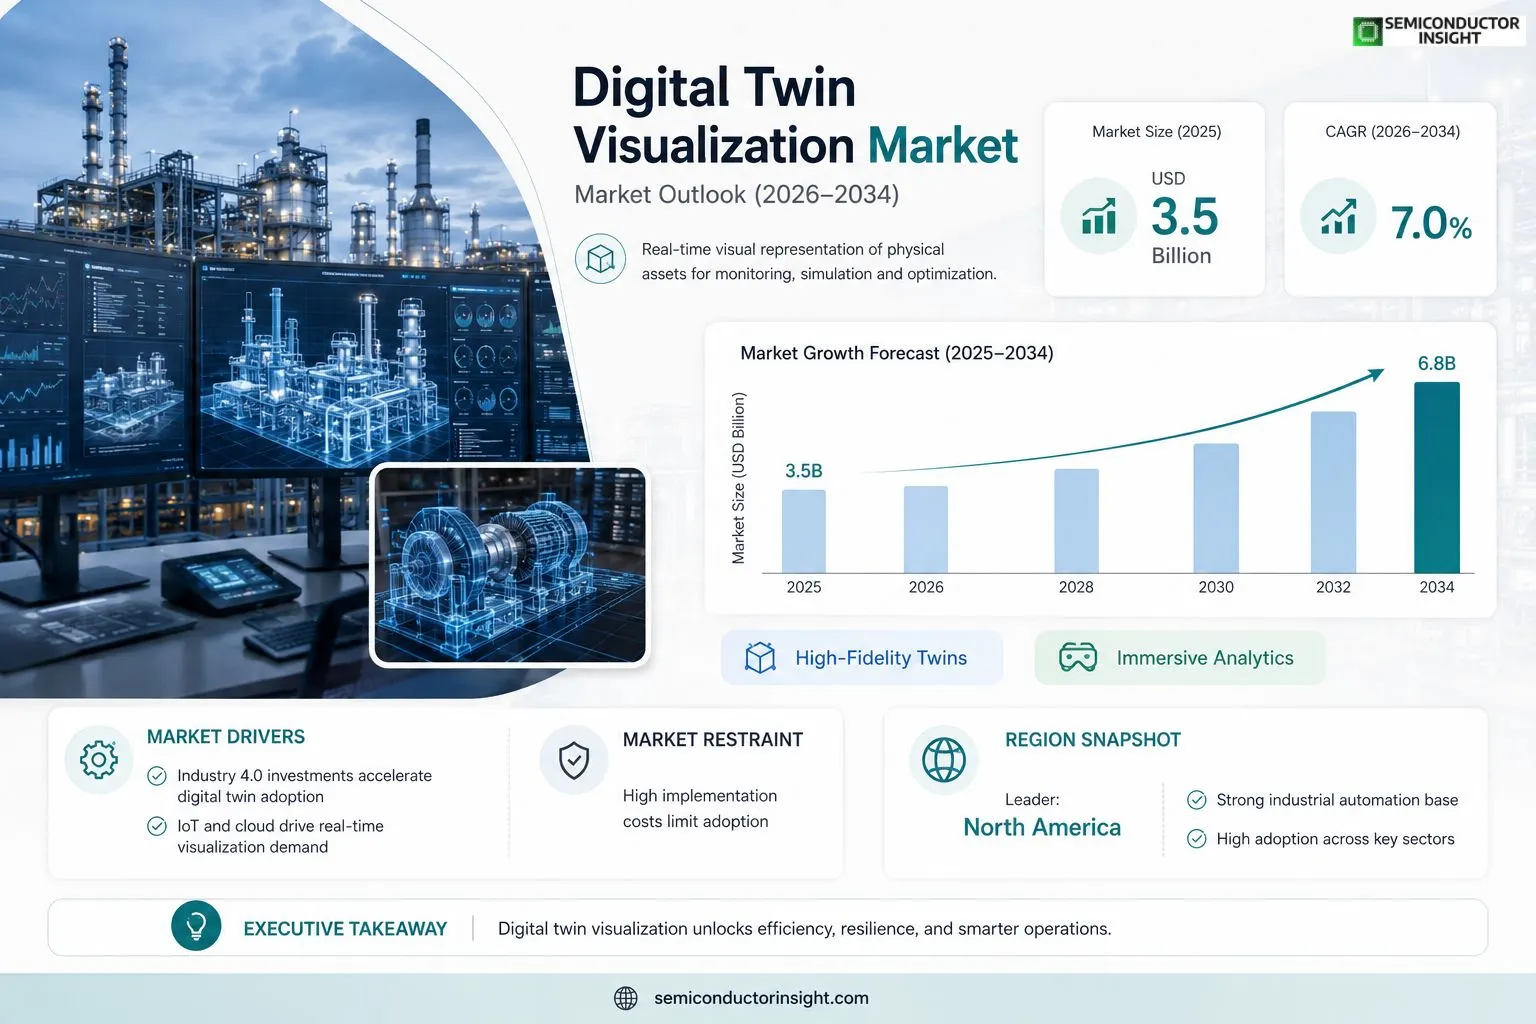
Global Digital Twin Visualization Market size was valued at USD 3.5 billion in 2025. The market is projected to grow from USD 4.1 billion in 2026 to USD 6.8 billion by 2034, exhibiting a CAGR of 7.0% during the forecast period.
Digital twin visualization refers to the real‑time graphical representation of physical assets, processes or systems within a virtual environment, enabling stakeholders to monitor performance, simulate scenarios and optimize operations through immersive analytics.The market is experiencing rapid growth because enterprises are investing heavily in Industry 4.0 initiatives, while the rise of IoT sensors and cloud computing fuels demand for high‑fidelity visual twins. Furthermore, advancements in AR/VR technologies enhance user interaction, and leading vendors such as Siemens PLM, Dassault Systèmes, ANSYS and PTC are expanding their portfolios through strategic partnerships and acquisitions.
MARKET DRIVERS
Technological Advancement and Real‑time Data Integration
Digital Twin Visualization Market is propelled by rapid advancements in IoT sensors, edge computing, and high‑definition rendering engines that enable seamless real‑time replication of physical assets. Enterprises are increasingly adopting these capabilities to improve predictive maintenance and operational efficiency.
Growing Demand for Immersive Decision‑Making Tools
Manufacturers and smart‑city planners are leveraging immersive 3‑D visualizations to explore “what‑if” scenarios, reducing the time required for design validation. This shift toward visual analytics fuels higher investment in simulation platforms.
➤ Companies that integrate AI‑driven analytics with digital twins report up to a 20% improvement in asset uptime.
Regulatory pressures for energy efficiency and sustainability also drive adoption, as visual insights help organizations demonstrate compliance and optimize resource consumption.
MARKET CHALLENGES
High Implementation Costs and Skill Gaps
Deploying comprehensive digital twin visual solutions often requires substantial capital outlay for hardware, software licenses, and integration services. Additionally, a shortage of skilled professionals capable of managing complex 3‑D environments hampers rapid rollout.
Other Challenges
Data Security and Interoperability
Ensuring secure data exchange between legacy systems and cloud‑based visualization platforms remains a critical obstacle. Fragmented data standards can lead to integration delays and increased project risk.
MARKET RESTRAINTS
Limited ROI Visibility in Early Adoption Phases
Early‑stage adopters often struggle to quantify the financial return of digital twin visualizations, particularly when benefits such as risk mitigation and long‑term efficiency gains are not immediately apparent. This uncertainty can deter mid‑size firms from committing resources.
MARKET OPPORTUNITIES
Expansion into Industry 4.0 Ecosystems
As Industry 4.0 ecosystems mature, Digital Twin Visualization Market is positioned to capitalize on cross‑sector collaborations, especially in aerospace, automotive, and healthcare. Integration with AI, AR/VR, and blockchain offers new revenue streams and differentiated service models.Emerging markets in Southeast Asia and Latin America present untapped demand, driven by rapid urbanization and government initiatives supporting smart infrastructure. Tailoring affordable, cloud‑native visualization solutions to these regions can unlock significant growth.
Digital Twin Visualization Market Trends
Integration with Industry 4.0 Initiatives
Digital Twin Visualization Market is being reshaped by the accelerating adoption of Industry 4.0 frameworks across manufacturing, energy, and transportation sectors. Enterprises are linking high‑resolution sensor streams to virtual replicas, allowing real‑time performance monitoring and predictive scenario testing. This integration reduces downtime, optimizes resource allocation, and creates a data‑rich environment where analytics can be visualized instantly. As companies expand their IoT footprints, the demand for seamless visual layers that translate raw data into actionable insights grows, positioning visualization platforms as a central component of digital transformation strategies.
Other Trends
AR/VR Enhanced Interactivity
Augmented and virtual reality tools are adding a new dimension to Digital Twin Visualization Market by enabling immersive interaction with digital replicas. Stakeholders can walk through virtual factories, overlay maintenance procedures on equipment models, or simulate emergency responses in a 3‑D space. This heightened interactivity shortens the learning curve for complex systems and improves cross‑functional collaboration, as design, operations, and field teams share a common visual reference. Vendors are increasingly bundling AR/VR modules with core visualization suites, driving adoption in sectors where spatial awareness directly influences safety and efficiency.
Cloud‑Based Collaborative Platforms
Cloud architecture is becoming the backbone of Digital Twin Visualization Market, delivering scalable compute power and universal access to visual data. By hosting twin environments in the cloud, organizations enable remote teams to co‑create, edit, and analyze models without geographic constraints. Integrated version‑control and real‑time synchronization ensure that all participants work from the latest representation, fostering agile decision‑making. Moreover, cloud services simplify the integration of AI‑driven analytics, allowing predictive insights to be visualized alongside live operational data, thereby enhancing the strategic value of digital twins for enterprise leadership.
COMPETITIVE LANDSCAPEKey Industry Players
Digital Twin Visualization Market Competitive Overview
Digital Twin Visualization Market is anchored by a handful of technology giants that have integrated high‑fidelity graphics, IoT data pipelines, and cloud infrastructure into unified platforms. Siemens PLM and Dassault Systèmes lead the enterprise segment by offering end‑to‑end solutions that combine CAD, simulation, and real‑time visual analytics, allowing manufacturers to create immersive digital replicas of factories and equipment. ANSYS complements this tier with advanced simulation‑driven visualization, targeting sectors such as aerospace and automotive where precision modeling is critical. These incumbents shape a market structure characterized by large‑scale contracts, robust partner ecosystems, and a focus on cross‑domain interoperability, creating high entry barriers for newcomers.Beyond the dominant tier, a diverse set of niche players drives innovation in specialized use cases. PTC and Autodesk leverage AR/VR extensions to enhance field service and design collaboration, while IBM and Microsoft focus on cloud‑native analytics and AI‑enhanced visualization stacks. GE Digital and Honeywell provide industry‑specific dashboards for energy and process automation, whereas Altair Engineering, Unity Technologies, and Trimble target simulation‑intensive and geospatial visualization niches. These companies expand the competitive landscape by delivering flexible, modular solutions that address vertical requirements and enable rapid deployment of digital twin visual interfaces.
List of Key Digital Twin Visualization Companies Profiled
- Siemens PLM
- Dassault Systèmes
- ANSYS
- PTC
- Autodesk
- IBM
- Microsoft
- GE Digital
- Altair Engineering
- Honeywell
- Unity Technologies
- Trimble
- Bosch Software Innovations
- AS PT (Aspen Technology)
- Samsung SDS
Segment Analysis:
| Segment Category | Sub-Segments | Key Insights |
| By Type |
|
Real‑time Analytics
|
| By Application |
|
Manufacturing
|
| By End User |
|
Original Equipment Manufacturers (OEMs)
|
| By [Segment Category 3]] |
|
N/A
|
| By [Segment Category 4]] |
|
N/A
|
Regional Analysis: North America
North America
The manufacturing sector in North America is witnessing a surge in the implementation of digital twin visualization to optimize production processes, enhance quality control, and improve supply chain management. The ability to simulate and analyze real-world scenarios through digital twins allows manufacturers to identify bottlenecks, predict potential issues, and make data-backed decisions for increased efficiency and reduced downtime.
The energy industry, including oil & gas, power generation, and renewable energy, is leveraging digital twin visualization to monitor asset performance, optimize energy consumption, and ensure safety. Creating virtual replicas of power plants, pipelines, and wind farms facilitates proactive maintenance, risk assessment, and improved operational efficiency. The focus on sustainable energy solutions further drives the demand for digital twins to optimize renewable energy systems.
Aerospace and defense companies in North America are employing digital twin visualization for aircraft design, testing, and maintenance. These technologies enable engineers to simulate flight conditions, analyze performance data, and predict potential failures, leading to enhanced safety and reduced development costs. Digital twins also play a crucial role in optimizing aircraft maintenance schedules and improving overall operational efficiency.
The healthcare sector in North America is exploring the use of digital twin visualization for patient-specific modeling, surgical planning, and optimizing hospital operations. Creating digital replicas of patients allows medical professionals to simulate treatments, predict outcomes, and personalize care plans. This application holds significant potential for improving patient care and reducing healthcare costs.
Europe
Europe represents the second-largest market for Digital Twin Visualization. The region’s strong industrial base, particularly in automotive, aerospace, and manufacturing, provides a solid foundation for adoption. Government initiatives promoting Industry 4.0 and digital transformation are further accelerating market growth. Key trends include the integration of digital twins with IoT devices and the use of artificial intelligence for predictive analytics within these platforms. The focus on sustainability and circular economy principles is also driving demand for digital twins to optimize resource utilization and minimize environmental impact.
Asia-Pacific
Asia-Pacific is emerging as a high-growth market for Digital Twin Visualization, driven by rapid industrialization, increasing investments in smart infrastructure, and a growing adoption of digital technologies. Countries like China, Japan, and South Korea are leading the way in implementing digital twin solutions across various industries, including manufacturing, energy, and transportation. The region’s strong manufacturing sector, coupled with government support for innovation, creates a favorable environment for market expansion. The increasing availability of skilled talent and the development of local digital twin platforms are also contributing to this growth.
South America
South America is witnessing a gradual but steady increase in the adoption of Digital Twin Visualization. The region’s industrial sector is undergoing modernization, with a growing focus on improving operational efficiency and optimizing asset performance. Key drivers include the expansion of the mining industry, the development of smart cities, and the increasing availability of digital infrastructure. While the market is still relatively nascent compared to North America and Europe, it holds significant potential for future growth.
Middle East & Africa
The Middle East & Africa region presents a promising, albeit developing, market for Digital Twin Visualization. Investments in infrastructure projects, smart city initiatives, and resource management are fueling demand. The oil & gas sector is a major adopter in the Middle East, leveraging digital twins for asset monitoring and predictive maintenance. Africa is seeing increasing interest in digital twins for urban planning, infrastructure development, and resource optimization, particularly in the energy and agriculture sectors. The adoption is expected to accelerate with continued technological advancements and increased digital literacy.
Report Scope
This market research report provides a comprehensive analysis of the Digital Twin Visualization Market , covering the forecast period 2026–2034. It offers detailed insights into market dynamics, technological advancements, competitive landscape, and key trends shaping the industry.
Key focus areas of the report include:
- Market Overview: The report begins with an overview outlining its current market scenario, key growth indicators, and industry transformation drivers. It discusses macroeconomic factors, demand–supply balance, regulatory landscape, and the strategic role of semiconductors in powering advancements across industries such as automotive, telecommunications, consumer electronics, and industrial automation.
- Market Size & Forecast: Historical data and future projections for revenue, unit shipments, and market value across major regions and segments.
- Segmentation Analysis: Detailed breakdown by product type, technology, application, and end-user industry to identify high-growth segments and investment opportunities.
- Regional Insights: Insights into market performance across North America, Europe, Asia-Pacific, Latin America, and the Middle East & Africa, including country-level analysis where relevant.
- Competitive Landscape: Profiles of leading market participants, including their product offerings, R&D focus, manufacturing capacity, pricing strategies, and recent developments such as mergers, acquisitions, and partnerships.
- Technology Trends & Innovation: Assessment of emerging technologies, integration of AI/IoT, semiconductor design trends, fabrication techniques, and evolving industry standards.
- Market Drivers & Restraints: Evaluation of factors driving market growth along with challenges, supply chain constraints, regulatory issues, and market-entry barriers.
- Stakeholder Insights: Insights for component suppliers, OEMs, system integrators, investors, and policymakers regarding the evolving ecosystem and strategic opportunities.
Primary and secondary research methods are employed, including interviews with industry experts, data from verified sources, and real-time market intelligence to ensure the accuracy and reliability of the insights presented.
FREQUENTLY ASKED QUESTIONS:
What is the current market size of Digital Twin Visualization Market?
-> Digital Twin Visualization Market was valued at USD 3.5 billion in 2025 and is expected to reach USD 6.8 billion by 2034 with a CAGR of 7.0% during the forecast period.
Which key companies operate in Digital Twin Visualization Market?
-> Key players include Siemens PLM, Dassault Systèmes, ANSYS and PTC, among others.
What are the key growth drivers?
-> Key growth drivers include heavy Industry 4.0 investments, proliferation of IoT sensors, cloud‑computing adoption, and advancements in AR/VR technologies.
Which region dominates the market?
-> Asia-Pacific is the fastest‑growing region, while Europe remains a dominant market.
What are the emerging trends?
-> Emerging trends include high‑fidelity visual twins, immersive analytics, and strategic partnerships among leading vendors.

Get Sample Report PDF for Exclusive Insights
Report Sample Includes
- Table of Contents
- List of Tables & Figures
- Charts, Research Methodology, and more...
 Download Sample Report PDF