Digital Scanner Market, Trends, Business Strategies 2025-2032

Digital Scanner Market was valued at 306 million in 2024 and is projected to reach US$ 439 million by 2032, at a CAGR of 5.3% during the forecast period

PDF Icon Download Sample Report PDF
  • Quick Dispatch

    All Orders

  • Secure Payment

    100% Secure Payment

Price range: $1,500.00 through $4,250.00

Clear

MARKET INSIGHTS

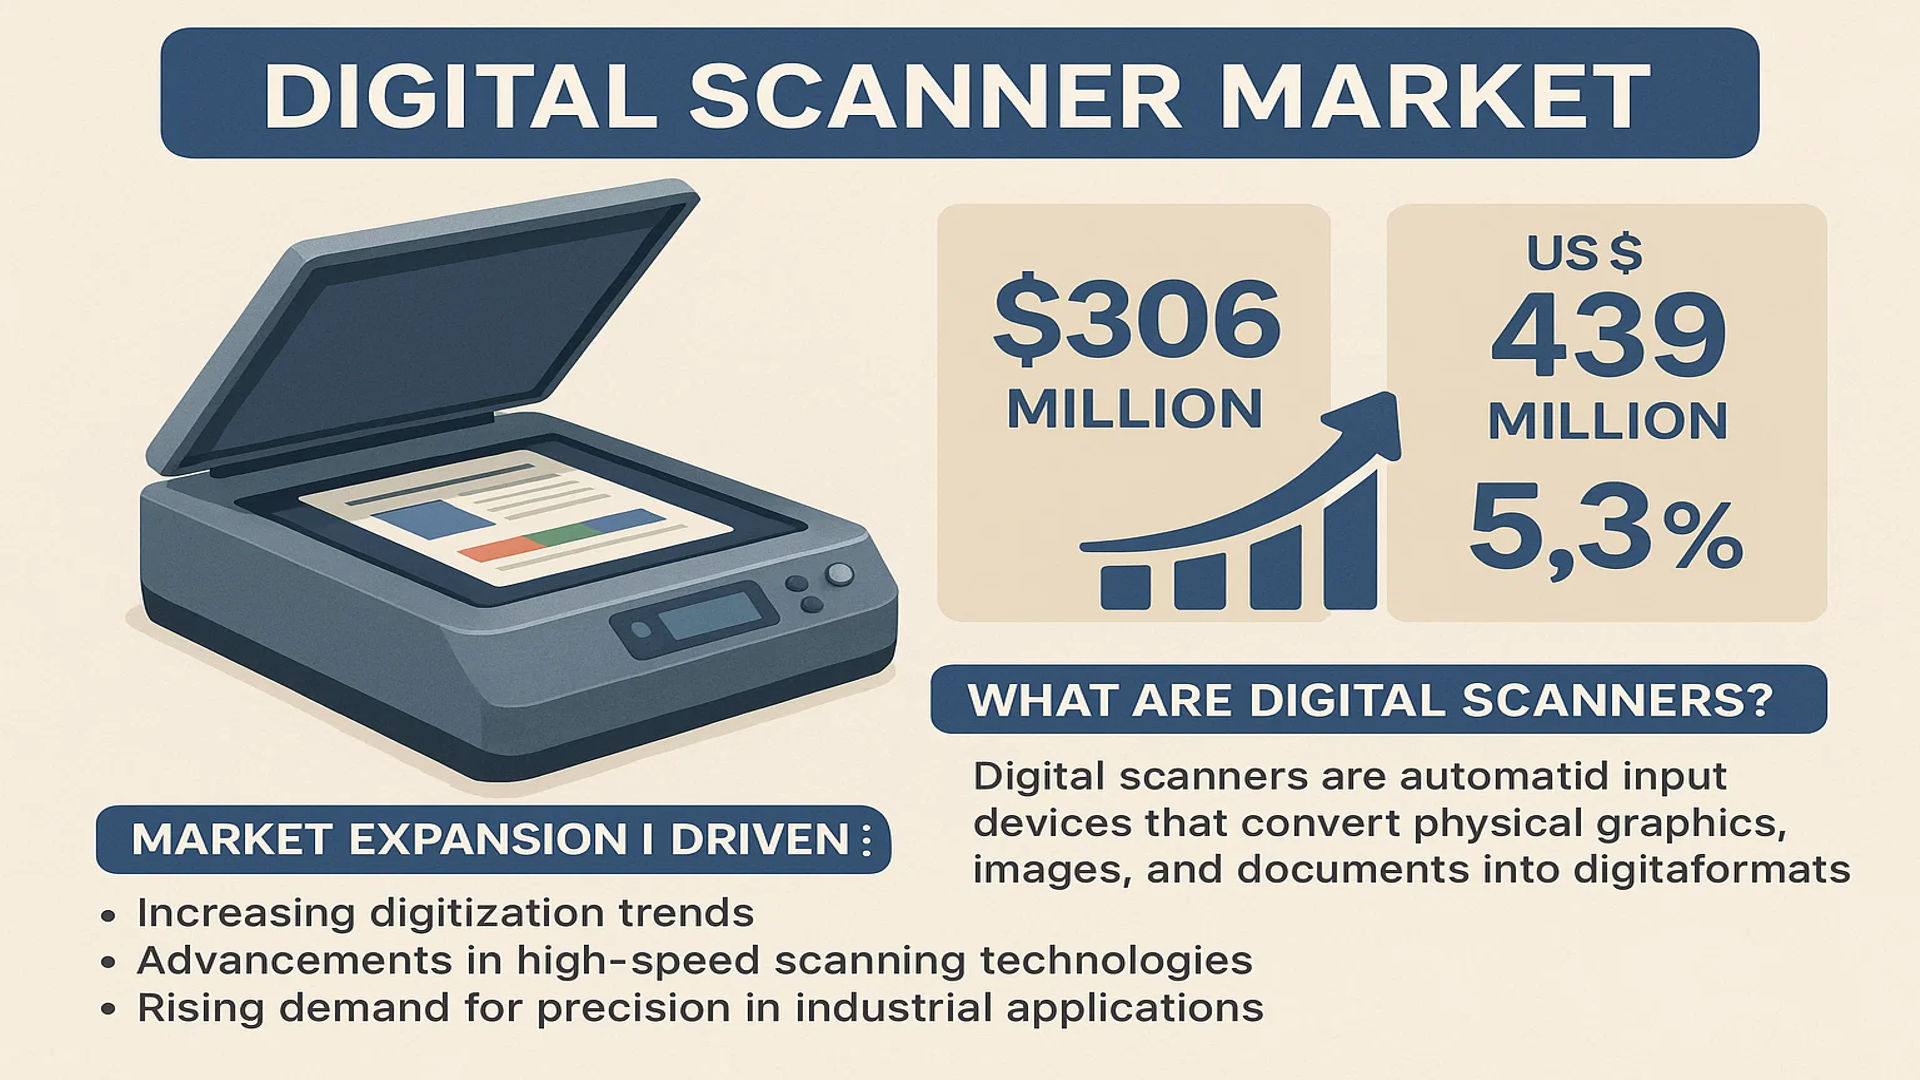
The global Digital Scanner Market was valued at 306 million in 2024 and is projected to reach US$ 439 million by 2032, at a CAGR of 5.3% during the forecast period.

Digital scanners are automated input devices that convert physical graphics, images, and documents into digital formats. Utilizing photoelectric technology, these devices detect light signals, transform them into electrical signals, and further convert them into digital data via analog-to-digital (A/D) converters. The processed data is then transmitted to computers for editing, storage, or output. These scanners are widely adopted across industries such as manufacturing, healthcare, and cultural preservation for applications like quality control, 3D modeling, and archival digitization.

Market expansion is driven by increasing digitization trends, advancements in high-speed scanning technologies, and rising demand for precision in industrial applications. The U.S. holds a dominant market position, while China exhibits rapid growth potential. Key players like FARO Technologies, Hexagon, and 3D Systems are focusing on innovation and strategic partnerships to strengthen their market presence. For instance, handheld and high-speed scanners are gaining traction due to their portability and efficiency, contributing to segment growth.

Digital Scanner Market

MARKET DYNAMICS

MARKET DRIVERS

Rising Demand for High-Speed 3D Scanning in Industrial Applications Accelerates Market Growth

The digital scanner market is experiencing robust growth due to increasing adoption in industrial manufacturing and quality control applications. Advanced 3D scanning technologies enable rapid measurement and inspection of complex components with micron-level precision, reducing production errors by up to 40% compared to traditional methods. Industries such as aerospace, automotive, and heavy machinery are investing heavily in portable 3D scanners to streamline reverse engineering and metrology processes, with high-speed models accounting for nearly 32% of total market revenue in 2024.

Healthcare Digitization Boom Expands Scanning Adoption

Medical facilities worldwide are transitioning to digital workflows, driving demand for specialized document and imaging scanners. The hospital digitization rate has increased from 58% in 2020 to over 72% in 2024, creating sustained demand for high-volume document scanners. Meanwhile, handheld 3D scanners are revolutionizing patient-specific medical device manufacturing and surgical planning, with dental applications alone representing 18% of the medical scanning segment. This dual demand from administrative and clinical applications creates robust growth opportunities across scanner categories.

The integration of AI-powered auto-categorization in document scanners has reduced medical records processing time by 65%, accelerating ROI for healthcare providers.

Furthermore, government mandates for electronic health records and the expansion of telemedicine services globally continue to fuel scanner adoption in the healthcare vertical. This sector is projected to maintain a 7.2% CAGR through 2032, exceeding overall market growth rates.

MARKET RESTRAINTS

High Initial Investment Costs Restrict SME Adoption

While premium 3D scanning systems deliver exceptional accuracy, their substantial upfront costs create barriers for small and mid-sized enterprises. Industrial-grade scanners with sub-millimeter precision carry price tags exceeding $50,000, requiring 18-24 months for ROI realization. This pricing structure has limited penetration in price-sensitive emerging markets where manual measurement alternatives remain prevalent. Even document scanning solutions with advanced features often carry 30-40% cost premiums over basic models, slowing replacement cycles.

Technical Complexities in High-Precision Applications
Achieving consistent accuracy in challenging environments presents ongoing technical hurdles. Factors like surface reflectivity, ambient lighting conditions, and material properties can degrade scan quality, requiring expensive add-ons or repeated scans. The learning curve for advanced scanning software remains steep, with certification programs typically requiring 80+ hours of training for full operator competency. These technical barriers discourage rapid scaling in industrial environments where reliability is paramount.

MARKET OPPORTUNITIES

Emerging Hybrid Scanning Technologies Open New Application Avenues

The convergence of photogrammetry and structured light scanning presents transformative opportunities across multiple sectors. Next-gen hybrid systems combine the portability of handheld scanners with the accuracy of fixed systems, achieving tolerances under 0.01mm while reducing setup time by 60%. These advancements are unlocking new use cases in areas like heritage preservation, where high-detail scanning of delicate artifacts was previously impractical. Similarly, manufacturing applications benefit from hybrid systems’ ability to capture both macro geometries and micro surface details simultaneously.

Cloud-Based Scanning Ecosystems Create Recurring Revenue Streams

Scanner manufacturers are transitioning towards service-based models through cloud platform integrations. These solutions enable real-time data processing, remote collaboration, and AI-powered analysis – features that command 20-30% premium subscription fees. Early adopters report 40% higher customer retention rates with cloud-connected devices compared to standalone units. The shift also facilitates predictive maintenance capabilities through IoT connectivity, reducing field service costs while improving equipment uptime.

MARKET CHALLENGES

Intense Market Competition Squeezes Profit Margins

The digital scanner landscape has become increasingly crowded, with over 50 active manufacturers competing across price segments. Industry-wide average selling prices have declined 12% since 2020 due to Chinese manufacturers entering mid-range markets. While premium brands maintain technological advantages, the proliferation of “good enough” alternatives at 40-50% lower price points pressures R&D budgets. This competitive dynamic forces continuous innovation while maintaining cost discipline – a balance that challenges even established players.

Regulatory Compliance Adds Development Complexity
Evolving data security standards and product certifications create development bottlenecks. Medical scanners must comply with HIPAA, GDPR, and various regional healthcare data protocols, adding 6-9 months to product cycles. Industrial models require UL, CE, and other safety certifications that vary by territory. These compliance requirements increase time-to-market while raising development costs by an estimated 15-20%, particularly for global product launches.

DIGITAL SCANNER MARKET TRENDS

Demand for High-Speed Scanning Solutions to Drive Market Growth

The digital scanner market is witnessing significant growth, driven by the rising need for high-speed scanning solutions across industries such as manufacturing, healthcare, and cultural heritage preservation. With increasing digitization, companies are adopting automated scanning devices to streamline data capture, enhance accuracy, and reduce operational costs. High-speed scanners, which now account for over 40% of global market revenue, enable rapid processing of large-scale documents, 3D models, and engineering blueprints. These scanners are particularly crucial in manufacturing, where precision and efficiency in reverse engineering and quality control are paramount.

Other Trends

Adoption of Handheld 3D Scanners in Healthcare

The healthcare sector is increasingly leveraging digital scanners, especially handheld 3D variants, for medical imaging, prosthetics design, and surgical planning. A growing aging population and advancements in minimally invasive surgical techniques are boosting the adoption of precise scanning devices. In dentistry, for example, digital intraoral scanners have reduced traditional mold-taking processes from hours to minutes, improving patient comfort and workflow efficiency. The healthcare segment is projected to grow at a CAGR of 6.8% by 2032, driven by expanding applications in telemedicine and remote diagnostics.

Integration of AI and Cloud-Based Scanning Solutions

Artificial Intelligence (AI) and cloud-based processing are transforming digital scanners into smart, connected devices. Advanced algorithms now enhance image recognition, noise reduction, and automated measurement extraction—reducing human intervention by up to 30%. Cloud integration allows real-time data sharing and collaborative workflows, particularly beneficial for global engineering teams and archival projects. Museums, for instance, utilize AI-powered scanners for artifact preservation, creating high-resolution digital twins that can be studied without risking damage to original pieces.

COMPETITIVE LANDSCAPE

Key Industry Players

Innovation and Strategic Expansion Drive Competitive Edge in Digital Scanning

The global digital scanner market features a diverse mix of established multinational players and emerging challengers. With industrial applications expanding across manufacturing, healthcare, and cultural preservation sectors, competitors are aggressively investing in higher precision, faster processing speeds, and AI-powered scanning solutions. This technological arms race is reshaping market dynamics as companies position themselves for the projected $439 million valuation by 2032.

FARO Technologies and Hexagon currently dominate the high-end segment, leveraging their expertise in industrial measurement systems. Both companies reported year-over-year revenue growth in their digital scanning divisions through 2024, capitalizing on demand from automotive and aerospace manufacturers requiring sub-millimeter accuracy for quality control processes.

The handheld scanner segment sees intense competition between Artec 3D and Shining 3D, with both companies recently launching lighter, more ergonomic designs featuring real-time mesh processing. This innovation push comes as museums and archaeological teams increasingly adopt portable scanners for artifact preservation, creating a high-growth niche within the broader market.

Healthcare applications represent another battleground, where ZEISS and Nikon Metrology are making strategic inroads. Their medical-grade scanners demonstrate how the industry is moving beyond traditional manufacturing uses. Recent FDA clearances for diagnostic scanning systems indicate this segment could drive disproportionate growth in coming years, with companies actively forming partnerships with hospital networks and research institutions.

List of Key Digital Scanner Manufacturers Profiled

  • FARO Technologies (U.S.)
  • Creaform (Canada)
  • Artec 3D (Luxembourg)
  • 3D Systems (U.S.)
  • Hexagon AB (Sweden)
  • Shining 3D (China)
  • Trimble Inc. (U.S.)
  • Nikon Metrology (Japan)
  • ZEISS Group (Germany)
  • Hewlett-Packard Development Company (U.S.)
  • Epson (Japan)
  • NextEngine (U.S.)
  • Leica Geosystems (Switzerland)
  • Zebra Technologies (U.S.)

Segment Analysis:

By Type

High-Speed Scanners Lead the Market Owing to Rising Demand in Industrial and Medical Applications

The market is segmented based on type into:

  • High-Speed Scanners
  • Handheld Scanners
    • Subtypes: Laser, Structured Light, and Others
  • Desktop Scanners
  • Other Specialized Scanners

By Application

Manufacturing and Engineering Design Segment Drives Market Growth Due to Increasing Automation and Digitalization

The market is segmented based on application into:

  • Manufacturing and Engineering Design
  • Cultural Heritage and Museums
  • Medicine and Healthcare
    • Subtypes: Dental Imaging, Prosthetics, and Others
  • Architecture and Construction
  • Other Applications

Regional Analysis: Digital Scanner Market

Asia-Pacific
The Asia-Pacific region dominates the global digital scanner market, accounting for the largest share in 2024, driven primarily by rapid industrialization and technological advancements in countries like China, Japan, and India. China, as the manufacturing hub of the world, witnesses significant adoption of high-speed digital scanners for industrial automation and quality control. Japan leads in precision engineering applications, particularly in electronics manufacturing. Meanwhile, India’s growing healthcare and infrastructure sectors are fueling demand for portable and handheld scanning solutions. The region benefits from strong government support for digital transformation initiatives and the presence of local manufacturers offering cost-competitive alternatives to international brands.

North America
North America represents the second-largest market for digital scanners, characterized by early adoption of advanced technologies and high investments in R&D. The U.S. leads the region with extensive applications in healthcare (for medical imaging and diagnostics), aerospace (for component inspection), and cultural heritage preservation. Strict quality standards in manufacturing and the presence of major players like FARO Technologies and 3D Systems drive innovation in high-precision scanning solutions. Canada’s growing engineering and construction sectors contribute to steady demand for 3D scanning technologies, particularly in infrastructure development projects.

Europe
Europe maintains a strong position in the digital scanner market, with Germany, France, and the U.K. as key contributors. The region excels in high-end industrial applications, especially in automotive manufacturing and aerospace, where precision scanning is critical for quality assurance. Strict EU regulations regarding product quality and safety standards encourage adoption of advanced scanning technologies. The cultural heritage sector also presents significant opportunities, with museums and conservation projects increasingly digitizing artifacts. European manufacturers focus on developing eco-friendly and energy-efficient scanners to align with the region’s sustainability goals.

South America
The South American digital scanner market is emerging, with Brazil and Argentina showing promising growth. While adoption rates trail behind more developed regions, increasing industrialization and infrastructure projects are driving demand, particularly in the construction and mining sectors. Economic volatility and limited technology budgets pose challenges, but the market benefits from growing awareness of digital scanning benefits in quality control and reverse engineering. Local manufacturers are entering the market with cost-effective solutions tailored to regional needs.

Middle East & Africa
This region demonstrates the fastest growth potential, albeit from a smaller base. The UAE and Saudi Arabia lead in adoption, fueled by smart city initiatives and infrastructure megaprojects requiring advanced scanning technologies. The oil & gas industry represents a key application area for inspection and maintenance. While limited local manufacturing capabilities result in reliance on imports, government initiatives to diversify economies are creating new opportunities. South Africa shows particular promise in healthcare and mining applications, though market expansion is constrained by infrastructure challenges in some areas.

Report Scope

This market research report provides a comprehensive analysis of the Global Digital Scanner market, covering the forecast period 2024–2032. It offers detailed insights into market dynamics, technological advancements, competitive landscape, and key trends shaping the industry.

Key focus areas of the report include:

  • Market Size & Forecast: Historical data and future projections for revenue, unit shipments, and market value across major regions and segments. The global Digital Scanner market was valued at USD 306 million in 2024 and is projected to reach USD 439 million by 2032, at a CAGR of 5.3%.
  • Segmentation Analysis: Detailed breakdown by product type (High Speed, Handheld, Others), application (Manufacturing & Engineering Design, Cultural Heritage, Healthcare), and end-user industry to identify high-growth segments.
  • Regional Outlook: Insights into market performance across North America, Europe, Asia-Pacific, Latin America, and Middle East & Africa. The U.S. and China represent key growth markets.
  • Competitive Landscape: Profiles of leading market participants including FARO Technologies, Creaform, Artec 3D, 3D Systems, Hexagon, their product portfolios, R&D focus, and recent M&A activities.
  • Technology Trends & Innovation: Assessment of photoelectric scanning technologies, A/D conversion advancements, and integration with digital workflows.
  • Market Drivers & Restraints: Evaluation of digital transformation initiatives, Industry 4.0 adoption versus high equipment costs and technical complexity.
  • Stakeholder Analysis: Strategic insights for OEMs, system integrators, and investors in the digital scanning ecosystem.

Research methodology combines primary interviews with industry experts and analysis of verified market data from authoritative sources to ensure accuracy.

FREQUENTLY ASKED QUESTIONS:

What is the current market size of Global Digital Scanner Market?

-> Digital Scanner Market was valued at 306 million in 2024 and is projected to reach US$ 439 million by 2032, at a CAGR of 5.3% during the forecast period.

Which key companies operate in Global Digital Scanner Market?

-> Key players include FARO Technologies, Creaform, Artec 3D, 3D Systems, Hexagon, Shining 3D, and Trimble, among others.

What are the key growth drivers?

-> Key growth drivers include digital transformation across industries, demand for high-precision scanning, and adoption in healthcare diagnostics.

Which region dominates the market?

-> North America currently leads in market share, while Asia-Pacific shows the highest growth potential.

What are the emerging trends?

-> Emerging trends include AI-powered scanning automation, portable handheld scanners, and integration with 3D printing technologies.

Digital Scanner Market, Trends, Business Strategies 2025-2032

Get Sample Report PDF for Exclusive Insights

Report Sample Includes

  • Table of Contents
  • List of Tables & Figures
  • Charts, Research Methodology, and more...
PDF Icon Download Sample Report PDF
SKU: c460e20ebe55
Category:

Download Sample Report

Table of Content

1 Introduction to Research & Analysis Reports
1.1 Digital Scanner Market Definition
1.2 Market Segments
1.2.1 Segment by Type
1.2.2 Segment by Application
1.3 Global Digital Scanner Market Overview
1.4 Features & Benefits of This Report
1.5 Methodology & Sources of Information
1.5.1 Research Methodology
1.5.2 Research Process
1.5.3 Base Year
1.5.4 Report Assumptions & Caveats
2 Global Digital Scanner Overall Market Size
2.1 Global Digital Scanner Market Size: 2024 VS 2032
2.2 Global Digital Scanner Market Size, Prospects & Forecasts: 2020-2032
2.3 Global Digital Scanner Sales: 2020-2032
3 Company Landscape
3.1 Top Digital Scanner Players in Global Market
3.2 Top Global Digital Scanner Companies Ranked by Revenue
3.3 Global Digital Scanner Revenue by Companies
3.4 Global Digital Scanner Sales by Companies
3.5 Global Digital Scanner Price by Manufacturer (2020-2025)
3.6 Top 3 and Top 5 Digital Scanner Companies in Global Market, by Revenue in 2024
3.7 Global Manufacturers Digital Scanner Product Type
3.8 Tier 1, Tier 2, and Tier 3 Digital Scanner Players in Global Market
3.8.1 List of Global Tier 1 Digital Scanner Companies
3.8.2 List of Global Tier 2 and Tier 3 Digital Scanner Companies
4 Sights by Product
4.1 Overview
4.1.1 Segment by Type – Global Digital Scanner Market Size Markets, 2024 & 2032
4.1.2 High Speed
4.1.3 Handheld
4.1.4 Other
4.2 Segment by Type – Global Digital Scanner Revenue & Forecasts
4.2.1 Segment by Type – Global Digital Scanner Revenue, 2020-2025
4.2.2 Segment by Type – Global Digital Scanner Revenue, 2026-2032
4.2.3 Segment by Type – Global Digital Scanner Revenue Market Share, 2020-2032
4.3 Segment by Type – Global Digital Scanner Sales & Forecasts
4.3.1 Segment by Type – Global Digital Scanner Sales, 2020-2025
4.3.2 Segment by Type – Global Digital Scanner Sales, 2026-2032
4.3.3 Segment by Type – Global Digital Scanner Sales Market Share, 2020-2032
4.4 Segment by Type – Global Digital Scanner Price (Manufacturers Selling Prices), 2020-2032
5 Sights by Application
5.1 Overview
5.1.1 Segment by Application – Global Digital Scanner Market Size, 2024 & 2032
5.1.2 Manufacturing and Engineering Design
5.1.3 Cultural Heritage and Museums
5.1.4 Medicine and Healthcare
5.1.5 Other
5.2 Segment by Application – Global Digital Scanner Revenue & Forecasts
5.2.1 Segment by Application – Global Digital Scanner Revenue, 2020-2025
5.2.2 Segment by Application – Global Digital Scanner Revenue, 2026-2032
5.2.3 Segment by Application – Global Digital Scanner Revenue Market Share, 2020-2032
5.3 Segment by Application – Global Digital Scanner Sales & Forecasts
5.3.1 Segment by Application – Global Digital Scanner Sales, 2020-2025
5.3.2 Segment by Application – Global Digital Scanner Sales, 2026-2032
5.3.3 Segment by Application – Global Digital Scanner Sales Market Share, 2020-2032
5.4 Segment by Application – Global Digital Scanner Price (Manufacturers Selling Prices), 2020-2032
6 Sights by Region
6.1 By Region – Global Digital Scanner Market Size, 2024 & 2032
6.2 By Region – Global Digital Scanner Revenue & Forecasts
6.2.1 By Region – Global Digital Scanner Revenue, 2020-2025
6.2.2 By Region – Global Digital Scanner Revenue, 2026-2032
6.2.3 By Region – Global Digital Scanner Revenue Market Share, 2020-2032
6.3 By Region – Global Digital Scanner Sales & Forecasts
6.3.1 By Region – Global Digital Scanner Sales, 2020-2025
6.3.2 By Region – Global Digital Scanner Sales, 2026-2032
6.3.3 By Region – Global Digital Scanner Sales Market Share, 2020-2032
6.4 North America
6.4.1 By Country – North America Digital Scanner Revenue, 2020-2032
6.4.2 By Country – North America Digital Scanner Sales, 2020-2032
6.4.3 United States Digital Scanner Market Size, 2020-2032
6.4.4 Canada Digital Scanner Market Size, 2020-2032
6.4.5 Mexico Digital Scanner Market Size, 2020-2032
6.5 Europe
6.5.1 By Country – Europe Digital Scanner Revenue, 2020-2032
6.5.2 By Country – Europe Digital Scanner Sales, 2020-2032
6.5.3 Germany Digital Scanner Market Size, 2020-2032
6.5.4 France Digital Scanner Market Size, 2020-2032
6.5.5 U.K. Digital Scanner Market Size, 2020-2032
6.5.6 Italy Digital Scanner Market Size, 2020-2032
6.5.7 Russia Digital Scanner Market Size, 2020-2032
6.5.8 Nordic Countries Digital Scanner Market Size, 2020-2032
6.5.9 Benelux Digital Scanner Market Size, 2020-2032
6.6 Asia
6.6.1 By Region – Asia Digital Scanner Revenue, 2020-2032
6.6.2 By Region – Asia Digital Scanner Sales, 2020-2032
6.6.3 China Digital Scanner Market Size, 2020-2032
6.6.4 Japan Digital Scanner Market Size, 2020-2032
6.6.5 South Korea Digital Scanner Market Size, 2020-2032
6.6.6 Southeast Asia Digital Scanner Market Size, 2020-2032
6.6.7 India Digital Scanner Market Size, 2020-2032
6.7 South America
6.7.1 By Country – South America Digital Scanner Revenue, 2020-2032
6.7.2 By Country – South America Digital Scanner Sales, 2020-2032
6.7.3 Brazil Digital Scanner Market Size, 2020-2032
6.7.4 Argentina Digital Scanner Market Size, 2020-2032
6.8 Middle East & Africa
6.8.1 By Country – Middle East & Africa Digital Scanner Revenue, 2020-2032
6.8.2 By Country – Middle East & Africa Digital Scanner Sales, 2020-2032
6.8.3 Turkey Digital Scanner Market Size, 2020-2032
6.8.4 Israel Digital Scanner Market Size, 2020-2032
6.8.5 Saudi Arabia Digital Scanner Market Size, 2020-2032
6.8.6 UAE Digital Scanner Market Size, 2020-2032
7 Manufacturers & Brands Profiles
7.1 FARO Technologies
7.1.1 FARO Technologies Company Summary
7.1.2 FARO Technologies Business Overview
7.1.3 FARO Technologies Digital Scanner Major Product Offerings
7.1.4 FARO Technologies Digital Scanner Sales and Revenue in Global (2020-2025)
7.1.5 FARO Technologies Key News & Latest Developments
7.2 Creaform
7.2.1 Creaform Company Summary
7.2.2 Creaform Business Overview
7.2.3 Creaform Digital Scanner Major Product Offerings
7.2.4 Creaform Digital Scanner Sales and Revenue in Global (2020-2025)
7.2.5 Creaform Key News & Latest Developments
7.3 Artec 3D
7.3.1 Artec 3D Company Summary
7.3.2 Artec 3D Business Overview
7.3.3 Artec 3D Digital Scanner Major Product Offerings
7.3.4 Artec 3D Digital Scanner Sales and Revenue in Global (2020-2025)
7.3.5 Artec 3D Key News & Latest Developments
7.4 3D Systems
7.4.1 3D Systems Company Summary
7.4.2 3D Systems Business Overview
7.4.3 3D Systems Digital Scanner Major Product Offerings
7.4.4 3D Systems Digital Scanner Sales and Revenue in Global (2020-2025)
7.4.5 3D Systems Key News & Latest Developments
7.5 Hexagon
7.5.1 Hexagon Company Summary
7.5.2 Hexagon Business Overview
7.5.3 Hexagon Digital Scanner Major Product Offerings
7.5.4 Hexagon Digital Scanner Sales and Revenue in Global (2020-2025)
7.5.5 Hexagon Key News & Latest Developments
7.6 Shining 3D
7.6.1 Shining 3D Company Summary
7.6.2 Shining 3D Business Overview
7.6.3 Shining 3D Digital Scanner Major Product Offerings
7.6.4 Shining 3D Digital Scanner Sales and Revenue in Global (2020-2025)
7.6.5 Shining 3D Key News & Latest Developments
7.7 Trimble
7.7.1 Trimble Company Summary
7.7.2 Trimble Business Overview
7.7.3 Trimble Digital Scanner Major Product Offerings
7.7.4 Trimble Digital Scanner Sales and Revenue in Global (2020-2025)
7.7.5 Trimble Key News & Latest Developments
7.8 Nikon Metrology
7.8.1 Nikon Metrology Company Summary
7.8.2 Nikon Metrology Business Overview
7.8.3 Nikon Metrology Digital Scanner Major Product Offerings
7.8.4 Nikon Metrology Digital Scanner Sales and Revenue in Global (2020-2025)
7.8.5 Nikon Metrology Key News & Latest Developments
7.9 ZEISS
7.9.1 ZEISS Company Summary
7.9.2 ZEISS Business Overview
7.9.3 ZEISS Digital Scanner Major Product Offerings
7.9.4 ZEISS Digital Scanner Sales and Revenue in Global (2020-2025)
7.9.5 ZEISS Key News & Latest Developments
7.10 Hewlett-Packard
7.10.1 Hewlett-Packard Company Summary
7.10.2 Hewlett-Packard Business Overview
7.10.3 Hewlett-Packard Digital Scanner Major Product Offerings
7.10.4 Hewlett-Packard Digital Scanner Sales and Revenue in Global (2020-2025)
7.10.5 Hewlett-Packard Key News & Latest Developments
7.11 Epson
7.11.1 Epson Company Summary
7.11.2 Epson Business Overview
7.11.3 Epson Digital Scanner Major Product Offerings
7.11.4 Epson Digital Scanner Sales and Revenue in Global (2020-2025)
7.11.5 Epson Key News & Latest Developments
7.12 NextEngine
7.12.1 NextEngine Company Summary
7.12.2 NextEngine Business Overview
7.12.3 NextEngine Digital Scanner Major Product Offerings
7.12.4 NextEngine Digital Scanner Sales and Revenue in Global (2020-2025)
7.12.5 NextEngine Key News & Latest Developments
7.13 Leica Geosystems
7.13.1 Leica Geosystems Company Summary
7.13.2 Leica Geosystems Business Overview
7.13.3 Leica Geosystems Digital Scanner Major Product Offerings
7.13.4 Leica Geosystems Digital Scanner Sales and Revenue in Global (2020-2025)
7.13.5 Leica Geosystems Key News & Latest Developments
7.14 Zebra Technologies
7.14.1 Zebra Technologies Company Summary
7.14.2 Zebra Technologies Business Overview
7.14.3 Zebra Technologies Digital Scanner Major Product Offerings
7.14.4 Zebra Technologies Digital Scanner Sales and Revenue in Global (2020-2025)
7.14.5 Zebra Technologies Key News & Latest Developments
7.15 Zeiss Optoelectronics Technology
7.15.1 Zeiss Optoelectronics Technology Company Summary
7.15.2 Zeiss Optoelectronics Technology Business Overview
7.15.3 Zeiss Optoelectronics Technology Digital Scanner Major Product Offerings
7.15.4 Zeiss Optoelectronics Technology Digital Scanner Sales and Revenue in Global (2020-2025)
7.15.5 Zeiss Optoelectronics Technology Key News & Latest Developments
7.16 Shining 3D Technology
7.16.1 Shining 3D Technology Company Summary
7.16.2 Shining 3D Technology Business Overview
7.16.3 Shining 3D Technology Digital Scanner Major Product Offerings
7.16.4 Shining 3D Technology Digital Scanner Sales and Revenue in Global (2020-2025)
7.16.5 Shining 3D Technology Key News & Latest Developments
7.17 Scan Technology (Hangzhou)
7.17.1 Scan Technology (Hangzhou) Company Summary
7.17.2 Scan Technology (Hangzhou) Business Overview
7.17.3 Scan Technology (Hangzhou) Digital Scanner Major Product Offerings
7.17.4 Scan Technology (Hangzhou) Digital Scanner Sales and Revenue in Global (2020-2025)
7.17.5 Scan Technology (Hangzhou) Key News & Latest Developments
8 Global Digital Scanner Production Capacity, Analysis
8.1 Global Digital Scanner Production Capacity, 2020-2032
8.2 Digital Scanner Production Capacity of Key Manufacturers in Global Market
8.3 Global Digital Scanner Production by Region
9 Key Market Trends, Opportunity, Drivers and Restraints
9.1 Market Opportunities & Trends
9.2 Market Drivers
9.3 Market Restraints
10 Digital Scanner Supply Chain Analysis
10.1 Digital Scanner Industry Value Chain
10.2 Digital Scanner Upstream Market
10.3 Digital Scanner Downstream and Clients
10.4 Marketing Channels Analysis
10.4.1 Marketing Channels
10.4.2 Digital Scanner Distributors and Sales Agents in Global
11 Conclusion
12 Appendix
12.1 Note
12.2 Examples of Clients
12.3 DisclaimerList of Tables
Table 1. Key Players of Digital Scanner in Global Market
Table 2. Top Digital Scanner Players in Global Market, Ranking by Revenue (2024)
Table 3. Global Digital Scanner Revenue by Companies, (US$, Mn), 2020-2025
Table 4. Global Digital Scanner Revenue Share by Companies, 2020-2025
Table 5. Global Digital Scanner Sales by Companies, (Units), 2020-2025
Table 6. Global Digital Scanner Sales Share by Companies, 2020-2025
Table 7. Key Manufacturers Digital Scanner Price (2020-2025) & (K US$/Unit)
Table 8. Global Manufacturers Digital Scanner Product Type
Table 9. List of Global Tier 1 Digital Scanner Companies, Revenue (US$, Mn) in 2024 and Market Share
Table 10. List of Global Tier 2 and Tier 3 Digital Scanner Companies, Revenue (US$, Mn) in 2024 and Market Share
Table 11. Segment by Type – Global Digital Scanner Revenue, (US$, Mn), 2024 & 2032
Table 12. Segment by Type – Global Digital Scanner Revenue (US$, Mn), 2020-2025
Table 13. Segment by Type – Global Digital Scanner Revenue (US$, Mn), 2026-2032
Table 14. Segment by Type – Global Digital Scanner Sales (Units), 2020-2025
Table 15. Segment by Type – Global Digital Scanner Sales (Units), 2026-2032
Table 16. Segment by Application – Global Digital Scanner Revenue, (US$, Mn), 2024 & 2032
Table 17. Segment by Application – Global Digital Scanner Revenue, (US$, Mn), 2020-2025
Table 18. Segment by Application – Global Digital Scanner Revenue, (US$, Mn), 2026-2032
Table 19. Segment by Application – Global Digital Scanner Sales, (Units), 2020-2025
Table 20. Segment by Application – Global Digital Scanner Sales, (Units), 2026-2032
Table 21. By Region – Global Digital Scanner Revenue, (US$, Mn), 2025-2032
Table 22. By Region – Global Digital Scanner Revenue, (US$, Mn), 2020-2025
Table 23. By Region – Global Digital Scanner Revenue, (US$, Mn), 2026-2032
Table 24. By Region – Global Digital Scanner Sales, (Units), 2020-2025
Table 25. By Region – Global Digital Scanner Sales, (Units), 2026-2032
Table 26. By Country – North America Digital Scanner Revenue, (US$, Mn), 2020-2025
Table 27. By Country – North America Digital Scanner Revenue, (US$, Mn), 2026-2032
Table 28. By Country – North America Digital Scanner Sales, (Units), 2020-2025
Table 29. By Country – North America Digital Scanner Sales, (Units), 2026-2032
Table 30. By Country – Europe Digital Scanner Revenue, (US$, Mn), 2020-2025
Table 31. By Country – Europe Digital Scanner Revenue, (US$, Mn), 2026-2032
Table 32. By Country – Europe Digital Scanner Sales, (Units), 2020-2025
Table 33. By Country – Europe Digital Scanner Sales, (Units), 2026-2032
Table 34. By Region – Asia Digital Scanner Revenue, (US$, Mn), 2020-2025
Table 35. By Region – Asia Digital Scanner Revenue, (US$, Mn), 2026-2032
Table 36. By Region – Asia Digital Scanner Sales, (Units), 2020-2025
Table 37. By Region – Asia Digital Scanner Sales, (Units), 2026-2032
Table 38. By Country – South America Digital Scanner Revenue, (US$, Mn), 2020-2025
Table 39. By Country – South America Digital Scanner Revenue, (US$, Mn), 2026-2032
Table 40. By Country – South America Digital Scanner Sales, (Units), 2020-2025
Table 41. By Country – South America Digital Scanner Sales, (Units), 2026-2032
Table 42. By Country – Middle East & Africa Digital Scanner Revenue, (US$, Mn), 2020-2025
Table 43. By Country – Middle East & Africa Digital Scanner Revenue, (US$, Mn), 2026-2032
Table 44. By Country – Middle East & Africa Digital Scanner Sales, (Units), 2020-2025
Table 45. By Country – Middle East & Africa Digital Scanner Sales, (Units), 2026-2032
Table 46. FARO Technologies Company Summary
Table 47. FARO Technologies Digital Scanner Product Offerings
Table 48. FARO Technologies Digital Scanner Sales (Units), Revenue (US$, Mn) and Average Price (K US$/Unit) & (2020-2025)
Table 49. FARO Technologies Key News & Latest Developments
Table 50. Creaform Company Summary
Table 51. Creaform Digital Scanner Product Offerings
Table 52. Creaform Digital Scanner Sales (Units), Revenue (US$, Mn) and Average Price (K US$/Unit) & (2020-2025)
Table 53. Creaform Key News & Latest Developments
Table 54. Artec 3D Company Summary
Table 55. Artec 3D Digital Scanner Product Offerings
Table 56. Artec 3D Digital Scanner Sales (Units), Revenue (US$, Mn) and Average Price (K US$/Unit) & (2020-2025)
Table 57. Artec 3D Key News & Latest Developments
Table 58. 3D Systems Company Summary
Table 59. 3D Systems Digital Scanner Product Offerings
Table 60. 3D Systems Digital Scanner Sales (Units), Revenue (US$, Mn) and Average Price (K US$/Unit) & (2020-2025)
Table 61. 3D Systems Key News & Latest Developments
Table 62. Hexagon Company Summary
Table 63. Hexagon Digital Scanner Product Offerings
Table 64. Hexagon Digital Scanner Sales (Units), Revenue (US$, Mn) and Average Price (K US$/Unit) & (2020-2025)
Table 65. Hexagon Key News & Latest Developments
Table 66. Shining 3D Company Summary
Table 67. Shining 3D Digital Scanner Product Offerings
Table 68. Shining 3D Digital Scanner Sales (Units), Revenue (US$, Mn) and Average Price (K US$/Unit) & (2020-2025)
Table 69. Shining 3D Key News & Latest Developments
Table 70. Trimble Company Summary
Table 71. Trimble Digital Scanner Product Offerings
Table 72. Trimble Digital Scanner Sales (Units), Revenue (US$, Mn) and Average Price (K US$/Unit) & (2020-2025)
Table 73. Trimble Key News & Latest Developments
Table 74. Nikon Metrology Company Summary
Table 75. Nikon Metrology Digital Scanner Product Offerings
Table 76. Nikon Metrology Digital Scanner Sales (Units), Revenue (US$, Mn) and Average Price (K US$/Unit) & (2020-2025)
Table 77. Nikon Metrology Key News & Latest Developments
Table 78. ZEISS Company Summary
Table 79. ZEISS Digital Scanner Product Offerings
Table 80. ZEISS Digital Scanner Sales (Units), Revenue (US$, Mn) and Average Price (K US$/Unit) & (2020-2025)
Table 81. ZEISS Key News & Latest Developments
Table 82. Hewlett-Packard Company Summary
Table 83. Hewlett-Packard Digital Scanner Product Offerings
Table 84. Hewlett-Packard Digital Scanner Sales (Units), Revenue (US$, Mn) and Average Price (K US$/Unit) & (2020-2025)
Table 85. Hewlett-Packard Key News & Latest Developments
Table 86. Epson Company Summary
Table 87. Epson Digital Scanner Product Offerings
Table 88. Epson Digital Scanner Sales (Units), Revenue (US$, Mn) and Average Price (K US$/Unit) & (2020-2025)
Table 89. Epson Key News & Latest Developments
Table 90. NextEngine Company Summary
Table 91. NextEngine Digital Scanner Product Offerings
Table 92. NextEngine Digital Scanner Sales (Units), Revenue (US$, Mn) and Average Price (K US$/Unit) & (2020-2025)
Table 93. NextEngine Key News & Latest Developments
Table 94. Leica Geosystems Company Summary
Table 95. Leica Geosystems Digital Scanner Product Offerings
Table 96. Leica Geosystems Digital Scanner Sales (Units), Revenue (US$, Mn) and Average Price (K US$/Unit) & (2020-2025)
Table 97. Leica Geosystems Key News & Latest Developments
Table 98. Zebra Technologies Company Summary
Table 99. Zebra Technologies Digital Scanner Product Offerings
Table 100. Zebra Technologies Digital Scanner Sales (Units), Revenue (US$, Mn) and Average Price (K US$/Unit) & (2020-2025)
Table 101. Zebra Technologies Key News & Latest Developments
Table 102. Zeiss Optoelectronics Technology Company Summary
Table 103. Zeiss Optoelectronics Technology Digital Scanner Product Offerings
Table 104. Zeiss Optoelectronics Technology Digital Scanner Sales (Units), Revenue (US$, Mn) and Average Price (K US$/Unit) & (2020-2025)
Table 105. Zeiss Optoelectronics Technology Key News & Latest Developments
Table 106. Shining 3D Technology Company Summary
Table 107. Shining 3D Technology Digital Scanner Product Offerings
Table 108. Shining 3D Technology Digital Scanner Sales (Units), Revenue (US$, Mn) and Average Price (K US$/Unit) & (2020-2025)
Table 109. Shining 3D Technology Key News & Latest Developments
Table 110. Scan Technology (Hangzhou) Company Summary
Table 111. Scan Technology (Hangzhou) Digital Scanner Product Offerings
Table 112. Scan Technology (Hangzhou) Digital Scanner Sales (Units), Revenue (US$, Mn) and Average Price (K US$/Unit) & (2020-2025)
Table 113. Scan Technology (Hangzhou) Key News & Latest Developments
Table 114. Digital Scanner Capacity of Key Manufacturers in Global Market, 2023-2025 (Units)
Table 115. Global Digital Scanner Capacity Market Share of Key Manufacturers, 2023-2025
Table 116. Global Digital Scanner Production by Region, 2020-2025 (Units)
Table 117. Global Digital Scanner Production by Region, 2026-2032 (Units)
Table 118. Digital Scanner Market Opportunities & Trends in Global Market
Table 119. Digital Scanner Market Drivers in Global Market
Table 120. Digital Scanner Market Restraints in Global Market
Table 121. Digital Scanner Raw Materials
Table 122. Digital Scanner Raw Materials Suppliers in Global Market
Table 123. Typical Digital Scanner Downstream
Table 124. Digital Scanner Downstream Clients in Global Market
Table 125. Digital Scanner Distributors and Sales Agents in Global Market

List of Figures
Figure 1. Digital Scanner Product Picture
Figure 2. Digital Scanner Segment by Type in 2024
Figure 3. Digital Scanner Segment by Application in 2024
Figure 4. Global Digital Scanner Market Overview: 2024
Figure 5. Key Caveats
Figure 6. Global Digital Scanner Market Size: 2024 VS 2032 (US$, Mn)
Figure 7. Global Digital Scanner Revenue: 2020-2032 (US$, Mn)
Figure 8. Digital Scanner Sales in Global Market: 2020-2032 (Units)
Figure 9. The Top 3 and 5 Players Market Share by Digital Scanner Revenue in 2024
Figure 10. Segment by Type – Global Digital Scanner Revenue, (US$, Mn), 2024 & 2032
Figure 11. Segment by Type – Global Digital Scanner Revenue Market Share, 2020-2032
Figure 12. Segment by Type – Global Digital Scanner Sales Market Share, 2020-2032
Figure 13. Segment by Type – Global Digital Scanner Price (K US$/Unit), 2020-2032
Figure 14. Segment by Application – Global Digital Scanner Revenue, (US$, Mn), 2024 & 2032
Figure 15. Segment by Application – Global Digital Scanner Revenue Market Share, 2020-2032
Figure 16. Segment by Application – Global Digital Scanner Sales Market Share, 2020-2032
Figure 17. Segment by Application -Global Digital Scanner Price (K US$/Unit), 2020-2032
Figure 18. By Region – Global Digital Scanner Revenue, (US$, Mn), 2025 & 2032
Figure 19. By Region – Global Digital Scanner Revenue Market Share, 2020 VS 2024 VS 2032
Figure 20. By Region – Global Digital Scanner Revenue Market Share, 2020-2032
Figure 21. By Region – Global Digital Scanner Sales Market Share, 2020-2032
Figure 22. By Country – North America Digital Scanner Revenue Market Share, 2020-2032
Figure 23. By Country – North America Digital Scanner Sales Market Share, 2020-2032
Figure 24. United States Digital Scanner Revenue, (US$, Mn), 2020-2032
Figure 25. Canada Digital Scanner Revenue, (US$, Mn), 2020-2032
Figure 26. Mexico Digital Scanner Revenue, (US$, Mn), 2020-2032
Figure 27. By Country – Europe Digital Scanner Revenue Market Share, 2020-2032
Figure 28. By Country – Europe Digital Scanner Sales Market Share, 2020-2032
Figure 29. Germany Digital Scanner Revenue, (US$, Mn), 2020-2032
Figure 30. France Digital Scanner Revenue, (US$, Mn), 2020-2032
Figure 31. U.K. Digital Scanner Revenue, (US$, Mn), 2020-2032
Figure 32. Italy Digital Scanner Revenue, (US$, Mn), 2020-2032
Figure 33. Russia Digital Scanner Revenue, (US$, Mn), 2020-2032
Figure 34. Nordic Countries Digital Scanner Revenue, (US$, Mn), 2020-2032
Figure 35. Benelux Digital Scanner Revenue, (US$, Mn), 2020-2032
Figure 36. By Region – Asia Digital Scanner Revenue Market Share, 2020-2032
Figure 37. By Region – Asia Digital Scanner Sales Market Share, 2020-2032
Figure 38. China Digital Scanner Revenue, (US$, Mn), 2020-2032
Figure 39. Japan Digital Scanner Revenue, (US$, Mn), 2020-2032
Figure 40. South Korea Digital Scanner Revenue, (US$, Mn), 2020-2032
Figure 41. Southeast Asia Digital Scanner Revenue, (US$, Mn), 2020-2032
Figure 42. India Digital Scanner Revenue, (US$, Mn), 2020-2032
Figure 43. By Country – South America Digital Scanner Revenue Market Share, 2020-2032
Figure 44. By Country – South America Digital Scanner Sales, Market Share, 2020-2032
Figure 45. Brazil Digital Scanner Revenue, (US$, Mn), 2020-2032
Figure 46. Argentina Digital Scanner Revenue, (US$, Mn), 2020-2032
Figure 47. By Country – Middle East & Africa Digital Scanner Revenue, Market Share, 2020-2032
Figure 48. By Country – Middle East & Africa Digital Scanner Sales, Market Share, 2020-2032
Figure 49. Turkey Digital Scanner Revenue, (US$, Mn), 2020-2032
Figure 50. Israel Digital Scanner Revenue, (US$, Mn), 2020-2032
Figure 51. Saudi Arabia Digital Scanner Revenue, (US$, Mn), 2020-2032
Figure 52. UAE Digital Scanner Revenue, (US$, Mn), 2020-2032
Figure 53. Global Digital Scanner Production Capacity (Units), 2020-2032
Figure 54. The Percentage of Production Digital Scanner by Region, 2024 VS 2032
Figure 55. Digital Scanner Industry Value Chain
Figure 56. Marketing Channels