Digital Photo Frame Market, Global Business Strategies 2026-2033

Digital Photo Frame Market was valued at USD 10.5 million in 2025 and is projected to decline to USD 2 million by 2033, exhibiting a negative CAGR of -21.9% during the forecast period.

PDF Icon Download Sample Report PDF
  • Quick Dispatch

    All Orders

  • Secure Payment

    100% Secure Payment

Price range: $1,500.00 through $4,250.00

Clear

Market Insights

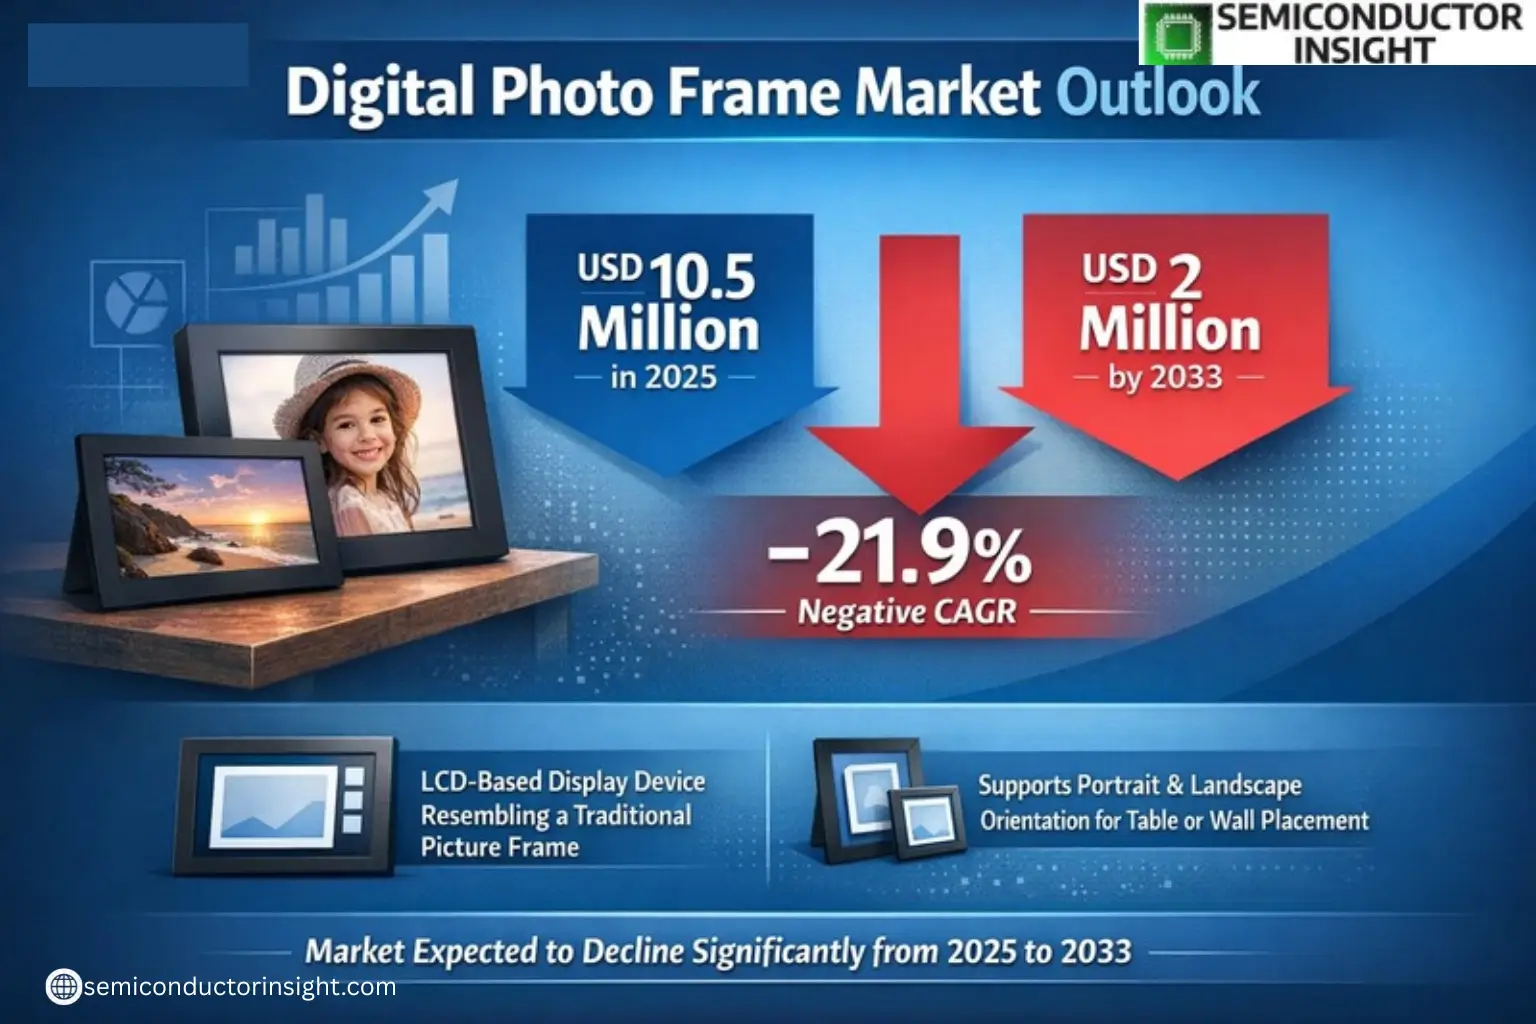
Global Digital Photo Frame Market was valued at USD 10.5 million in 2025 and is projected to decline to USD 2 million by 2033, exhibiting a negative CAGR of -21.9% during the forecast period.

Digital Photo Frame is an LCD-based display device designed to resemble a traditional picture frame. These frames support both portrait and landscape orientations, allowing placement on tables or walls. Equipped with built-in memory or expandable storage via memory cards, they cycle through stored images in a slideshow format.

The market contraction reflects shifting consumer preferences toward smartphones and cloud-based photo sharing platforms. However, premium segments featuring high-resolution displays (such as 4K models) and smart connectivity options continue finding niche demand among specific demographics. Key manufacturers including GiiNii, NIX, Aluratek, and Philips dominate the competitive landscape, collectively holding over 65% market share.

Xyz market size & forecast

MARKET DRIVERS

Growing Adoption of Smart Displays

Digital Photo Frame Market is witnessing significant growth due to the rising adoption of smart displays for personal and decorative purposes. Consumers increasingly prefer digital photo frames that offer Wi-Fi connectivity, cloud storage integration, and touch-screen functionality. The ability to showcase photos dynamically makes these devices popular for home and office use.

Rising Demand for Personalized Gifting

Digital photo frames have become a preferred gifting option for special occasions, driven by their ability to store and display multiple images. The market is benefiting from the growing trend of personalization, with customizable frames that allow users to upload photos remotely via apps or social media.

Technological advancements, such as 4K resolution and AI-driven photo categorization, are further fueling consumer interest in premium digital photo frames.

MARKET CHALLENGES

Competition from Smartphones and Tablets

Digital Photo Frame Market faces challenges from smartphones and tablets, which offer similar photo-displaying capabilities. Many consumers opt to use existing devices rather than purchasing dedicated frames, affecting market growth.

Other Challenges

High Cost of Advanced Models
Premium digital photo frames with smart features often come at a higher price point, limiting adoption among budget-conscious consumers.

Privacy and Security Concerns
Cloud-connected digital photo frames raise data security concerns, as unauthorized access to personal photos can deter potential buyers.

MARKET RESTRAINTS

Limited Market Awareness in Emerging Regions

Despite growth in developed markets, digital photo frames have relatively low penetration in emerging economies due to limited awareness and affordability concerns. The lack of strong distribution networks further restricts market expansion in these regions.

MARKET OPPORTUNITIES

Integration with Smart Home Ecosystems

Digital Photo Frame Market has significant growth potential through integration with smart home systems. Frames that connect with voice assistants and home automation platforms can enhance user convenience and drive adoption.

Expansion in Commercial Applications

Businesses are increasingly adopting digital photo frames for advertising, event displays, and corporate gifting. This presents a lucrative opportunity for manufacturers to develop B2B-focused models with enhanced durability and remote content management.
Digital Photo Frame Market Trends

Declining Market Value Amid Shifting Consumer Preferences

Global Digital Photo Frame Market faces a steady decline, with projected revenues dropping from USD 10.5 million in 2025 to USD 2 million by 2033. This negative 21.9% CAGR reflects reduced demand as consumers transition to smartphones and cloud-based photo sharing solutions. Manufacturers are responding with enhanced connectivity features and smarter display technologies to revive interest in the Digital Photo Frame Market.

Other Trends

Dominance of Multimedia-Enabled Frames

Improved multimedia digital photo frames capture 45% market share, offering video playback, music support, and Wi-Fi connectivity. This product segment outperforms basic photo display units as consumers seek multifunctional devices in the Digital Photo Frame Market.

Regional Market Concentration

North America leads with over 50% market share in the Digital Photo Frame Market, followed by Europe and Asia-Pacific combined at 40%. The household sector remains the primary application area (75% share), though commercial adoption grows in retail and hospitality through digital signage applications.

Other Trends

Consolidated Competitive Landscape

Five manufacturers control 65% of the Digital Photo Frame Market, with GiiNii, NIX, and Aluratek leading product innovation. Industry players increasingly focus on energy-efficient displays and AI-powered image curation features to differentiate offerings in this contracting market.

Technological Integration Trends

New Digital Photo Frame Market entrants incorporate mobile app synchronization, social media integration, and cloud storage compatibility. These features aim to address consumer demand for seamless photo management while competing with smartphone-based alternatives.

COMPETITIVE LANDSCAPE

Key Industry Players

Digital Photo Frame Market Dominance Shifting Towards Enhanced Multimedia Models

Digital Photo Frame Market is consolidated with GiiNii, NIX, Aluratek, Micca, and Sungale collectively holding over 65% market share. These established players dominate through advanced product portfolios featuring cloud connectivity, HD displays, and smart compatibility. GiiNii leads with its innovative touchscreen frames integrating social media feeds, while NIX specializes in commercial-grade digital signage solutions for retail environments. The North American market (50% share) shows strong preference for premium multimedia frames averaging above USD 100 price points.

Emerging competitors like Pix-Star and TENKER are disrupting the market with AI-powered facial recognition and 4K resolution models. Asian manufacturers are gaining traction through competitively priced sub-USD 50 frames with basic functions. The commercial segment (30% market share) favors durable, large-format displays from ViewSonic and Philips, while household consumers increasingly opt for Wi-Fi enabled frames from Aluratek and Sylvania. Recent industry shifts show declining demand for basic frames (-15% YoY) against 12% growth in smart multimedia variants.

List of Key Digital Photo Frame Companies Profiled

Segment Analysis:

Segment Category Sub-Segments Key Insights
By Type
  • Simple Function Digital Photo Frames
  • Simple “Multimedia” Digital Photo Frames
  • Improved “Multimedia” Digital Photo Frames
Improved “Multimedia” Digital Photo Frames

  • Dominates product preferences with advanced display technologies and multiple connectivity options
  • Increasing demand for high-resolution displays and cloud connectivity features
  • Premium offerings include Wi-Fi/Bluetooth capabilities and mobile app integration
By Application
  • Household
  • Commercial
Household Applications

  • Primary market driven by personal memory display and digital home decor trends
  • Growing popularity as gifts and family-oriented connected devices
  • Premium home decor applications favor larger screen sizes and artistic frame designs
By End User
  • Individual Consumers
  • Corporate Gifting
  • Hospitality Sector
Individual Consumers

  • Significant portion of purchases driven by personal use and family gifting occasions
  • Tech-savvy consumers favor models with smart features and remote content updates
  • Increasing adoption among older demographics for easy photo sharing with family
By Display Technology
  • LCD
  • OLED
  • E-Ink
LCD Display

  • Remains the dominant technology due to cost-effectiveness and vibrant color reproduction
  • Ongoing improvements in brightness and energy efficiency extending market leadership
  • Large format LCD frames preferred for commercial applications
By Connectivity
  • Wi-Fi Enabled
  • Bluetooth Enabled
  • Standalone (Memory Card Only)
Wi-Fi Enabled Frames

  • Fastest growing segment due to consumer demand for cloud connectivity
  • Enables real-time photo updates and social media integration features
  • Preferred choice for families spread across multiple locations

Regional Analysis: Global Digital Photo Frame Market

North America

North America dominates the digital photo frame market with widespread adoption driven by high disposable incomes and tech-savvy consumers. The region benefits from strong retail distribution channels and premium product preferences. U.S. consumers increasingly favor connected frames with cloud synchronization and smart home integration capabilities. Market leaders are differentiating through enhanced display technologies and interoperability with social media platforms. The presence of major tech companies and early adoption of smart home ecosystems creates fertile ground for premium digital frame innovations. Canada shows growing demand for weather-resistant outdoor digital frames while Mexico’s market is developing through ecommerce expansion.

Premium Product Adoption
North American consumers show strong preference for high-resolution LCD/LED frames with 8-10 inch displays, willing to pay premium prices for superior color accuracy and touchscreen functionality in the digital photo frame market.
Smart Home Integration
The region leads in adoption of WiFi-enabled frames that sync with smart displays and voice assistants. Compatibility with Amazon Alexa and Google Home ecosystems is becoming a standard feature in premium digital photo frames.
Retail Landscape
Specialty electronics stores and major retail chains account for over 60% of digital photo frame sales. Best Buy, Walmart and Target maintain dedicated display sections, while Amazon dominates online sales channels.
Emerging Trends
Growing demand for digital frames serving dual purposes like calendar displays and photo-sharing platforms. Subscription-based models for cloud storage integration show promising growth potential in the North American market.

Europe
Europe represents the second-largest digital photo frame market with Germany, UK and France as key markets. The region shows preference for energy-efficient models with sustainable materials. EU regulations on energy consumption influence product designs significantly. Northern European countries demonstrate strong demand for minimalist designs while Southern Europe favors larger display sizes. Retail channels are diversifying with growing ecommerce penetration and specialty home decor stores adding digital frames to product portfolios.

Asia-Pacific
Asia-Pacific is the fastest growing region for digital photo frames, led by Japan, South Korea and China. Compact designs with advanced editing features gain popularity. Chinese manufacturers dominate production but face increasing competition from premium brands. The market benefits from expanding middle-class populations and gifting culture during festivals. India shows emerging potential with urban consumers adopting basic digital frames as smart home accessories.

Latin America
The Latin American digital photo frame market remains niche but shows steady growth in Brazil and Argentina. Price sensitivity drives demand for budget-friendly models under USD 50. Multi-functional frames combining clocks and calendars perform well. Retail distribution challenges persist outside major cities, making ecommerce crucial for market expansion in the region.

Middle East & Africa
The region presents untapped potential with UAE and South Africa as early adopters of premium digital photo frames. Luxury frame models with gold/wood finishes perform well in Gulf countries. Religious institutions increasingly use digital frames for displaying scriptures, creating a specialized market segment. Infrastructure limitations in Africa constrain market growth beyond urban centers.

Report Scope

This market research report provides a comprehensive analysis of the Digital Photo Frame Market , covering the forecast period 2025–2033. It offers detailed insights into market dynamics, technological advancements, competitive landscape, and key trends shaping the industry.

Key focus areas of the report include:

  • Market Overview: The report begins with an overview outlining its current market scenario, key growth indicators, and industry transformation drivers. It discusses macroeconomic factors, demand–supply balance, regulatory landscape, and the strategic role of digital displays in powering advancements across industries such as consumer electronics and home decor.
  • Market Size & Forecast: Historical data and future projections for revenue, unit shipments, and market value across major regions and segments.
  • Segmentation Analysis: Detailed breakdown by product type, technology, application, and end-user industry to identify high-growth segments and investment opportunities.
  • Regional Insights: Insights into market performance across North America, Europe, Asia-Pacific, Latin America, and the Middle East & Africa, including country-level analysis where relevant.
  • Competitive Landscape: Profiles of leading market participants, including their product offerings, R&D focus, manufacturing capacity, pricing strategies, and recent developments such as mergers, acquisitions, and partnerships.
  • Technology Trends & Innovation: Assessment of emerging technologies, integration of smart features, display technology trends, and evolving industry standards.
  • Market Drivers & Restraints: Evaluation of factors driving market growth along with challenges, supply chain constraints, regulatory issues, and market-entry barriers.
  • Stakeholder Insights: Insights for component suppliers, OEMs, system integrators, investors, and policymakers regarding the evolving ecosystem and strategic opportunities.

Primary and secondary research methods are employed, including interviews with industry experts, data from verified sources, and real-time market intelligence to ensure the accuracy and reliability of the insights presented.

FREQUENTLY ASKED QUESTIONS:

What is the current market size of Digital Photo Frame Market?

-> Digital Photo Frame Market was valued at USD 10.5 million in 2025 and is projected to decline to USD 2 million by 2033, exhibiting a negative CAGR of -21.9% during the forecast period.

What is the growth rate (CAGR) of Digital Photo Frame Market?

-> The market is expected to grow at a CAGR of -21.9% during 2025-2033.

Which key companies operate in Digital Photo Frame Market?

-> Key players include GiiNii, NIX, Aluratek, Micca, Sungale, Digital Foci, Philips, ViewSonic, Pix-Star, Sylvania, HP, and TENKER, among others. Global top five manufacturers hold a share over 65%.

Which region dominates the Digital Photo Frame Market?

-> North America is the largest market with a share over 50%, followed by Europe and Asia-Pacific with about 40% combined share.

What are the key product segments?

-> Improved “Multimedia” Digital Photo Frames dominate with 45% market share, followed by Simple “Multimedia” and Simple Function Digital Photo Frames.

What are the main applications?

-> The Household segment leads with the largest share, followed by Commercial applications.

Digital Photo Frame Market, Global Business Strategies 2026-2033

Get Sample Report PDF for Exclusive Insights

Report Sample Includes

  • Table of Contents
  • List of Tables & Figures
  • Charts, Research Methodology, and more...
PDF Icon Download Sample Report PDF

Download Sample Report

Table of Content

1 Introduction to Research & Analysis Reports
1.1 Digital Photo Frame Market Definition
1.2 Market Segments
1.2.1 Segment by Type
1.2.2 Segment by Application
1.3 Global Digital Photo Frame Market Overview
1.4 Features & Benefits of This Report
1.5 Methodology & Sources of Information
1.5.1 Research Methodology
1.5.2 Research Process
1.5.3 Base Year
1.5.4 Report Assumptions & Caveats
2 Global Digital Photo Frame Overall Market Size
2.1 Global Digital Photo Frame Market Size: 2024 VS 2032
2.2 Global Digital Photo Frame Market Size, Prospects & Forecasts: 2020-2032
2.3 Global Digital Photo Frame Sales: 2020-2032
3 Company Landscape
3.1 Top Digital Photo Frame Players in Global Market
3.2 Top Global Digital Photo Frame Companies Ranked by Revenue
3.3 Global Digital Photo Frame Revenue by Companies
3.4 Global Digital Photo Frame Sales by Companies
3.5 Global Digital Photo Frame Price by Manufacturer (2020-2025)
3.6 Top 3 and Top 5 Digital Photo Frame Companies in Global Market, by Revenue in 2024
3.7 Global Manufacturers Digital Photo Frame Product Type
3.8 Tier 1, Tier 2, and Tier 3 Digital Photo Frame Players in Global Market
3.8.1 List of Global Tier 1 Digital Photo Frame Companies
3.8.2 List of Global Tier 2 and Tier 3 Digital Photo Frame Companies
4 Sights by Product
4.1 Overview
4.1.1 Segment by Type – Global Digital Photo Frame Market Size Markets, 2024 & 2032
4.1.2 Simple Function Digital Photo Frames
4.1.3 Simple “Multimedia” Digital Photo Frames
4.1.4 Improved “Multimedia” Digital Photo Frames
4.2 Segment by Type – Global Digital Photo Frame Revenue & Forecasts
4.2.1 Segment by Type – Global Digital Photo Frame Revenue, 2020-2025
4.2.2 Segment by Type – Global Digital Photo Frame Revenue, 2026-2032
4.2.3 Segment by Type – Global Digital Photo Frame Revenue Market Share, 2020-2032
4.3 Segment by Type – Global Digital Photo Frame Sales & Forecasts
4.3.1 Segment by Type – Global Digital Photo Frame Sales, 2020-2025
4.3.2 Segment by Type – Global Digital Photo Frame Sales, 2026-2032
4.3.3 Segment by Type – Global Digital Photo Frame Sales Market Share, 2020-2032
4.4 Segment by Type – Global Digital Photo Frame Price (Manufacturers Selling Prices), 2020-2032
5 Sights by Application
5.1 Overview
5.1.1 Segment by Application – Global Digital Photo Frame Market Size, 2024 & 2032
5.1.2 Household
5.1.3 Commercial
5.2 Segment by Application – Global Digital Photo Frame Revenue & Forecasts
5.2.1 Segment by Application – Global Digital Photo Frame Revenue, 2020-2025
5.2.2 Segment by Application – Global Digital Photo Frame Revenue, 2026-2032
5.2.3 Segment by Application – Global Digital Photo Frame Revenue Market Share, 2020-2032
5.3 Segment by Application – Global Digital Photo Frame Sales & Forecasts
5.3.1 Segment by Application – Global Digital Photo Frame Sales, 2020-2025
5.3.2 Segment by Application – Global Digital Photo Frame Sales, 2026-2032
5.3.3 Segment by Application – Global Digital Photo Frame Sales Market Share, 2020-2032
5.4 Segment by Application – Global Digital Photo Frame Price (Manufacturers Selling Prices), 2020-2032
6 Sights by Region
6.1 By Region – Global Digital Photo Frame Market Size, 2024 & 2032
6.2 By Region – Global Digital Photo Frame Revenue & Forecasts
6.2.1 By Region – Global Digital Photo Frame Revenue, 2020-2025
6.2.2 By Region – Global Digital Photo Frame Revenue, 2026-2032
6.2.3 By Region – Global Digital Photo Frame Revenue Market Share, 2020-2032
6.3 By Region – Global Digital Photo Frame Sales & Forecasts
6.3.1 By Region – Global Digital Photo Frame Sales, 2020-2025
6.3.2 By Region – Global Digital Photo Frame Sales, 2026-2032
6.3.3 By Region – Global Digital Photo Frame Sales Market Share, 2020-2032
6.4 North America
6.4.1 By Country – North America Digital Photo Frame Revenue, 2020-2032
6.4.2 By Country – North America Digital Photo Frame Sales, 2020-2032
6.4.3 United States Digital Photo Frame Market Size, 2020-2032
6.4.4 Canada Digital Photo Frame Market Size, 2020-2032
6.4.5 Mexico Digital Photo Frame Market Size, 2020-2032
6.5 Europe
6.5.1 By Country – Europe Digital Photo Frame Revenue, 2020-2032
6.5.2 By Country – Europe Digital Photo Frame Sales, 2020-2032
6.5.3 Germany Digital Photo Frame Market Size, 2020-2032
6.5.4 France Digital Photo Frame Market Size, 2020-2032
6.5.5 U.K. Digital Photo Frame Market Size, 2020-2032
6.5.6 Italy Digital Photo Frame Market Size, 2020-2032
6.5.7 Russia Digital Photo Frame Market Size, 2020-2032
6.5.8 Nordic Countries Digital Photo Frame Market Size, 2020-2032
6.5.9 Benelux Digital Photo Frame Market Size, 2020-2032
6.6 Asia
6.6.1 By Region – Asia Digital Photo Frame Revenue, 2020-2032
6.6.2 By Region – Asia Digital Photo Frame Sales, 2020-2032
6.6.3 China Digital Photo Frame Market Size, 2020-2032
6.6.4 Japan Digital Photo Frame Market Size, 2020-2032
6.6.5 South Korea Digital Photo Frame Market Size, 2020-2032
6.6.6 Southeast Asia Digital Photo Frame Market Size, 2020-2032
6.6.7 India Digital Photo Frame Market Size, 2020-2032
6.7 South America
6.7.1 By Country – South America Digital Photo Frame Revenue, 2020-2032
6.7.2 By Country – South America Digital Photo Frame Sales, 2020-2032
6.7.3 Brazil Digital Photo Frame Market Size, 2020-2032
6.7.4 Argentina Digital Photo Frame Market Size, 2020-2032
6.8 Middle East & Africa
6.8.1 By Country – Middle East & Africa Digital Photo Frame Revenue, 2020-2032
6.8.2 By Country – Middle East & Africa Digital Photo Frame Sales, 2020-2032
6.8.3 Turkey Digital Photo Frame Market Size, 2020-2032
6.8.4 Israel Digital Photo Frame Market Size, 2020-2032
6.8.5 Saudi Arabia Digital Photo Frame Market Size, 2020-2032
6.8.6 UAE Digital Photo Frame Market Size, 2020-2032
7 Manufacturers & Brands Profiles
7.1 GiiNii
7.1.1 GiiNii Company Summary
7.1.2 GiiNii Business Overview
7.1.3 GiiNii Digital Photo Frame Major Product Offerings
7.1.4 GiiNii Digital Photo Frame Sales and Revenue in Global (2020-2025)
7.1.5 GiiNii Key News & Latest Developments
7.2 NIX
7.2.1 NIX Company Summary
7.2.2 NIX Business Overview
7.2.3 NIX Digital Photo Frame Major Product Offerings
7.2.4 NIX Digital Photo Frame Sales and Revenue in Global (2020-2025)
7.2.5 NIX Key News & Latest Developments
7.3 Aluratek
7.3.1 Aluratek Company Summary
7.3.2 Aluratek Business Overview
7.3.3 Aluratek Digital Photo Frame Major Product Offerings
7.3.4 Aluratek Digital Photo Frame Sales and Revenue in Global (2020-2025)
7.3.5 Aluratek Key News & Latest Developments
7.4 Micca
7.4.1 Micca Company Summary
7.4.2 Micca Business Overview
7.4.3 Micca Digital Photo Frame Major Product Offerings
7.4.4 Micca Digital Photo Frame Sales and Revenue in Global (2020-2025)
7.4.5 Micca Key News & Latest Developments
7.5 Sungale
7.5.1 Sungale Company Summary
7.5.2 Sungale Business Overview
7.5.3 Sungale Digital Photo Frame Major Product Offerings
7.5.4 Sungale Digital Photo Frame Sales and Revenue in Global (2020-2025)
7.5.5 Sungale Key News & Latest Developments
7.6 Digital Foci
7.6.1 Digital Foci Company Summary
7.6.2 Digital Foci Business Overview
7.6.3 Digital Foci Digital Photo Frame Major Product Offerings
7.6.4 Digital Foci Digital Photo Frame Sales and Revenue in Global (2020-2025)
7.6.5 Digital Foci Key News & Latest Developments
7.7 Philips
7.7.1 Philips Company Summary
7.7.2 Philips Business Overview
7.7.3 Philips Digital Photo Frame Major Product Offerings
7.7.4 Philips Digital Photo Frame Sales and Revenue in Global (2020-2025)
7.7.5 Philips Key News & Latest Developments
7.8 ViewSonic
7.8.1 ViewSonic Company Summary
7.8.2 ViewSonic Business Overview
7.8.3 ViewSonic Digital Photo Frame Major Product Offerings
7.8.4 ViewSonic Digital Photo Frame Sales and Revenue in Global (2020-2025)
7.8.5 ViewSonic Key News & Latest Developments
7.9 Pix-Star
7.9.1 Pix-Star Company Summary
7.9.2 Pix-Star Business Overview
7.9.3 Pix-Star Digital Photo Frame Major Product Offerings
7.9.4 Pix-Star Digital Photo Frame Sales and Revenue in Global (2020-2025)
7.9.5 Pix-Star Key News & Latest Developments
7.10 Sylvania
7.10.1 Sylvania Company Summary
7.10.2 Sylvania Business Overview
7.10.3 Sylvania Digital Photo Frame Major Product Offerings
7.10.4 Sylvania Digital Photo Frame Sales and Revenue in Global (2020-2025)
7.10.5 Sylvania Key News & Latest Developments
7.11 HP
7.11.1 HP Company Summary
7.11.2 HP Business Overview
7.11.3 HP Digital Photo Frame Major Product Offerings
7.11.4 HP Digital Photo Frame Sales and Revenue in Global (2020-2025)
7.11.5 HP Key News & Latest Developments
7.12 TENKER
7.12.1 TENKER Company Summary
7.12.2 TENKER Business Overview
7.12.3 TENKER Digital Photo Frame Major Product Offerings
7.12.4 TENKER Digital Photo Frame Sales and Revenue in Global (2020-2025)
7.12.5 TENKER Key News & Latest Developments
8 Global Digital Photo Frame Production Capacity, Analysis
8.1 Global Digital Photo Frame Production Capacity, 2020-2032
8.2 Digital Photo Frame Production Capacity of Key Manufacturers in Global Market
8.3 Global Digital Photo Frame Production by Region
9 Key Market Trends, Opportunity, Drivers and Restraints
9.1 Market Opportunities & Trends
9.2 Market Drivers
9.3 Market Restraints
10 Digital Photo Frame Supply Chain Analysis
10.1 Digital Photo Frame Industry Value Chain
10.2 Digital Photo Frame Upstream Market
10.3 Digital Photo Frame Downstream and Clients
10.4 Marketing Channels Analysis
10.4.1 Marketing Channels
10.4.2 Digital Photo Frame Distributors and Sales Agents in Global
11 Conclusion
12 Appendix
12.1 Note
12.2 Examples of Clients
12.3 DisclaimerList of Tables
Table 1. Key Players of Digital Photo Frame in Global Market
Table 2. Top Digital Photo Frame Players in Global Market, Ranking by Revenue (2024)
Table 3. Global Digital Photo Frame Revenue by Companies, (US$, Mn), 2020-2025
Table 4. Global Digital Photo Frame Revenue Share by Companies, 2020-2025
Table 5. Global Digital Photo Frame Sales by Companies, (K Units), 2020-2025
Table 6. Global Digital Photo Frame Sales Share by Companies, 2020-2025
Table 7. Key Manufacturers Digital Photo Frame Price (2020-2025) & (USD/Unit)
Table 8. Global Manufacturers Digital Photo Frame Product Type
Table 9. List of Global Tier 1 Digital Photo Frame Companies, Revenue (US$, Mn) in 2024 and Market Share
Table 10. List of Global Tier 2 and Tier 3 Digital Photo Frame Companies, Revenue (US$, Mn) in 2024 and Market Share
Table 11. Segment by Type – Global Digital Photo Frame Revenue, (US$, Mn), 2024 & 2032
Table 12. Segment by Type – Global Digital Photo Frame Revenue (US$, Mn), 2020-2025
Table 13. Segment by Type – Global Digital Photo Frame Revenue (US$, Mn), 2026-2032
Table 14. Segment by Type – Global Digital Photo Frame Sales (K Units), 2020-2025
Table 15. Segment by Type – Global Digital Photo Frame Sales (K Units), 2026-2032
Table 16. Segment by Application – Global Digital Photo Frame Revenue, (US$, Mn), 2024 & 2032
Table 17. Segment by Application – Global Digital Photo Frame Revenue, (US$, Mn), 2020-2025
Table 18. Segment by Application – Global Digital Photo Frame Revenue, (US$, Mn), 2026-2032
Table 19. Segment by Application – Global Digital Photo Frame Sales, (K Units), 2020-2025
Table 20. Segment by Application – Global Digital Photo Frame Sales, (K Units), 2026-2032
Table 21. By Region – Global Digital Photo Frame Revenue, (US$, Mn), 2025-2032
Table 22. By Region – Global Digital Photo Frame Revenue, (US$, Mn), 2020-2025
Table 23. By Region – Global Digital Photo Frame Revenue, (US$, Mn), 2026-2032
Table 24. By Region – Global Digital Photo Frame Sales, (K Units), 2020-2025
Table 25. By Region – Global Digital Photo Frame Sales, (K Units), 2026-2032
Table 26. By Country – North America Digital Photo Frame Revenue, (US$, Mn), 2020-2025
Table 27. By Country – North America Digital Photo Frame Revenue, (US$, Mn), 2026-2032
Table 28. By Country – North America Digital Photo Frame Sales, (K Units), 2020-2025
Table 29. By Country – North America Digital Photo Frame Sales, (K Units), 2026-2032
Table 30. By Country – Europe Digital Photo Frame Revenue, (US$, Mn), 2020-2025
Table 31. By Country – Europe Digital Photo Frame Revenue, (US$, Mn), 2026-2032
Table 32. By Country – Europe Digital Photo Frame Sales, (K Units), 2020-2025
Table 33. By Country – Europe Digital Photo Frame Sales, (K Units), 2026-2032
Table 34. By Region – Asia Digital Photo Frame Revenue, (US$, Mn), 2020-2025
Table 35. By Region – Asia Digital Photo Frame Revenue, (US$, Mn), 2026-2032
Table 36. By Region – Asia Digital Photo Frame Sales, (K Units), 2020-2025
Table 37. By Region – Asia Digital Photo Frame Sales, (K Units), 2026-2032
Table 38. By Country – South America Digital Photo Frame Revenue, (US$, Mn), 2020-2025
Table 39. By Country – South America Digital Photo Frame Revenue, (US$, Mn), 2026-2032
Table 40. By Country – South America Digital Photo Frame Sales, (K Units), 2020-2025
Table 41. By Country – South America Digital Photo Frame Sales, (K Units), 2026-2032
Table 42. By Country – Middle East & Africa Digital Photo Frame Revenue, (US$, Mn), 2020-2025
Table 43. By Country – Middle East & Africa Digital Photo Frame Revenue, (US$, Mn), 2026-2032
Table 44. By Country – Middle East & Africa Digital Photo Frame Sales, (K Units), 2020-2025
Table 45. By Country – Middle East & Africa Digital Photo Frame Sales, (K Units), 2026-2032
Table 46. GiiNii Company Summary
Table 47. GiiNii Digital Photo Frame Product Offerings
Table 48. GiiNii Digital Photo Frame Sales (K Units), Revenue (US$, Mn) and Average Price (USD/Unit) & (2020-2025)
Table 49. GiiNii Key News & Latest Developments
Table 50. NIX Company Summary
Table 51. NIX Digital Photo Frame Product Offerings
Table 52. NIX Digital Photo Frame Sales (K Units), Revenue (US$, Mn) and Average Price (USD/Unit) & (2020-2025)
Table 53. NIX Key News & Latest Developments
Table 54. Aluratek Company Summary
Table 55. Aluratek Digital Photo Frame Product Offerings
Table 56. Aluratek Digital Photo Frame Sales (K Units), Revenue (US$, Mn) and Average Price (USD/Unit) & (2020-2025)
Table 57. Aluratek Key News & Latest Developments
Table 58. Micca Company Summary
Table 59. Micca Digital Photo Frame Product Offerings
Table 60. Micca Digital Photo Frame Sales (K Units), Revenue (US$, Mn) and Average Price (USD/Unit) & (2020-2025)
Table 61. Micca Key News & Latest Developments
Table 62. Sungale Company Summary
Table 63. Sungale Digital Photo Frame Product Offerings
Table 64. Sungale Digital Photo Frame Sales (K Units), Revenue (US$, Mn) and Average Price (USD/Unit) & (2020-2025)
Table 65. Sungale Key News & Latest Developments
Table 66. Digital Foci Company Summary
Table 67. Digital Foci Digital Photo Frame Product Offerings
Table 68. Digital Foci Digital Photo Frame Sales (K Units), Revenue (US$, Mn) and Average Price (USD/Unit) & (2020-2025)
Table 69. Digital Foci Key News & Latest Developments
Table 70. Philips Company Summary
Table 71. Philips Digital Photo Frame Product Offerings
Table 72. Philips Digital Photo Frame Sales (K Units), Revenue (US$, Mn) and Average Price (USD/Unit) & (2020-2025)
Table 73. Philips Key News & Latest Developments
Table 74. ViewSonic Company Summary
Table 75. ViewSonic Digital Photo Frame Product Offerings
Table 76. ViewSonic Digital Photo Frame Sales (K Units), Revenue (US$, Mn) and Average Price (USD/Unit) & (2020-2025)
Table 77. ViewSonic Key News & Latest Developments
Table 78. Pix-Star Company Summary
Table 79. Pix-Star Digital Photo Frame Product Offerings
Table 80. Pix-Star Digital Photo Frame Sales (K Units), Revenue (US$, Mn) and Average Price (USD/Unit) & (2020-2025)
Table 81. Pix-Star Key News & Latest Developments
Table 82. Sylvania Company Summary
Table 83. Sylvania Digital Photo Frame Product Offerings
Table 84. Sylvania Digital Photo Frame Sales (K Units), Revenue (US$, Mn) and Average Price (USD/Unit) & (2020-2025)
Table 85. Sylvania Key News & Latest Developments
Table 86. HP Company Summary
Table 87. HP Digital Photo Frame Product Offerings
Table 88. HP Digital Photo Frame Sales (K Units), Revenue (US$, Mn) and Average Price (USD/Unit) & (2020-2025)
Table 89. HP Key News & Latest Developments
Table 90. TENKER Company Summary
Table 91. TENKER Digital Photo Frame Product Offerings
Table 92. TENKER Digital Photo Frame Sales (K Units), Revenue (US$, Mn) and Average Price (USD/Unit) & (2020-2025)
Table 93. TENKER Key News & Latest Developments
Table 94. Digital Photo Frame Capacity of Key Manufacturers in Global Market, 2023-2025 (K Units)
Table 95. Global Digital Photo Frame Capacity Market Share of Key Manufacturers, 2023-2025
Table 96. Global Digital Photo Frame Production by Region, 2020-2025 (K Units)
Table 97. Global Digital Photo Frame Production by Region, 2026-2032 (K Units)
Table 98. Digital Photo Frame Market Opportunities & Trends in Global Market
Table 99. Digital Photo Frame Market Drivers in Global Market
Table 100. Digital Photo Frame Market Restraints in Global Market
Table 101. Digital Photo Frame Raw Materials
Table 102. Digital Photo Frame Raw Materials Suppliers in Global Market
Table 103. Typical Digital Photo Frame Downstream
Table 104. Digital Photo Frame Downstream Clients in Global Market
Table 105. Digital Photo Frame Distributors and Sales Agents in Global Market

List of Figures
Figure 1. Digital Photo Frame Product Picture
Figure 2. Digital Photo Frame Segment by Type in 2024
Figure 3. Digital Photo Frame Segment by Application in 2024
Figure 4. Global Digital Photo Frame Market Overview: 2024
Figure 5. Key Caveats
Figure 6. Global Digital Photo Frame Market Size: 2024 VS 2032 (US$, Mn)
Figure 7. Global Digital Photo Frame Revenue: 2020-2032 (US$, Mn)
Figure 8. Digital Photo Frame Sales in Global Market: 2020-2032 (K Units)
Figure 9. The Top 3 and 5 Players Market Share by Digital Photo Frame Revenue in 2024
Figure 10. Segment by Type – Global Digital Photo Frame Revenue, (US$, Mn), 2024 & 2032
Figure 11. Segment by Type – Global Digital Photo Frame Revenue Market Share, 2020-2032
Figure 12. Segment by Type – Global Digital Photo Frame Sales Market Share, 2020-2032
Figure 13. Segment by Type – Global Digital Photo Frame Price (USD/Unit), 2020-2032
Figure 14. Segment by Application – Global Digital Photo Frame Revenue, (US$, Mn), 2024 & 2032
Figure 15. Segment by Application – Global Digital Photo Frame Revenue Market Share, 2020-2032
Figure 16. Segment by Application – Global Digital Photo Frame Sales Market Share, 2020-2032
Figure 17. Segment by Application -Global Digital Photo Frame Price (USD/Unit), 2020-2032
Figure 18. By Region – Global Digital Photo Frame Revenue, (US$, Mn), 2025 & 2032
Figure 19. By Region – Global Digital Photo Frame Revenue Market Share, 2020 VS 2024 VS 2032
Figure 20. By Region – Global Digital Photo Frame Revenue Market Share, 2020-2032
Figure 21. By Region – Global Digital Photo Frame Sales Market Share, 2020-2032
Figure 22. By Country – North America Digital Photo Frame Revenue Market Share, 2020-2032
Figure 23. By Country – North America Digital Photo Frame Sales Market Share, 2020-2032
Figure 24. United States Digital Photo Frame Revenue, (US$, Mn), 2020-2032
Figure 25. Canada Digital Photo Frame Revenue, (US$, Mn), 2020-2032
Figure 26. Mexico Digital Photo Frame Revenue, (US$, Mn), 2020-2032
Figure 27. By Country – Europe Digital Photo Frame Revenue Market Share, 2020-2032
Figure 28. By Country – Europe Digital Photo Frame Sales Market Share, 2020-2032
Figure 29. Germany Digital Photo Frame Revenue, (US$, Mn), 2020-2032
Figure 30. France Digital Photo Frame Revenue, (US$, Mn), 2020-2032
Figure 31. U.K. Digital Photo Frame Revenue, (US$, Mn), 2020-2032
Figure 32. Italy Digital Photo Frame Revenue, (US$, Mn), 2020-2032
Figure 33. Russia Digital Photo Frame Revenue, (US$, Mn), 2020-2032
Figure 34. Nordic Countries Digital Photo Frame Revenue, (US$, Mn), 2020-2032
Figure 35. Benelux Digital Photo Frame Revenue, (US$, Mn), 2020-2032
Figure 36. By Region – Asia Digital Photo Frame Revenue Market Share, 2020-2032
Figure 37. By Region – Asia Digital Photo Frame Sales Market Share, 2020-2032
Figure 38. China Digital Photo Frame Revenue, (US$, Mn), 2020-2032
Figure 39. Japan Digital Photo Frame Revenue, (US$, Mn), 2020-2032
Figure 40. South Korea Digital Photo Frame Revenue, (US$, Mn), 2020-2032
Figure 41. Southeast Asia Digital Photo Frame Revenue, (US$, Mn), 2020-2032
Figure 42. India Digital Photo Frame Revenue, (US$, Mn), 2020-2032
Figure 43. By Country – South America Digital Photo Frame Revenue Market Share, 2020-2032
Figure 44. By Country – South America Digital Photo Frame Sales, Market Share, 2020-2032
Figure 45. Brazil Digital Photo Frame Revenue, (US$, Mn), 2020-2032
Figure 46. Argentina Digital Photo Frame Revenue, (US$, Mn), 2020-2032
Figure 47. By Country – Middle East & Africa Digital Photo Frame Revenue, Market Share, 2020-2032
Figure 48. By Country – Middle East & Africa Digital Photo Frame Sales, Market Share, 2020-2032
Figure 49. Turkey Digital Photo Frame Revenue, (US$, Mn), 2020-2032
Figure 50. Israel Digital Photo Frame Revenue, (US$, Mn), 2020-2032
Figure 51. Saudi Arabia Digital Photo Frame Revenue, (US$, Mn), 2020-2032
Figure 52. UAE Digital Photo Frame Revenue, (US$, Mn), 2020-2032
Figure 53. Global Digital Photo Frame Production Capacity (K Units), 2020-2032
Figure 54. The Percentage of Production Digital Photo Frame by Region, 2024 VS 2032
Figure 55. Digital Photo Frame Industry Value Chain
Figure 56. Marketing Channels