Cycle Computer Market, Global Business Strategies 2026-2033

Cycle Computer Market was valued at USD 296 million in 2025 and is projected to grow from USD 318 million in 2026 to USD 487 million by 2033, exhibiting a CAGR of 7.6% during the forecast period.

PDF Icon Download Sample Report PDF
  • Quick Dispatch

    All Orders

  • Secure Payment

    100% Secure Payment

Price range: $1,500.00 through $4,250.00

Clear

Market Insights

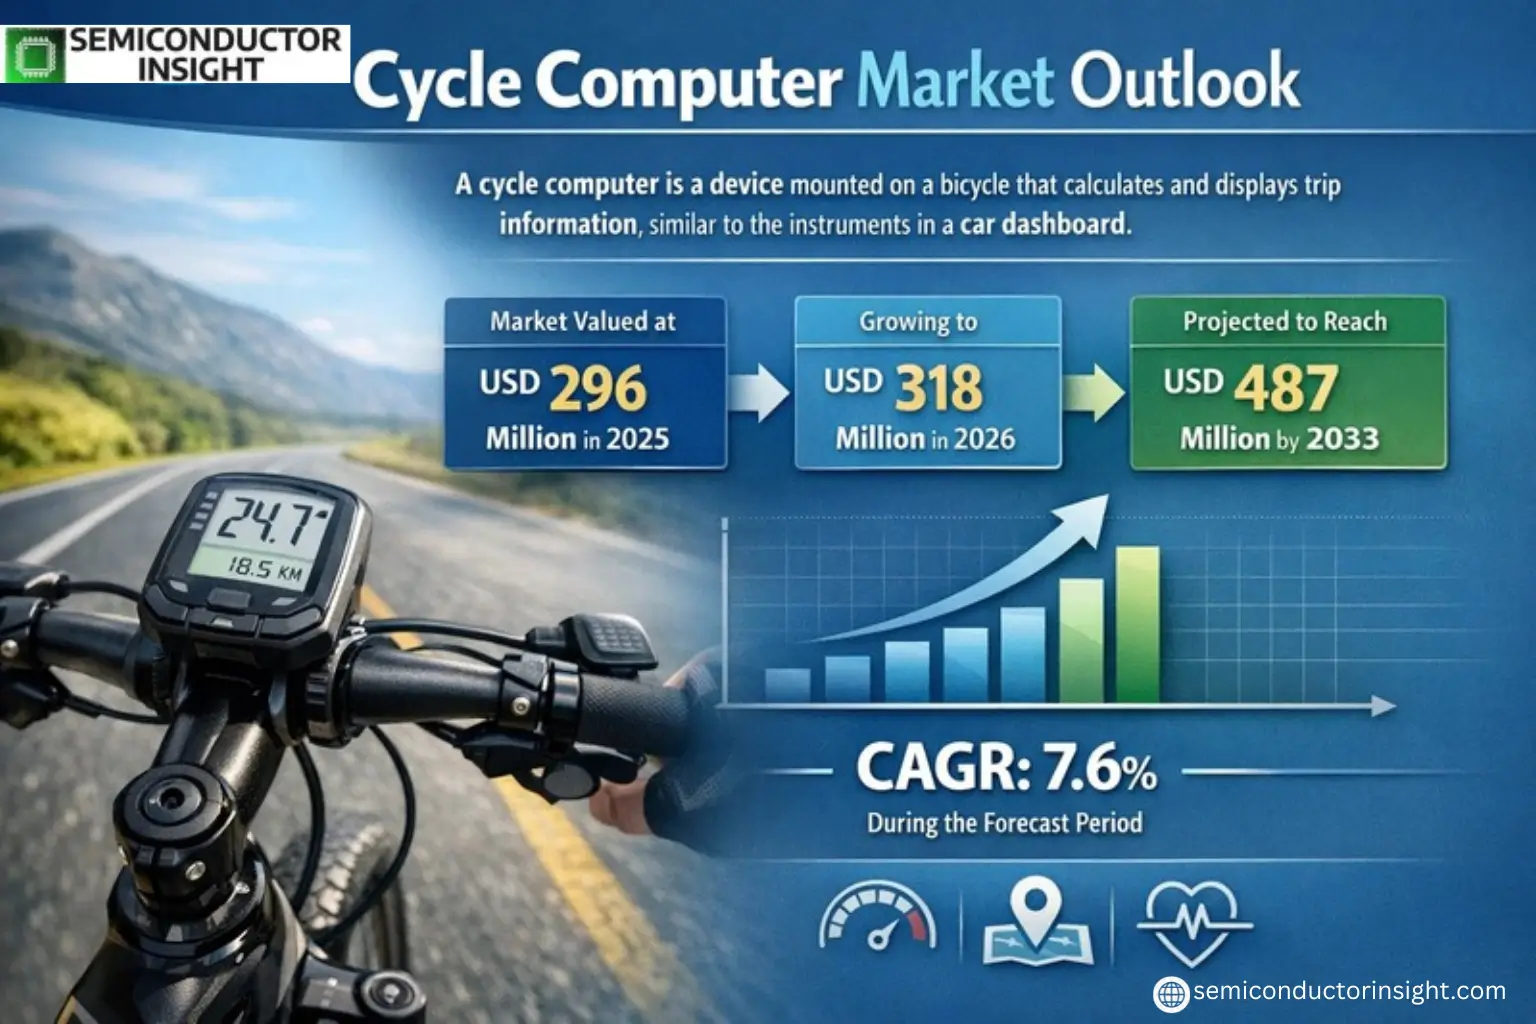
Global Cycle Computer Market was valued at USD 296 million in 2025 and is projected to grow from USD 318 million in 2026 to USD 487 million by 2033, exhibiting a CAGR of 7.6% during the forecast period.

A cycle computer is a device mounted on a bicycle that calculates and displays trip information, similar to the instruments in a car dashboard. The head unit, which includes the display, is typically attached to the handlebar for easy viewing. These devices provide critical metrics such as speed, distance, maximum speed, average speed, and cadence (pedal revolutions), making them essential tools for both casual riders and professional cyclists.

The market growth is driven by increasing interest in fitness tracking and cycling as a recreational activity. Wireless computers dominate the segment with over 40% market share due to their ease of installation and cleaner aesthetics. Europe leads global demand with over 30% market share, followed by North America and China. Key players like Garmin, CatEye, and Sigma Sport collectively hold more than 40% of the market through continuous innovation in GPS integration and smart connectivity features.

Xyz market size & forecast

MARKET DRIVERS

Growing Popularity of Cycling as Fitness Activity

Cycle Computer Market is experiencing significant growth driven by increasing global interest in cycling as both a recreational and fitness activity. Over 60% of urban commuters now consider cycling a viable transportation alternative, fueling demand for advanced cycling accessories like cycle computers. Health-conscious consumers are investing in performance-tracking technology to monitor speed, distance, and heart rate during workouts.

Technological Advancements in Bike Tech

Modern cycle computers now integrate with smartphones via Bluetooth, offering GPS navigation, wireless connectivity, and advanced metrics analysis. The emergence of ANT+ technology has enabled seamless sensor integration, allowing cyclists to track cadence, power output, and elevation with unprecedented accuracy.

Professional cycling teams and amateur enthusiasts alike are adopting these devices as essential training tools, with high-end models featuring color touchscreens becoming increasingly popular.

MARKET CHALLENGES

High Cost of Advanced Models

Premium cycle computers with full-featured GPS and wireless capabilities often carry price tags exceeding USD 500, creating accessibility barriers for casual cyclists. Approximately 45% of potential buyers cite cost as the primary deterrent to adoption in developing markets.

Other Challenges

Battery Life Limitations
While basic models offer months of operation, GPS-enabled cycle computers typically require frequent charging – sometimes daily for intensive use – which frustrates endurance athletes and touring cyclists.

MARKET RESTRAINTS

Competition from Smartphone Apps

Basic cycle computer functionality is increasingly replicated by free smartphone applications, with 68% of casual cyclists opting for app-based solutions rather than dedicated devices. This trend particularly impacts entry-level cycle computer sales, forcing manufacturers to emphasize specialized features that phones cannot replicate.

MARKET OPPORTUNITIES

Emerging E-Bike Market Integration

With e-bike sales growing at 12% annually, manufacturers are developing specialized cycle computers that monitor battery life, assist levels, and motor performance. This represents a USD 340 million untapped market segment by 2026. Additionally, integration with smart home systems and fitness ecosystems creates opportunities for premium product positioning.
Cycle Computer Market Trends

Steady Growth Projected for Cycle Computer Market

Global Cycle Computer Market was valued at USD 296 million in 2025 and is projected to reach USD 487 million by 2033, growing at a CAGR of 7.6%. This growth is driven by increasing cycling participation, smart device integration, and demand for performance tracking among professional and amateur cyclists alike. Wireless and GPS-enabled computers are seeing particularly strong adoption as cyclists seek more advanced metrics.

Other Trends

Dominance of Wireless Technology

Wireless cycle computers now command over 40% market share, surpassing wired models due to easier installation and cleaner aesthetics. GPS-enabled models are gaining traction in the premium segment, offering route tracking and smartphone connectivity features that appeal to tech-savvy riders.

Regional Market Leaders

Europe remains the largest market for cycle computers with over 30% share, followed closely by North America and China. The region’s strong cycling culture and infrastructure support steady demand, while Asia Pacific shows the fastest growth potential as cycling gains popularity in urban areas.

Application-Specific Growth

Mountain bikes account for the largest application segment due to the technical demands of off-road riding. However, road bikes are showing faster adoption rates as competitive cyclists increasingly rely on performance data. Leading manufacturers like Garmin, CatEye, and Sigma Sport continue to dominate the market with their rugged, feature-rich offerings that meet diverse rider needs.

The industry is responding to consumer demand with smarter connectivity options, longer battery life, and more intuitive interfaces. As cycling evolves both as transportation and sport, the Cycle Computer Market appears poised for sustained technological advancement alongside its steady financial growth.

COMPETITIVE LANDSCAPE

Key Industry Players

Global Leaders Dominate Over 40% Market Share

Global Cycle Computer Market is moderately concentrated, with the top three players Garmin, CatEye, and Sigma Sport controlling over 40% market share. Garmin leads with advanced GPS-enabled cycling computers that integrate seamlessly with its ecosystem of fitness devices. CatEye dominates the entry-to-mid segment with reliable wireless models, while Sigma Sport maintains strong European distribution networks. These players compete on technological innovation, with wireless and GPS-enabled devices driving 60% of new product launches.

Niche segments see competition from specialized players: Wahoo Fitness focuses on smart trainer integration, Bryton Inc. targets budget-conscious cyclists in APAC, and Polar emphasizes performance analytics. European brands like o-synce and VDO Cyclecomputers maintain regional strongholds with durable mechanical designs. Emerging competition comes from bicycle manufacturers Trek, Giant, and Raleigh bundling computers with premium bikes to capture brand-loyal customers.

List of Key Cycle Computer Companies Profiled

  • Garmin
  • CatEye
  • Sigma Sport
  • Polar
  • Bryton Inc
  • Pioneer Electronics
  • Wahoo Fitness
  • Topeak Inc
  • VDO Cyclecomputers
  • o-synce
  • BBB Cycling
  • Giant Bicycles
  • Trek Bicycle
  • Raleigh (Accell Group)
  • KNOG

Segment Analysis:

Segment Category Sub-Segments Key Insights
By Type
  • Wired Computer
  • Wireless Computer
  • Wireless and GPS Computer
Wireless Computer dominates the market due to superior convenience and cleaner aesthetics.

  • Elimination of cable management challenges enhances user experience
  • Increasing adoption of Bluetooth/ANT+ connectivity for seamless data tracking
  • Premium models integrating GPS functionality show strong growth potential
By Application
  • Mountain Bike
  • Road Bike
  • Others
Mountain Bike segment leads with specialized computers for rugged terrain.

  • Higher durability requirements driving premium product development
  • Advanced navigation features critical for trail riding applications
  • Growing popularity of endurance mountain biking events boosting demand
By End User
  • Professional Cyclists
  • Recreational Riders
  • Fitness Enthusiasts
Fitness Enthusiasts represent the fastest growing segment.

  • Increasing health awareness and cycling adoption post-pandemic
  • Demand for comprehensive performance tracking metrics
  • Integration with fitness apps and wearables enhancing appeal
By Connectivity
  • Bluetooth
  • ANT+
  • Dual Connectivity
Dual Connectivity is emerging as the preferred standard.

  • Simultaneous connection with multiple devices boosts functionality
  • Compatibility with diverse sensor ecosystems increases versatility
  • Seamless data synchronization across platforms enhances user experience
By Price Range
  • Entry Level
  • Mid Range
  • Premium
Mid Range segment shows strongest market appeal.

  • Optimal balance between features and affordability attracts mainstream users
  • Wider distribution channels improve accessibility for casual cyclists
  • Growing capabilities at lower price points fueling upgradation cycle

Regional Analysis: Global Cycle Computer Market

North America

The North American Cycle Computer Market leads globally due to strong cycling infrastructure and high disposable income. This region shows premiumization trends with cyclists investing in advanced GPS-enabled computers with ANT+ and Bluetooth connectivity. Major manufacturers focus on feature-rich models integrating navigation, training metrics, and smartphone synchronization. The United States dominates with tech-savvy cycling communities in California and Colorado driving innovation. Canadian markets follow similar patterns with growing interest in winter cycling tech. Both recreational and professional cyclists adopt these devices, creating year-round demand. Distribution channels favor specialized bike shops and e-commerce platforms offering detailed product comparisons.

Technology Adoption
North American consumers prefer touchscreen interfaces and cloud-based data synchronization. Integration with Strava and TrainingPeaks platforms is becoming standard for all mid-to-high-end models. Manufacturers emphasize user experience with intuitive dashboards.
Product Innovation
The region sees continuous hardware upgrades including solar charging capabilities and offline maps. Waterproof rating standards (IPX7+) are now expected across all price segments. Smart notifications and crash detection gain popularity among commuters.
Distribution Channels
Specialty cycling retailers maintain dominance for premium models, while Amazon captures entry-level market share. Direct-to-consumer brands leverage social media marketing targeting millennium cyclists. Bike-sharing programs create secondary markets for durable basic computers.
Consumer Behavior
Cyclists demonstrate brand loyalty to Garmin and Wahoo while exploring new AI-powered alternatives. Training-focused users demand precise power meter integration. Urban commuters prioritize theft prevention features and minimalist designs blending with bike aesthetics.

Europe
Europe’s Cycle Computer Market thrives through bicycle culture integration and environmental consciousness. Germany and Netherlands drive demand with extensive cycling routes requiring navigation features. The region shows preference for rugged designs suited for all-weather conditions. EU regulations promote standardized bike tech certifications encouraging manufacturer compliance. Southern European countries exhibit growing adoption among touring cyclists. The market balances between affordable wired computers and high-end GPS units through structured price segmentation.

Asia-Pacific
Asia-Pacific emerges as the fastest-growing region with Japan and Australia leading in technology adoption. Chinese manufacturers dominate budget segments while importing premium models. Urbanization increases demand for basic odometers in India and Southeast Asia. Mountain biking communities in New Zealand spur specialized computer sales. The region sees unique product requirements like multilingual interfaces and extreme weather durability testing.

South America
Brazil and Argentina form the core South American market with cycling tourism applications. Basic computers prevail due to price sensitivity, though premium models gain traction among professional athletes. Local manufacturers focus on Spanish/Portuguese language support. Security features like GPS tracking become standard in high-crime urban areas. Economic instability creates demand fluctuation across price segments.

Middle East & Africa
Middle Eastern markets concentrate in UAE and Saudi Arabia with luxury cycling computers for expat communities. South Africa shows gradual growth through cycling event sponsorships. Desert conditions necessitate enhanced dust protection in product designs. The region sees potential in integrating Islamic prayer time alerts for touring cyclists, representing unique localization opportunities.

Report Scope

This market research report provides a comprehensive analysis of the Cycle Computer Market, covering the forecast period 2026–2033. It offers detailed insights into market dynamics, technological advancements, competitive landscape, and key trends shaping the industry.

Key focus areas of the report include:

  • Market Overview: The report begins with an overview outlining its current market scenario, key growth indicators, and industry transformation drivers. It discusses macroeconomic factors, demand–supply balance, regulatory landscape, and the strategic role of cycle computers in enhancing cycling performance and training efficiency.
  • Market Size & Forecast: Historical data and future projections for revenue, unit shipments, and market value across major regions and segments.
  • Segmentation Analysis: Detailed breakdown by product type (Wired Computer, Wireless Computer, Wireless and GPS Computer), application (Mountain Bike, Road Bike, Others), and end-user industry to identify high-growth segments and investment opportunities.
  • Regional Insights: Insights into market performance across North America, Europe, Asia-Pacific, Latin America, and the Middle East & Africa, including country-level analysis where relevant.
  • Competitive Landscape: Profiles of leading market participants, including their product offerings, R&D focus, manufacturing capacity, pricing strategies, and recent developments such as mergers, acquisitions, and partnerships.
  • Technology Trends & Innovation: Assessment of emerging technologies, integration of GPS, cadence sensors, and evolving industry standards.
  • Market Drivers & Restraints: Evaluation of factors driving market growth along with challenges, supply chain constraints, regulatory issues, and market-entry barriers.
  • Stakeholder Insights: Insights for component suppliers, OEMs, system integrators, investors, and policymakers regarding the evolving ecosystem and strategic opportunities.

Primary and secondary research methods are employed, including interviews with industry experts, data from verified sources, and real-time market intelligence to ensure the accuracy and reliability of the insights presented.

FREQUENTLY ASKED QUESTIONS:

What is the current market size of Cycle Computer Market?

-> Cycle Computer Market was valued at USD 296 million in 2025 and is projected to grow from USD 318 million in 2026 to USD 487 million by 2033, exhibiting a CAGR of 7.6% during the forecast period.

What is the growth rate of the Cycle Computer Market?

-> The market is projected to grow at a CAGR of 7.6% during the forecast period 2025-2033.

Which key companies operate in Cycle Computer Market?

-> Key players include Garmin, CatEye, Sigma Sport, Pioneer Electronics, Polar, Bryton Inc, Giant Bicycles, Raleigh (Accell Group), Trek Bicycle, and Wahoo Fitness, among others.

Which region dominates the Cycle Computer Market?

-> Europe is the largest market with over 30% share, followed by China and North America.

What are the key product segments in the Cycle Computer Market?

-> The Wireless Computer segment holds the largest share (over 40%), followed by Wired Computer and Wireless and GPS Computer.

What are the major applications of Cycle Computers?

-> The largest application is Mountain Bike, followed by Road Bike and other applications.

Cycle Computer Market, Global Business Strategies 2026-2033

Get Sample Report PDF for Exclusive Insights

Report Sample Includes

  • Table of Contents
  • List of Tables & Figures
  • Charts, Research Methodology, and more...
PDF Icon Download Sample Report PDF
SKU: 4221380eaede
Category:
Tag:
License Type

Corporate License, Excel License, PDF and Excel Databook License

Download Sample Report

Table of Content

1 Introduction to Research & Analysis Reports
1.1 Cycle Computer Market Definition
1.2 Market Segments
1.2.1 Segment by Type
1.2.2 Segment by Application
1.3 Global Cycle Computer Market Overview
1.4 Features & Benefits of This Report
1.5 Methodology & Sources of Information
1.5.1 Research Methodology
1.5.2 Research Process
1.5.3 Base Year
1.5.4 Report Assumptions & Caveats
2 Global Cycle Computer Overall Market Size
2.1 Global Cycle Computer Market Size: 2024 VS 2032
2.2 Global Cycle Computer Market Size, Prospects & Forecasts: 2020-2032
2.3 Global Cycle Computer Sales: 2020-2032
3 Company Landscape
3.1 Top Cycle Computer Players in Global Market
3.2 Top Global Cycle Computer Companies Ranked by Revenue
3.3 Global Cycle Computer Revenue by Companies
3.4 Global Cycle Computer Sales by Companies
3.5 Global Cycle Computer Price by Manufacturer (2020-2025)
3.6 Top 3 and Top 5 Cycle Computer Companies in Global Market, by Revenue in 2024
3.7 Global Manufacturers Cycle Computer Product Type
3.8 Tier 1, Tier 2, and Tier 3 Cycle Computer Players in Global Market
3.8.1 List of Global Tier 1 Cycle Computer Companies
3.8.2 List of Global Tier 2 and Tier 3 Cycle Computer Companies
4 Sights by Product
4.1 Overview
4.1.1 Segment by Type – Global Cycle Computer Market Size Markets, 2024 & 2032
4.1.2 Wired Computer
4.1.3 Wireless Computer
4.1.4 Wireless and GPS Computer
4.2 Segment by Type – Global Cycle Computer Revenue & Forecasts
4.2.1 Segment by Type – Global Cycle Computer Revenue, 2020-2025
4.2.2 Segment by Type – Global Cycle Computer Revenue, 2026-2032
4.2.3 Segment by Type – Global Cycle Computer Revenue Market Share, 2020-2032
4.3 Segment by Type – Global Cycle Computer Sales & Forecasts
4.3.1 Segment by Type – Global Cycle Computer Sales, 2020-2025
4.3.2 Segment by Type – Global Cycle Computer Sales, 2026-2032
4.3.3 Segment by Type – Global Cycle Computer Sales Market Share, 2020-2032
4.4 Segment by Type – Global Cycle Computer Price (Manufacturers Selling Prices), 2020-2032
5 Sights by Application
5.1 Overview
5.1.1 Segment by Application – Global Cycle Computer Market Size, 2024 & 2032
5.1.2 Mountain Bike
5.1.3 Road Bike
5.1.4 Other
5.2 Segment by Application – Global Cycle Computer Revenue & Forecasts
5.2.1 Segment by Application – Global Cycle Computer Revenue, 2020-2025
5.2.2 Segment by Application – Global Cycle Computer Revenue, 2026-2032
5.2.3 Segment by Application – Global Cycle Computer Revenue Market Share, 2020-2032
5.3 Segment by Application – Global Cycle Computer Sales & Forecasts
5.3.1 Segment by Application – Global Cycle Computer Sales, 2020-2025
5.3.2 Segment by Application – Global Cycle Computer Sales, 2026-2032
5.3.3 Segment by Application – Global Cycle Computer Sales Market Share, 2020-2032
5.4 Segment by Application – Global Cycle Computer Price (Manufacturers Selling Prices), 2020-2032
6 Sights by Region
6.1 By Region – Global Cycle Computer Market Size, 2024 & 2032
6.2 By Region – Global Cycle Computer Revenue & Forecasts
6.2.1 By Region – Global Cycle Computer Revenue, 2020-2025
6.2.2 By Region – Global Cycle Computer Revenue, 2026-2032
6.2.3 By Region – Global Cycle Computer Revenue Market Share, 2020-2032
6.3 By Region – Global Cycle Computer Sales & Forecasts
6.3.1 By Region – Global Cycle Computer Sales, 2020-2025
6.3.2 By Region – Global Cycle Computer Sales, 2026-2032
6.3.3 By Region – Global Cycle Computer Sales Market Share, 2020-2032
6.4 North America
6.4.1 By Country – North America Cycle Computer Revenue, 2020-2032
6.4.2 By Country – North America Cycle Computer Sales, 2020-2032
6.4.3 United States Cycle Computer Market Size, 2020-2032
6.4.4 Canada Cycle Computer Market Size, 2020-2032
6.4.5 Mexico Cycle Computer Market Size, 2020-2032
6.5 Europe
6.5.1 By Country – Europe Cycle Computer Revenue, 2020-2032
6.5.2 By Country – Europe Cycle Computer Sales, 2020-2032
6.5.3 Germany Cycle Computer Market Size, 2020-2032
6.5.4 France Cycle Computer Market Size, 2020-2032
6.5.5 U.K. Cycle Computer Market Size, 2020-2032
6.5.6 Italy Cycle Computer Market Size, 2020-2032
6.5.7 Russia Cycle Computer Market Size, 2020-2032
6.5.8 Nordic Countries Cycle Computer Market Size, 2020-2032
6.5.9 Benelux Cycle Computer Market Size, 2020-2032
6.6 Asia
6.6.1 By Region – Asia Cycle Computer Revenue, 2020-2032
6.6.2 By Region – Asia Cycle Computer Sales, 2020-2032
6.6.3 China Cycle Computer Market Size, 2020-2032
6.6.4 Japan Cycle Computer Market Size, 2020-2032
6.6.5 South Korea Cycle Computer Market Size, 2020-2032
6.6.6 Southeast Asia Cycle Computer Market Size, 2020-2032
6.6.7 India Cycle Computer Market Size, 2020-2032
6.7 South America
6.7.1 By Country – South America Cycle Computer Revenue, 2020-2032
6.7.2 By Country – South America Cycle Computer Sales, 2020-2032
6.7.3 Brazil Cycle Computer Market Size, 2020-2032
6.7.4 Argentina Cycle Computer Market Size, 2020-2032
6.8 Middle East & Africa
6.8.1 By Country – Middle East & Africa Cycle Computer Revenue, 2020-2032
6.8.2 By Country – Middle East & Africa Cycle Computer Sales, 2020-2032
6.8.3 Turkey Cycle Computer Market Size, 2020-2032
6.8.4 Israel Cycle Computer Market Size, 2020-2032
6.8.5 Saudi Arabia Cycle Computer Market Size, 2020-2032
6.8.6 UAE Cycle Computer Market Size, 2020-2032
7 Manufacturers & Brands Profiles
7.1 Garmin
7.1.1 Garmin Company Summary
7.1.2 Garmin Business Overview
7.1.3 Garmin Cycle Computer Major Product Offerings
7.1.4 Garmin Cycle Computer Sales and Revenue in Global (2020-2025)
7.1.5 Garmin Key News & Latest Developments
7.2 CatEye
7.2.1 CatEye Company Summary
7.2.2 CatEye Business Overview
7.2.3 CatEye Cycle Computer Major Product Offerings
7.2.4 CatEye Cycle Computer Sales and Revenue in Global (2020-2025)
7.2.5 CatEye Key News & Latest Developments
7.3 Pioneer Electronics
7.3.1 Pioneer Electronics Company Summary
7.3.2 Pioneer Electronics Business Overview
7.3.3 Pioneer Electronics Cycle Computer Major Product Offerings
7.3.4 Pioneer Electronics Cycle Computer Sales and Revenue in Global (2020-2025)
7.3.5 Pioneer Electronics Key News & Latest Developments
7.4 Sigma Sport
7.4.1 Sigma Sport Company Summary
7.4.2 Sigma Sport Business Overview
7.4.3 Sigma Sport Cycle Computer Major Product Offerings
7.4.4 Sigma Sport Cycle Computer Sales and Revenue in Global (2020-2025)
7.4.5 Sigma Sport Key News & Latest Developments
7.5 Polar
7.5.1 Polar Company Summary
7.5.2 Polar Business Overview
7.5.3 Polar Cycle Computer Major Product Offerings
7.5.4 Polar Cycle Computer Sales and Revenue in Global (2020-2025)
7.5.5 Polar Key News & Latest Developments
7.6 Bryton Inc
7.6.1 Bryton Inc Company Summary
7.6.2 Bryton Inc Business Overview
7.6.3 Bryton Inc Cycle Computer Major Product Offerings
7.6.4 Bryton Inc Cycle Computer Sales and Revenue in Global (2020-2025)
7.6.5 Bryton Inc Key News & Latest Developments
7.7 Giant Bicycles
7.7.1 Giant Bicycles Company Summary
7.7.2 Giant Bicycles Business Overview
7.7.3 Giant Bicycles Cycle Computer Major Product Offerings
7.7.4 Giant Bicycles Cycle Computer Sales and Revenue in Global (2020-2025)
7.7.5 Giant Bicycles Key News & Latest Developments
7.8 Raleigh (Accell Group)
7.8.1 Raleigh (Accell Group) Company Summary
7.8.2 Raleigh (Accell Group) Business Overview
7.8.3 Raleigh (Accell Group) Cycle Computer Major Product Offerings
7.8.4 Raleigh (Accell Group) Cycle Computer Sales and Revenue in Global (2020-2025)
7.8.5 Raleigh (Accell Group) Key News & Latest Developments
7.9 Trek Bicycle
7.9.1 Trek Bicycle Company Summary
7.9.2 Trek Bicycle Business Overview
7.9.3 Trek Bicycle Cycle Computer Major Product Offerings
7.9.4 Trek Bicycle Cycle Computer Sales and Revenue in Global (2020-2025)
7.9.5 Trek Bicycle Key News & Latest Developments
7.10 Wahoo Fitness
7.10.1 Wahoo Fitness Company Summary
7.10.2 Wahoo Fitness Business Overview
7.10.3 Wahoo Fitness Cycle Computer Major Product Offerings
7.10.4 Wahoo Fitness Cycle Computer Sales and Revenue in Global (2020-2025)
7.10.5 Wahoo Fitness Key News & Latest Developments
7.11 Topeak Inc
7.11.1 Topeak Inc Company Summary
7.11.2 Topeak Inc Business Overview
7.11.3 Topeak Inc Cycle Computer Major Product Offerings
7.11.4 Topeak Inc Cycle Computer Sales and Revenue in Global (2020-2025)
7.11.5 Topeak Inc Key News & Latest Developments
7.12 VDO Cyclecomputers
7.12.1 VDO Cyclecomputers Company Summary
7.12.2 VDO Cyclecomputers Business Overview
7.12.3 VDO Cyclecomputers Cycle Computer Major Product Offerings
7.12.4 VDO Cyclecomputers Cycle Computer Sales and Revenue in Global (2020-2025)
7.12.5 VDO Cyclecomputers Key News & Latest Developments
7.13 o-synce
7.13.1 o-synce Company Summary
7.13.2 o-synce Business Overview
7.13.3 o-synce Cycle Computer Major Product Offerings
7.13.4 o-synce Cycle Computer Sales and Revenue in Global (2020-2025)
7.13.5 o-synce Key News & Latest Developments
7.14 BBB Cycling
7.14.1 BBB Cycling Company Summary
7.14.2 BBB Cycling Business Overview
7.14.3 BBB Cycling Cycle Computer Major Product Offerings
7.14.4 BBB Cycling Cycle Computer Sales and Revenue in Global (2020-2025)
7.14.5 BBB Cycling Key News & Latest Developments
7.15 Bion
7.15.1 Bion Company Summary
7.15.2 Bion Business Overview
7.15.3 Bion Cycle Computer Major Product Offerings
7.15.4 Bion Cycle Computer Sales and Revenue in Global (2020-2025)
7.15.5 Bion Key News & Latest Developments
7.16 KNOG
7.16.1 KNOG Company Summary
7.16.2 KNOG Business Overview
7.16.3 KNOG Cycle Computer Major Product Offerings
7.16.4 KNOG Cycle Computer Sales and Revenue in Global (2020-2025)
7.16.5 KNOG Key News & Latest Developments
8 Global Cycle Computer Production Capacity, Analysis
8.1 Global Cycle Computer Production Capacity, 2020-2032
8.2 Cycle Computer Production Capacity of Key Manufacturers in Global Market
8.3 Global Cycle Computer Production by Region
9 Key Market Trends, Opportunity, Drivers and Restraints
9.1 Market Opportunities & Trends
9.2 Market Drivers
9.3 Market Restraints
10 Cycle Computer Supply Chain Analysis
10.1 Cycle Computer Industry Value Chain
10.2 Cycle Computer Upstream Market
10.3 Cycle Computer Downstream and Clients
10.4 Marketing Channels Analysis
10.4.1 Marketing Channels
10.4.2 Cycle Computer Distributors and Sales Agents in Global
11 Conclusion
12 Appendix
12.1 Note
12.2 Examples of Clients
12.3 DisclaimerList of Tables
Table 1. Key Players of Cycle Computer in Global Market
Table 2. Top Cycle Computer Players in Global Market, Ranking by Revenue (2024)
Table 3. Global Cycle Computer Revenue by Companies, (US$, Mn), 2020-2025
Table 4. Global Cycle Computer Revenue Share by Companies, 2020-2025
Table 5. Global Cycle Computer Sales by Companies, (K Units), 2020-2025
Table 6. Global Cycle Computer Sales Share by Companies, 2020-2025
Table 7. Key Manufacturers Cycle Computer Price (2020-2025) & (USD/Unit)
Table 8. Global Manufacturers Cycle Computer Product Type
Table 9. List of Global Tier 1 Cycle Computer Companies, Revenue (US$, Mn) in 2024 and Market Share
Table 10. List of Global Tier 2 and Tier 3 Cycle Computer Companies, Revenue (US$, Mn) in 2024 and Market Share
Table 11. Segment by Type – Global Cycle Computer Revenue, (US$, Mn), 2024 & 2032
Table 12. Segment by Type – Global Cycle Computer Revenue (US$, Mn), 2020-2025
Table 13. Segment by Type – Global Cycle Computer Revenue (US$, Mn), 2026-2032
Table 14. Segment by Type – Global Cycle Computer Sales (K Units), 2020-2025
Table 15. Segment by Type – Global Cycle Computer Sales (K Units), 2026-2032
Table 16. Segment by Application – Global Cycle Computer Revenue, (US$, Mn), 2024 & 2032
Table 17. Segment by Application – Global Cycle Computer Revenue, (US$, Mn), 2020-2025
Table 18. Segment by Application – Global Cycle Computer Revenue, (US$, Mn), 2026-2032
Table 19. Segment by Application – Global Cycle Computer Sales, (K Units), 2020-2025
Table 20. Segment by Application – Global Cycle Computer Sales, (K Units), 2026-2032
Table 21. By Region – Global Cycle Computer Revenue, (US$, Mn), 2025-2032
Table 22. By Region – Global Cycle Computer Revenue, (US$, Mn), 2020-2025
Table 23. By Region – Global Cycle Computer Revenue, (US$, Mn), 2026-2032
Table 24. By Region – Global Cycle Computer Sales, (K Units), 2020-2025
Table 25. By Region – Global Cycle Computer Sales, (K Units), 2026-2032
Table 26. By Country – North America Cycle Computer Revenue, (US$, Mn), 2020-2025
Table 27. By Country – North America Cycle Computer Revenue, (US$, Mn), 2026-2032
Table 28. By Country – North America Cycle Computer Sales, (K Units), 2020-2025
Table 29. By Country – North America Cycle Computer Sales, (K Units), 2026-2032
Table 30. By Country – Europe Cycle Computer Revenue, (US$, Mn), 2020-2025
Table 31. By Country – Europe Cycle Computer Revenue, (US$, Mn), 2026-2032
Table 32. By Country – Europe Cycle Computer Sales, (K Units), 2020-2025
Table 33. By Country – Europe Cycle Computer Sales, (K Units), 2026-2032
Table 34. By Region – Asia Cycle Computer Revenue, (US$, Mn), 2020-2025
Table 35. By Region – Asia Cycle Computer Revenue, (US$, Mn), 2026-2032
Table 36. By Region – Asia Cycle Computer Sales, (K Units), 2020-2025
Table 37. By Region – Asia Cycle Computer Sales, (K Units), 2026-2032
Table 38. By Country – South America Cycle Computer Revenue, (US$, Mn), 2020-2025
Table 39. By Country – South America Cycle Computer Revenue, (US$, Mn), 2026-2032
Table 40. By Country – South America Cycle Computer Sales, (K Units), 2020-2025
Table 41. By Country – South America Cycle Computer Sales, (K Units), 2026-2032
Table 42. By Country – Middle East & Africa Cycle Computer Revenue, (US$, Mn), 2020-2025
Table 43. By Country – Middle East & Africa Cycle Computer Revenue, (US$, Mn), 2026-2032
Table 44. By Country – Middle East & Africa Cycle Computer Sales, (K Units), 2020-2025
Table 45. By Country – Middle East & Africa Cycle Computer Sales, (K Units), 2026-2032
Table 46. Garmin Company Summary
Table 47. Garmin Cycle Computer Product Offerings
Table 48. Garmin Cycle Computer Sales (K Units), Revenue (US$, Mn) and Average Price (USD/Unit) & (2020-2025)
Table 49. Garmin Key News & Latest Developments
Table 50. CatEye Company Summary
Table 51. CatEye Cycle Computer Product Offerings
Table 52. CatEye Cycle Computer Sales (K Units), Revenue (US$, Mn) and Average Price (USD/Unit) & (2020-2025)
Table 53. CatEye Key News & Latest Developments
Table 54. Pioneer Electronics Company Summary
Table 55. Pioneer Electronics Cycle Computer Product Offerings
Table 56. Pioneer Electronics Cycle Computer Sales (K Units), Revenue (US$, Mn) and Average Price (USD/Unit) & (2020-2025)
Table 57. Pioneer Electronics Key News & Latest Developments
Table 58. Sigma Sport Company Summary
Table 59. Sigma Sport Cycle Computer Product Offerings
Table 60. Sigma Sport Cycle Computer Sales (K Units), Revenue (US$, Mn) and Average Price (USD/Unit) & (2020-2025)
Table 61. Sigma Sport Key News & Latest Developments
Table 62. Polar Company Summary
Table 63. Polar Cycle Computer Product Offerings
Table 64. Polar Cycle Computer Sales (K Units), Revenue (US$, Mn) and Average Price (USD/Unit) & (2020-2025)
Table 65. Polar Key News & Latest Developments
Table 66. Bryton Inc Company Summary
Table 67. Bryton Inc Cycle Computer Product Offerings
Table 68. Bryton Inc Cycle Computer Sales (K Units), Revenue (US$, Mn) and Average Price (USD/Unit) & (2020-2025)
Table 69. Bryton Inc Key News & Latest Developments
Table 70. Giant Bicycles Company Summary
Table 71. Giant Bicycles Cycle Computer Product Offerings
Table 72. Giant Bicycles Cycle Computer Sales (K Units), Revenue (US$, Mn) and Average Price (USD/Unit) & (2020-2025)
Table 73. Giant Bicycles Key News & Latest Developments
Table 74. Raleigh (Accell Group) Company Summary
Table 75. Raleigh (Accell Group) Cycle Computer Product Offerings
Table 76. Raleigh (Accell Group) Cycle Computer Sales (K Units), Revenue (US$, Mn) and Average Price (USD/Unit) & (2020-2025)
Table 77. Raleigh (Accell Group) Key News & Latest Developments
Table 78. Trek Bicycle Company Summary
Table 79. Trek Bicycle Cycle Computer Product Offerings
Table 80. Trek Bicycle Cycle Computer Sales (K Units), Revenue (US$, Mn) and Average Price (USD/Unit) & (2020-2025)
Table 81. Trek Bicycle Key News & Latest Developments
Table 82. Wahoo Fitness Company Summary
Table 83. Wahoo Fitness Cycle Computer Product Offerings
Table 84. Wahoo Fitness Cycle Computer Sales (K Units), Revenue (US$, Mn) and Average Price (USD/Unit) & (2020-2025)
Table 85. Wahoo Fitness Key News & Latest Developments
Table 86. Topeak Inc Company Summary
Table 87. Topeak Inc Cycle Computer Product Offerings
Table 88. Topeak Inc Cycle Computer Sales (K Units), Revenue (US$, Mn) and Average Price (USD/Unit) & (2020-2025)
Table 89. Topeak Inc Key News & Latest Developments
Table 90. VDO Cyclecomputers Company Summary
Table 91. VDO Cyclecomputers Cycle Computer Product Offerings
Table 92. VDO Cyclecomputers Cycle Computer Sales (K Units), Revenue (US$, Mn) and Average Price (USD/Unit) & (2020-2025)
Table 93. VDO Cyclecomputers Key News & Latest Developments
Table 94. o-synce Company Summary
Table 95. o-synce Cycle Computer Product Offerings
Table 96. o-synce Cycle Computer Sales (K Units), Revenue (US$, Mn) and Average Price (USD/Unit) & (2020-2025)
Table 97. o-synce Key News & Latest Developments
Table 98. BBB Cycling Company Summary
Table 99. BBB Cycling Cycle Computer Product Offerings
Table 100. BBB Cycling Cycle Computer Sales (K Units), Revenue (US$, Mn) and Average Price (USD/Unit) & (2020-2025)
Table 101. BBB Cycling Key News & Latest Developments
Table 102. Bion Company Summary
Table 103. Bion Cycle Computer Product Offerings
Table 104. Bion Cycle Computer Sales (K Units), Revenue (US$, Mn) and Average Price (USD/Unit) & (2020-2025)
Table 105. Bion Key News & Latest Developments
Table 106. KNOG Company Summary
Table 107. KNOG Cycle Computer Product Offerings
Table 108. KNOG Cycle Computer Sales (K Units), Revenue (US$, Mn) and Average Price (USD/Unit) & (2020-2025)
Table 109. KNOG Key News & Latest Developments
Table 110. Cycle Computer Capacity of Key Manufacturers in Global Market, 2023-2025 (K Units)
Table 111. Global Cycle Computer Capacity Market Share of Key Manufacturers, 2023-2025
Table 112. Global Cycle Computer Production by Region, 2020-2025 (K Units)
Table 113. Global Cycle Computer Production by Region, 2026-2032 (K Units)
Table 114. Cycle Computer Market Opportunities & Trends in Global Market
Table 115. Cycle Computer Market Drivers in Global Market
Table 116. Cycle Computer Market Restraints in Global Market
Table 117. Cycle Computer Raw Materials
Table 118. Cycle Computer Raw Materials Suppliers in Global Market
Table 119. Typical Cycle Computer Downstream
Table 120. Cycle Computer Downstream Clients in Global Market
Table 121. Cycle Computer Distributors and Sales Agents in Global Market

List of Figures
Figure 1. Cycle Computer Product Picture
Figure 2. Cycle Computer Segment by Type in 2024
Figure 3. Cycle Computer Segment by Application in 2024
Figure 4. Global Cycle Computer Market Overview: 2024
Figure 5. Key Caveats
Figure 6. Global Cycle Computer Market Size: 2024 VS 2032 (US$, Mn)
Figure 7. Global Cycle Computer Revenue: 2020-2032 (US$, Mn)
Figure 8. Cycle Computer Sales in Global Market: 2020-2032 (K Units)
Figure 9. The Top 3 and 5 Players Market Share by Cycle Computer Revenue in 2024
Figure 10. Segment by Type – Global Cycle Computer Revenue, (US$, Mn), 2024 & 2032
Figure 11. Segment by Type – Global Cycle Computer Revenue Market Share, 2020-2032
Figure 12. Segment by Type – Global Cycle Computer Sales Market Share, 2020-2032
Figure 13. Segment by Type – Global Cycle Computer Price (USD/Unit), 2020-2032
Figure 14. Segment by Application – Global Cycle Computer Revenue, (US$, Mn), 2024 & 2032
Figure 15. Segment by Application – Global Cycle Computer Revenue Market Share, 2020-2032
Figure 16. Segment by Application – Global Cycle Computer Sales Market Share, 2020-2032
Figure 17. Segment by Application -Global Cycle Computer Price (USD/Unit), 2020-2032
Figure 18. By Region – Global Cycle Computer Revenue, (US$, Mn), 2025 & 2032
Figure 19. By Region – Global Cycle Computer Revenue Market Share, 2020 VS 2024 VS 2032
Figure 20. By Region – Global Cycle Computer Revenue Market Share, 2020-2032
Figure 21. By Region – Global Cycle Computer Sales Market Share, 2020-2032
Figure 22. By Country – North America Cycle Computer Revenue Market Share, 2020-2032
Figure 23. By Country – North America Cycle Computer Sales Market Share, 2020-2032
Figure 24. United States Cycle Computer Revenue, (US$, Mn), 2020-2032
Figure 25. Canada Cycle Computer Revenue, (US$, Mn), 2020-2032
Figure 26. Mexico Cycle Computer Revenue, (US$, Mn), 2020-2032
Figure 27. By Country – Europe Cycle Computer Revenue Market Share, 2020-2032
Figure 28. By Country – Europe Cycle Computer Sales Market Share, 2020-2032
Figure 29. Germany Cycle Computer Revenue, (US$, Mn), 2020-2032
Figure 30. France Cycle Computer Revenue, (US$, Mn), 2020-2032
Figure 31. U.K. Cycle Computer Revenue, (US$, Mn), 2020-2032
Figure 32. Italy Cycle Computer Revenue, (US$, Mn), 2020-2032
Figure 33. Russia Cycle Computer Revenue, (US$, Mn), 2020-2032
Figure 34. Nordic Countries Cycle Computer Revenue, (US$, Mn), 2020-2032
Figure 35. Benelux Cycle Computer Revenue, (US$, Mn), 2020-2032
Figure 36. By Region – Asia Cycle Computer Revenue Market Share, 2020-2032
Figure 37. By Region – Asia Cycle Computer Sales Market Share, 2020-2032
Figure 38. China Cycle Computer Revenue, (US$, Mn), 2020-2032
Figure 39. Japan Cycle Computer Revenue, (US$, Mn), 2020-2032
Figure 40. South Korea Cycle Computer Revenue, (US$, Mn), 2020-2032
Figure 41. Southeast Asia Cycle Computer Revenue, (US$, Mn), 2020-2032
Figure 42. India Cycle Computer Revenue, (US$, Mn), 2020-2032
Figure 43. By Country – South America Cycle Computer Revenue Market Share, 2020-2032
Figure 44. By Country – South America Cycle Computer Sales, Market Share, 2020-2032
Figure 45. Brazil Cycle Computer Revenue, (US$, Mn), 2020-2032
Figure 46. Argentina Cycle Computer Revenue, (US$, Mn), 2020-2032
Figure 47. By Country – Middle East & Africa Cycle Computer Revenue, Market Share, 2020-2032
Figure 48. By Country – Middle East & Africa Cycle Computer Sales, Market Share, 2020-2032
Figure 49. Turkey Cycle Computer Revenue, (US$, Mn), 2020-2032
Figure 50. Israel Cycle Computer Revenue, (US$, Mn), 2020-2032
Figure 51. Saudi Arabia Cycle Computer Revenue, (US$, Mn), 2020-2032
Figure 52. UAE Cycle Computer Revenue, (US$, Mn), 2020-2032
Figure 53. Global Cycle Computer Production Capacity (K Units), 2020-2032
Figure 54. The Percentage of Production Cycle Computer by Region, 2024 VS 2032
Figure 55. Cycle Computer Industry Value Chain
Figure 56. Marketing Channels