
MARKET INSIGHTS
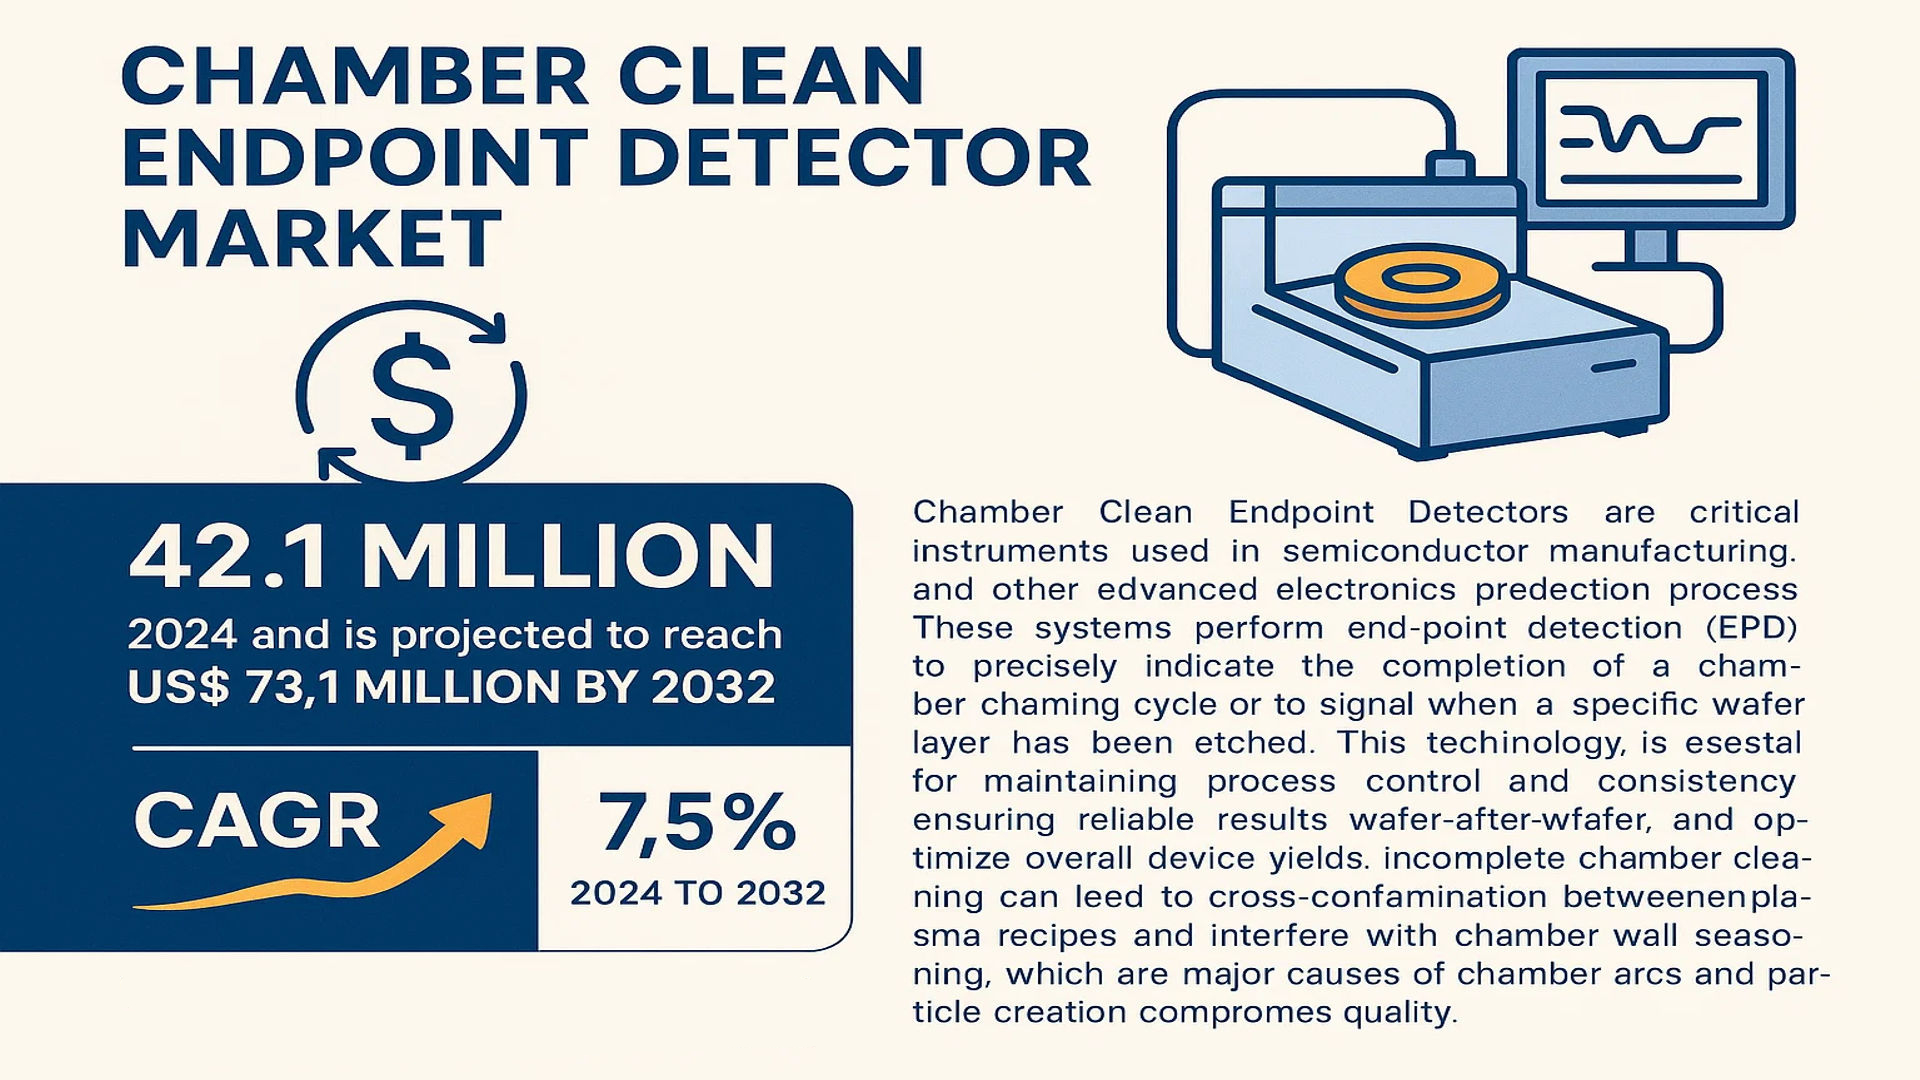
The global Chamber Clean Endpoint Detector Market was valued at 42.1 million in 2024 and is projected to reach US$ 73.1 million by 2032, at a CAGR of 7.5% during the forecast period.
Chamber Clean Endpoint Detectors are critical instruments used in semiconductor manufacturing and other advanced electronics production processes. These systems perform end-point detection (EPD) to precisely indicate the completion of a chamber cleaning cycle or to signal when a specific wafer layer has been etched through. This technology is essential for maintaining process control and consistency, ensuring reliable results wafer-after-wafer, and optimizing overall device yields. Incomplete chamber cleaning can lead to cross-contamination between plasma recipes and interfere with chamber wall seasoning, which are major causes of chamber arcs and particle creation that compromise product quality.
The market is experiencing steady growth driven by the relentless expansion of the global semiconductor industry and the increasing complexity of fabrication processes. The rising adoption of Internet of Things (IoT) devices, 5G technology, and artificial intelligence (AI) chips necessitates more precise manufacturing controls, thereby fueling demand for advanced endpoint detection solutions. Furthermore, the push towards smaller node sizes, such as the transition beyond 7nm and 5nm processes, requires even finer control over etch and deposition steps, making endpoint detectors indispensable. Key players like HORIBA, MKS Instruments, and Inficon are continuously innovating to enhance the accuracy and integration of these systems within larger fabrication tools.
MARKET DYNAMICS
MARKET DRIVERS
Rising Semiconductor Manufacturing Complexity to Drive Adoption of Chamber Clean Endpoint Detectors
The global semiconductor industry is experiencing unprecedented growth due to increasing demand for advanced electronics, IoT devices, and automotive semiconductors. This expansion necessitates more sophisticated manufacturing processes where chamber clean endpoint detectors play a critical role in maintaining process integrity. As semiconductor nodes shrink to 5nm and below, the margin for error diminishes significantly, making precise endpoint detection during chamber cleaning cycles essential for yield optimization. The semiconductor equipment market, valued at over $100 billion globally, continues to invest in advanced monitoring technologies to ensure manufacturing precision. With semiconductor fabrication facilities requiring thousands of chamber clean cycles annually, the demand for reliable endpoint detection systems has become paramount for maintaining production efficiency and minimizing downtime.
Increasing Stringency in Quality Control Requirements to Boost Market Growth
Manufacturing industries worldwide are implementing stricter quality control standards, particularly in semiconductor and photovoltaic production, where even minor contaminants can cause significant product failures. Chamber clean endpoint detectors provide real-time monitoring of cleaning processes, ensuring complete removal of residues and contaminants between production cycles. The global quality management market’s expansion, growing at approximately 9% annually, reflects this increased emphasis on manufacturing excellence. Regulatory requirements in electronics manufacturing have become more rigorous, with international standards now mandating precise process control documentation. This regulatory environment drives adoption of advanced endpoint detection systems that can provide verifiable data on cleaning process completion, ensuring compliance with industry standards and customer specifications.
Growing Adoption of Industry 4.0 and Smart Manufacturing to Fuel Market Expansion
The integration of Industry 4.0 principles in manufacturing facilities worldwide is creating substantial opportunities for chamber clean endpoint detectors. These systems provide critical data for predictive maintenance and process optimization within smart factory environments. Manufacturing facilities implementing IoT technologies report up to 30% reduction in unplanned downtime and 25% improvement in overall equipment effectiveness. Endpoint detectors serve as essential sensors in these connected ecosystems, providing real-time data on chamber conditions and cleaning process effectiveness. The data generated enables machine learning algorithms to optimize cleaning cycles, reduce consumable usage, and predict maintenance requirements, ultimately leading to significant cost savings and improved operational efficiency for manufacturing operations.
Furthermore, the increasing automation in production facilities necessitates reliable monitoring systems that can operate continuously without human intervention, making advanced endpoint detection technologies essential components of modern manufacturing infrastructure.
MARKET RESTRAINTS
High Initial Investment and Integration Costs to Limit Market Penetration
The implementation of advanced chamber clean endpoint detection systems requires substantial capital investment, which can be prohibitive for smaller manufacturing facilities and emerging market players. These systems often involve significant integration costs with existing manufacturing equipment, specialized installation requirements, and comprehensive staff training programs. The total cost of ownership for advanced endpoint detection systems can range from $50,000 to $500,000 per installation depending on system complexity and integration requirements. This financial barrier is particularly challenging in price-sensitive markets and for facilities operating with limited capital expenditure budgets. Additionally, the need for periodic calibration, maintenance, and potential system upgrades adds to the long-term operational costs, making some manufacturers hesitant to adopt these advanced monitoring technologies.
Technical Complexity and Reliability Concerns to Hinder Market Adoption
Chamber clean endpoint detectors operate in extremely challenging environments with high temperatures, corrosive gases, and plasma conditions that can affect sensor performance and longevity. The technical complexity of these systems requires sophisticated engineering to ensure accurate detection across varying process conditions and chamber geometries. Reliability concerns remain significant, as false endpoints or detection failures can lead to substantial production losses, chamber contamination, or even equipment damage. Manufacturers report that approximately 15-20% of chamber-related issues stem from endpoint detection inaccuracies or system failures. This reliability challenge is particularly acute in high-volume production environments where equipment downtime costs can exceed $10,000 per hour, making manufacturers cautious about implementing new detection technologies without proven track records of performance and durability.
Limited Compatibility with Legacy Systems to Restrict Market Growth
Many existing semiconductor and photovoltaic manufacturing facilities operate with equipment that wasn’t designed for integrated endpoint detection systems, creating significant compatibility challenges. Retrofitting older chamber systems with modern endpoint detectors often requires extensive modifications, interface development, and validation testing that can disrupt production schedules. Industry surveys indicate that approximately 40% of manufacturing equipment currently in operation lacks native support for advanced endpoint detection integration. This compatibility gap forces manufacturers to choose between costly equipment upgrades or operating with suboptimal process monitoring capabilities. The gradual pace of equipment replacement in capital-intensive industries means that legacy compatibility issues will continue to restrain market growth for the foreseeable future, particularly in regions with older manufacturing infrastructure.
MARKET CHALLENGES
Rapid Technological Evolution and Obsolescence Risks to Challenge Market Stability
The semiconductor and advanced manufacturing industries experience extremely rapid technological evolution, creating significant challenges for endpoint detector manufacturers. New chamber designs, process materials, and cleaning chemistries emerge frequently, requiring continuous adaptation of detection technologies. The average lifespan of manufacturing equipment is approximately 5-7 years, but endpoint detection systems must remain compatible with both existing and future chamber technologies. This rapid pace of change creates obsolescence risks for detection technologies that cannot adapt to new process requirements. Manufacturers face the challenge of developing systems that are both cutting-edge for current applications and flexible enough to accommodate future process developments without requiring complete replacement.
Other Challenges
Standardization and Interoperability Issues
The lack of industry-wide standards for endpoint detection interfaces and data formats creates significant interoperability challenges. Different equipment manufacturers utilize proprietary communication protocols and data structures, forcing endpoint detector providers to develop multiple integration solutions. This fragmentation increases development costs, complicates installation and maintenance, and limits the ability of manufacturers to implement unified monitoring solutions across their production facilities. The absence of standardized calibration procedures and performance metrics further complicates technology comparison and selection processes for end-users.
Technical Support and Maintenance Demands
Endpoint detection systems require specialized technical support and regular maintenance to ensure optimal performance, creating challenges for both manufacturers and end-users. The global distribution of manufacturing facilities necessitates worldwide support networks capable of providing rapid response to system issues. Maintenance requirements include regular calibration, component replacement, and software updates that must be performed without disrupting production schedules. The shortage of qualified technicians with expertise in both detection technologies and process applications further compounds these support challenges, particularly in emerging manufacturing regions where technical expertise may be limited.
MARKET OPPORTUNITIES
Expansion into Emerging Applications and Industries to Create New Growth Avenues
The chamber clean endpoint detector market is poised for significant expansion into new application areas beyond traditional semiconductor manufacturing. Emerging opportunities include advanced display production, MEMS device fabrication, and compound semiconductor manufacturing, all requiring precise process control. The display industry alone represents a potential market expansion of approximately $2 billion for advanced process monitoring equipment. Additionally, the growing photovoltaic industry, particularly next-generation solar cell manufacturing, requires sophisticated chamber cleaning monitoring to maintain production efficiency and product quality. These expanding applications create substantial opportunities for endpoint detector manufacturers to develop specialized solutions tailored to specific industry requirements and process characteristics.
Integration with Advanced Analytics and AI to Enable Predictive Maintenance Capabilities
The integration of chamber clean endpoint detectors with advanced analytics platforms and artificial intelligence represents a significant opportunity for market growth. These integrated systems can analyze historical endpoint data to predict cleaning process effectiveness, optimize cleaning cycles, and anticipate maintenance requirements. Facilities implementing predictive maintenance solutions report up to 25% reduction in maintenance costs and 70% decrease in equipment failures. The ability to provide data-driven insights beyond basic endpoint detection creates additional value for manufacturers seeking to optimize their operations. This trend toward intelligent monitoring solutions enables endpoint detector providers to transition from equipment suppliers to comprehensive solution partners, offering ongoing value through data analytics and process optimization services.
Development of Multi-Sensor and Hybrid Detection Technologies to Address Complex Applications
Increasing process complexity in advanced manufacturing drives demand for multi-sensor endpoint detection systems that combine multiple detection methodologies for enhanced accuracy and reliability. Hybrid systems incorporating optical emission spectroscopy, interferometry, and mass spectrometry technologies can provide comprehensive monitoring of complex cleaning processes involving multiple materials and chamber geometries. The development of these advanced systems addresses the limitations of single-method detection and provides manufacturers with more robust solutions for challenging applications. This technological evolution creates opportunities for innovation and premium product offerings, particularly in high-value manufacturing segments where process reliability is critical. The ability to provide customized multi-sensor solutions tailored to specific process requirements represents a significant competitive advantage and growth opportunity in the market.
CHAMBER CLEAN ENDPOINT DETECTOR MARKET TRENDS
Increasing Semiconductor Manufacturing Complexity Drives Market Adoption
The relentless push towards smaller process nodes in semiconductor manufacturing, particularly below 7nm, has significantly increased the complexity of chamber cleaning processes and consequently driven demand for sophisticated endpoint detectors. As feature sizes shrink to 3nm and below, even minute residual contaminants can cause catastrophic yield losses, making precise endpoint detection critical for maintaining production efficiency. This trend is particularly pronounced in advanced memory and logic chip fabrication where manufacturers are achieving etch selectivities exceeding 200:1, requiring detection sensitivity down to sub-angstrom levels. The market has responded with systems capable of detecting endpoint signals with signal-to-noise ratios better than 100:1, enabling cleaner transitions between process steps and reducing particle contamination by up to 40% compared to timed cleaning processes. Furthermore, the integration of these detectors with advanced process control systems allows for real-time adjustments, creating a more responsive manufacturing environment that can adapt to subtle process variations.
Other Trends
Optical Emission Spectroscopy Dominance Continues
Optical Emission Spectroscopy (OES) maintains its position as the dominant technology segment, capturing approximately 62% of the global market share due to its proven reliability and cost-effectiveness. The technology’s ability to monitor multiple chemical species simultaneously during chamber cleaning processes provides comprehensive process control that alternative methods struggle to match. Recent advancements in OES systems include the incorporation of high-resolution spectrometers with sampling rates exceeding 100 Hz, enabling detection of subtle endpoint signatures even in highly complex cleaning chemistries involving multiple fluorocarbon compounds. This technological evolution supports the growing requirement for monitoring increasingly sophisticated cleaning processes that utilize exotic gas combinations, where traditional detection methods would be inadequate. The continued refinement of OES algorithms, particularly those incorporating machine learning for pattern recognition, has further enhanced detection accuracy while reducing false endpoint calls.
Expansion into Emerging Semiconductor Manufacturing Hubs
The geographical expansion of semiconductor manufacturing capabilities, particularly throughout Asia-Pacific regions, represents a significant growth vector for chamber clean endpoint detector adoption. Countries including China, Taiwan, and South Korea are collectively investing over $200 billion in new fab construction through 2030, creating substantial demand for advanced process control equipment. This manufacturing capacity expansion coincides with the industry’s transition to more complex 3D NAND and advanced DRAM architectures, which require exceptionally precise chamber cleaning to maintain structural integrity during high-aspect-ratio etching processes. The detectors are becoming increasingly vital in these applications where over-cleaning can damage delicate features while under-cleaning leads to defect propagation. Additionally, the growing photovoltaic manufacturing sector, particularly in China which accounts for approximately 85% of global solar panel production, represents a substantial secondary market where endpoint detection ensures consistent deposition chamber performance and maximizes production yield.
Integration with Industry 4.0 and Predictive Maintenance
The integration of chamber clean endpoint detectors with Industry 4.0 infrastructure represents a transformative trend, enabling predictive maintenance and reducing unplanned downtime. Modern detectors now incorporate advanced data logging capabilities, collecting and analyzing thousands of process parameters to establish baseline performance metrics and identify subtle deviations that indicate impending maintenance requirements. This data-driven approach has demonstrated the potential to reduce preventive maintenance frequency by up to 30% while simultaneously decreasing unscheduled tool downtime by approximately 25%. The implementation of cloud-connected systems allows for remote monitoring and comparison of detector performance across multiple fabrication facilities, creating valuable benchmarking data that helps optimize cleaning processes globally. Furthermore, the correlation of endpoint detection data with subsequent metrology results enables closed-loop process control, where cleaning parameters are automatically adjusted based on actual performance outcomes rather than theoretical models.
COMPETITIVE LANDSCAPE
Key Industry Players
Companies Strive to Strengthen their Product Portfolio to Sustain Competition
The global Chamber Clean Endpoint Detector market exhibits a semi-consolidated competitive structure, characterized by the presence of both established multinational corporations and specialized niche players. This dynamic is driven by the critical nature of endpoint detection in semiconductor manufacturing, where precision and reliability are non-negotiable for maintaining high yields and preventing costly cross-contamination. The market’s valuation at $42.1 million in 2024 underscores its specialized yet essential role within the broader semiconductor equipment ecosystem.
HORIBA and MKS Instruments are recognized as dominant forces, collectively holding a significant portion of the market share. Their leadership is anchored in extensive R&D investments and a deep understanding of plasma process monitoring. HORIBA’s expertise in optical emission spectroscopy (OES) systems, a leading technology segment, provides them with a strong competitive edge in detecting subtle spectral shifts that signal the endpoint of a chamber clean cycle. Similarly, MKS Instruments leverages its broad portfolio of process control and instrumentation solutions to offer integrated endpoint detection systems that are highly valued by major semiconductor fabrication plants (fabs).
While the top players command considerable influence, the market also features agile specialists like Impedans Ltd. and Inficon. These companies compete effectively by focusing on innovative technologies and providing tailored solutions for specific applications, such as advanced memory or logic device manufacturing. Their growth is often fueled by strategic partnerships with equipment manufacturers and a focus on emerging technological needs, such as those required for next-generation etch and deposition processes.
Furthermore, the competitive strategies observed across the board heavily emphasize product innovation and geographic expansion. Companies are actively developing more sensitive and faster-responding detectors to keep pace with the shrinking node sizes and increasingly complex multi-patterning techniques used in modern chip production. The push into high-growth regions, particularly Asia-Pacific where the majority of new fab capacity is being built, is a key strategic initiative for all major players aiming to capitalize on the projected market growth to $73.1 million by 2032.
List of Key Chamber Clean Endpoint Detector Companies Profiled
- HORIBA, Ltd. (Japan)
- MKS Instruments, Inc. (U.S.)
- Impedans Ltd. (Ireland)
- Inficon (Switzerland)
Segment Analysis:
By Type
Optical Emission Spectroscopy (OES) Segment Dominates the Market Due to its High Sensitivity and Real-Time Monitoring Capabilities
The market is segmented based on type into:
- Optical Emission Spectroscopy (OES)
- Interferometry (INT)
- Others
By Application
Semiconductor Segment Leads Due to Critical Need for Process Control and Yield Optimization in Wafer Fabrication
The market is segmented based on application into:
- Semiconductor
- LED
- Photovoltaic
- Others
By Technology
Plasma-Based Cleaning Detection is Prevalent Owing to its Widespread Adoption in Advanced Semiconductor Manufacturing Processes
The market is segmented based on technology into:
- Plasma-Based Cleaning
- Wet Cleaning
- Dry Chemical Cleaning
By End-User
Integrated Device Manufacturers (IDMs) Represent a Key Segment Driven by In-House Production Requirements and Stringent Quality Control
The market is segmented based on end-user into:
- Integrated Device Manufacturers (IDMs)
- Foundries
- Research and Development Institutes
Regional Analysis: Chamber Clean Endpoint Detector Market
Asia-Pacific
The Asia-Pacific region dominates the global Chamber Clean Endpoint Detector market, accounting for the largest revenue share, primarily driven by massive semiconductor manufacturing hubs in China, Taiwan, South Korea, and Japan. This region’s leadership is fueled by substantial investments in semiconductor fabrication plants (fabs) and the presence of major foundries like TSMC and Samsung. The relentless push for miniaturization and higher yields in advanced node technologies (e.g., 3nm and 5nm processes) necessitates precise endpoint detection to prevent cross-contamination and ensure chamber cleanliness. While cost sensitivity remains a factor, the region is increasingly adopting sophisticated Optical Emission Spectroscopy (OES) systems to meet the stringent requirements of next-generation chip manufacturing. Government initiatives, such as China’s push for semiconductor self-sufficiency, further accelerate market growth.
North America
North America represents a significant and technologically advanced market, characterized by high adoption of cutting-edge endpoint detection systems. The presence of leading semiconductor equipment manufacturers and R&D centers, particularly in the United States, drives demand for precision monitoring tools. Strict quality control standards and the need to maximize operational efficiency in high-value semiconductor production are key market drivers. The region benefits from strong intellectual property development and early adoption of Industry 4.0 practices, integrating endpoint detectors with advanced process control systems. However, market growth is somewhat tempered by the gradual shift of volume manufacturing to Asia, though innovation and specialized production maintain robust demand.
Europe
Europe maintains a stable, innovation-driven market for Chamber Clean Endpoint Detectors, supported by a strong research ecosystem and presence of key equipment suppliers. The region’s focus on specialized semiconductor applications, such as power devices, sensors, and automotive chips, requires reliable endpoint detection to ensure process integrity. Environmental regulations and emphasis on sustainable manufacturing practices also influence equipment selection, favoring systems that optimize process efficiency and reduce waste. Collaborative research initiatives, like those under the EU’s Chips Act, aim to bolster regional semiconductor capabilities, which could further stimulate demand for advanced monitoring solutions. However, the market’s growth is moderate compared to Asia-Pacific due to a smaller manufacturing footprint.
South America
The South American market for Chamber Clean Endpoint Detectors is nascent and developing. Limited semiconductor manufacturing infrastructure and economic volatility constrain large-scale investments in advanced process control equipment. Current demand is primarily driven by maintenance and upgrading of existing fabrication lines rather than new greenfield projects. The region shows potential for gradual growth as countries like Brazil seek to develop their technology sectors, but widespread adoption remains hindered by funding challenges and a lack of robust semiconductor industry policies. Most equipment is imported, and cost considerations often lead to the selection of older or refurbished systems.
Middle East & Africa
This region represents an emerging market with limited current adoption of Chamber Clean Endpoint Detectors. Development is concentrated in a few nations investing in technology diversification, such as the UAE and Israel. Israel’s strong high-tech and semiconductor design sector creates some demand for advanced manufacturing tools, though local production capacity is limited. In other parts of the region, the market is virtually undeveloped due to a lack of semiconductor fabrication infrastructure. Long-term growth potential exists if regional initiatives to build technology hubs gain traction, but progress will be slow and dependent on significant foreign investment and expertise transfer.
Report Scope
This market research report provides a comprehensive analysis of the global Chamber Clean Endpoint Detector market, covering the forecast period 2025–2032. It offers detailed insights into market dynamics, technological advancements, competitive landscape, and key trends shaping the industry.
Key focus areas of the report include:
- Market Size & Forecast: Historical data and future projections for revenue, unit shipments, and market value across major regions and segments.
- Segmentation Analysis: Detailed breakdown by product type, technology, application, and end-user industry to identify high-growth segments and investment opportunities.
- Regional Outlook: Insights into market performance across North America, Europe, Asia-Pacific, Latin America, and the Middle East & Africa, including country-level analysis where relevant.
- Competitive Landscape: Profiles of leading market participants, including their product offerings, R&D focus, manufacturing capacity, pricing strategies, and recent developments such as mergers, acquisitions, and partnerships.
- Technology Trends & Innovation: Assessment of emerging technologies, integration of AI/IoT, semiconductor design trends, fabrication techniques, and evolving industry standards.
- Challenges, supply chain constraints, regulatory issues, and market-entry barriers.
- Stakeholder Analysis: Insights for component suppliers, OEMs, system integrators, investors, and policymakers regarding the evolving ecosystem and strategic opportunities.
Primary and secondary research methods are employed, including interviews with industry experts, data from verified sources, and real-time market intelligence to ensure the accuracy and reliability of the insights presented.
FREQUENTLY ASKED QUESTIONS:
What is the current market size of Global Chamber Clean Endpoint Detector Market?
-> Chamber Clean Endpoint Detector Market was valued at 42.1 million in 2024 and is projected to reach US$ 73.1 million by 2032, at a CAGR of 7.5% during the forecast period.
Which key companies operate in Global Chamber Clean Endpoint Detector Market?
-> Key players include HORIBA, MKS Instruments, Impedans Ltd., and Inficon, among others.
What are the key growth drivers?
-> Key growth drivers include increasing semiconductor manufacturing, demand for high device yields, and advanced wafer processing technologies.
Which region dominates the market?
-> Asia-Pacific is the fastest-growing region, while North America remains a dominant market.
What are the emerging trends?
-> Emerging trends include integration of AI for real-time monitoring, advanced spectroscopy techniques, and sustainable chamber cleaning solutions.

Get Sample Report PDF for Exclusive Insights
Report Sample Includes
- Table of Contents
- List of Tables & Figures
- Charts, Research Methodology, and more...







