MARKET INSIGHTS
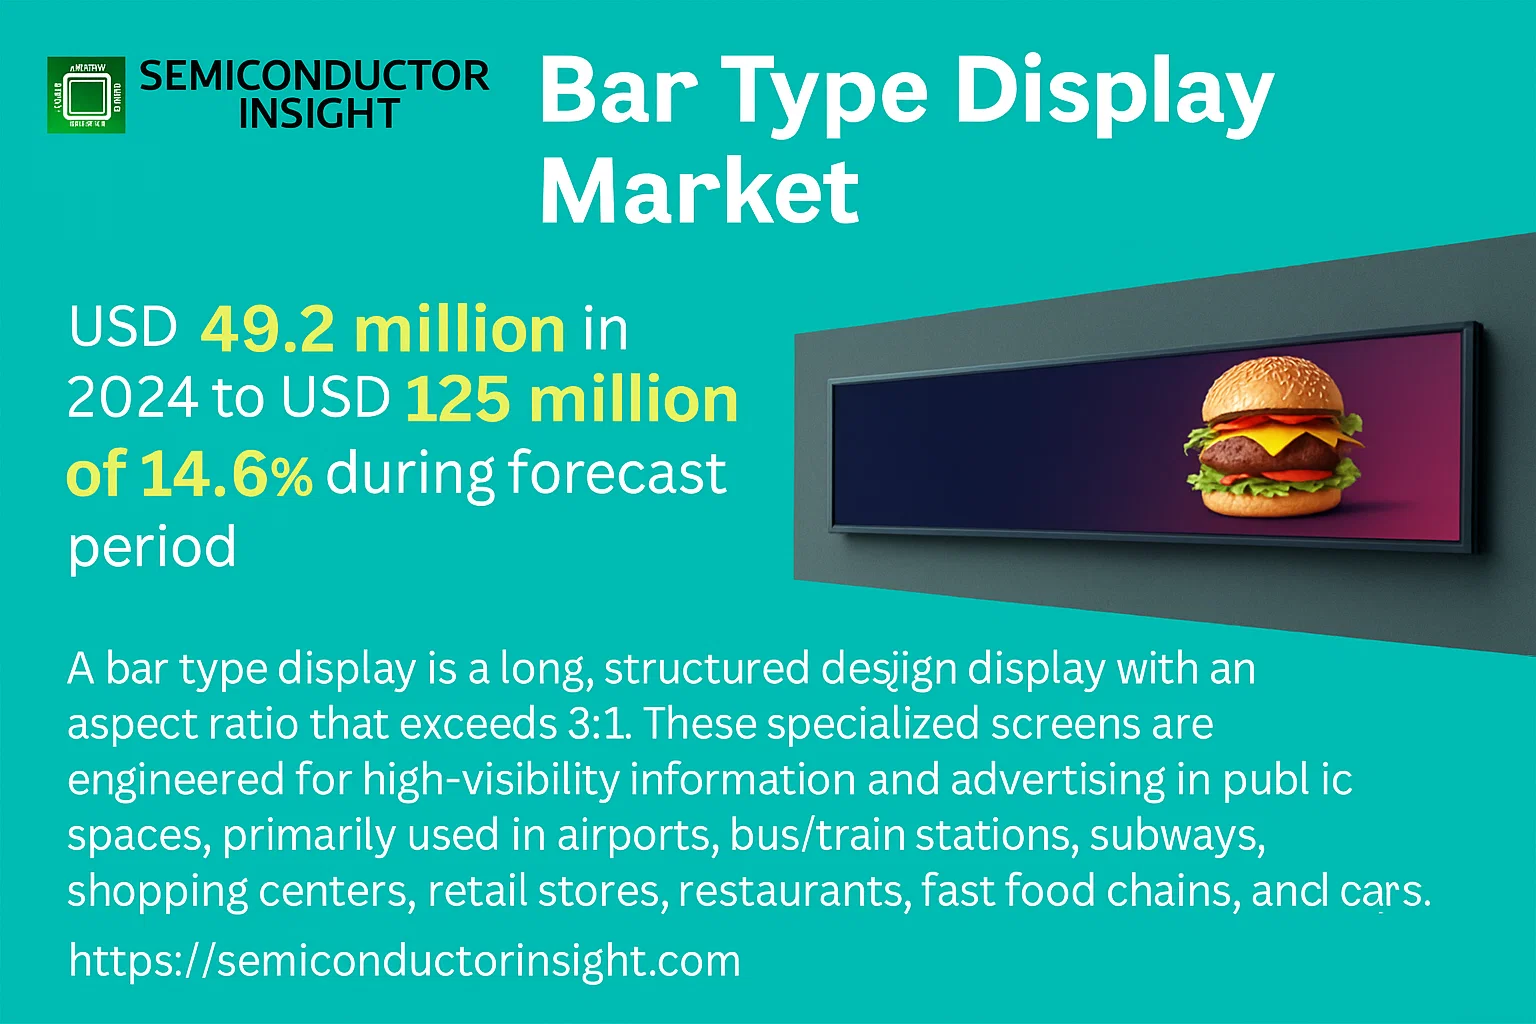
Global Bar Type Display Market size was valued at USD 49.2 million in 2024 to USD 125 million by 2032, exhibiting a CAGR of 14.6% during the forecast period.
A bar type display is a long, structured design display with an aspect ratio that exceeds 3:1. These specialized screens are engineered for high-visibility information and advertising in public spaces, primarily used in airports, bus/train stations, subways, shopping centers, retail stores, restaurants, fast food chains, and bars.
The market is experiencing rapid growth due to several factors, including the rising demand for dynamic digital signage in transportation hubs and the retail sector for effective advertising and passenger information systems. Furthermore, technological advancements in LED and LCD panels that enable these unique form factors are contributing to market expansion. Initiatives by key players in the market are also expected to fuel growth through product innovation and strategic partnerships. For instance, companies like LITEMAX and Winmate continuously develop ruggedized and high-brightness bar displays tailored for harsh environments. LITEMAX, Shenzhen Viewa Technology, BenQ, Winmate, and LG are some of the key players that operate in the market with a wide range of portfolios.
MARKET DRIVERS
Expanding Digitalization of Public and Commercial Spaces
The proliferation of digital signage for advertising, information dissemination, and wayfinding is a primary driver. Bar-type displays are favored for their narrow, space-efficient form factor, ideal for mounting in areas where traditional screens are impractical, such as along pillars, in tight corridors, or as part of sleek architectural designs.
Advancements in Display Technologies
Continuous improvements in LCD and LED panel technology have enhanced the brightness, contrast, and energy efficiency of bar-type displays. This makes them suitable for high-ambient-light environments like retail stores and transportation hubs, ensuring clear visibility and reliability.
The demand for seamless integration into modern interiors is also pushing growth. Manufacturers are offering bezel-less designs and versatile mounting options, making these displays a key component of contemporary visual communication systems.
MARKET CHALLENGES
High Initial Investment and Installation Complexity
The cost of high-brightness, ruggedized bar-type displays and the associated media players and mounting hardware can be prohibitive for small and medium-sized businesses. Custom installations often require professional integration, adding to the total cost of ownership.
Other Challenges
Content Management and Compatibility
Ensuring that content is optimally formatted for the unique aspect ratio of bar-type displays can be a challenge. This requires specialized content management systems and can create additional operational overhead for end-users.
Durability and Maintenance in Harsh Environments
When deployed in public or industrial settings, these displays are subject to dust, moisture, and potential physical impact. Ensuring long-term reliability without frequent maintenance is a persistent challenge for manufacturers.
MARKET RESTRAINTS
Economic Volatility and Budget Constraints
Global economic uncertainties can lead to reduced capital expenditure by businesses and governments. Investments in non-essential digital signage, including bar-type displays, are often deferred during periods of economic downturn, directly impacting market growth.
Competition from Alternative Display Formats
The market faces competition from large-format video walls and standard commercial displays that can sometimes be configured to achieve similar visual effects. The unique value proposition of the dedicated bar-type form factor must be clearly communicated to justify its specific use case.
MARKET OPPORTUNITIES
Rising Adoption in Transportation and Smart Cities
Airports, train stations, and bus terminals are increasingly using bar-type displays for real-time schedule updates, safety messages, and advertising. The expansion of smart city initiatives worldwide presents a significant growth avenue for these specialized displays in public information systems.
Integration with IoT and Interactive Technologies
There is a growing opportunity to integrate bar-type displays with IoT sensors and interactive touch capabilities. This enables dynamic content that responds to environmental data or user interaction, creating more engaging and functional applications in retail and corporate environments.
Advancements in Narrow Bezel and Seamless Tiling
Technological progress is enabling the creation of ultra-narrow bezel bar displays that can be tiled together to form continuous, panoramic screens. This opens up new possibilities for immersive advertising and branding experiences in flagship stores and event venues.
Bar Type Display Market Trends
Sustained High-Growth Trajectory
Global Bar Type Display market is on a strong growth path, with a valuation of USD 49.2 million in 2024. Current projections indicate the market is set to expand to USD 125 million by 2032, achieving a compound annual growth rate of 14.6% over the forecast period. This robust growth is primarily fueled by the increasing demand for high-impact, elongated digital signage solutions across various public and commercial sectors, especially in advertising and transportation hubs.
Other Trends
Market Concentration and Regional Production
The market exhibits a high degree of concentration both in terms of production and manufacturer share. Taiwan (China) is the dominant production hub, accounting for approximately 50% of the global supply, followed closely by China with a 40% share. The competitive landscape is similarly consolidated, with the top five manufacturers—Fin Fun, Mertailor, Sun Tail Mermaid, Dubai Mermaids, and Swimtails—collectively commanding about 60% of the market share, highlighting the mature and competitive nature of the industry.
Segmentation by Size and Application
Market segmentation reveals distinct preferences and growth areas. By type, displays are categorized into sizes of less than 28 inches, 28 to 38 inches, and more than 38 inches, allowing for tailored solutions. In terms of application, the transportation sector (including airports and train stations) and the advertising industry are the primary drivers of demand. These segments leverage the unique, wide-form factor of bar-type displays for effective passenger information systems and high-visibility promotional content.
Competitive Landscape and Global Reach
The competitive environment includes established technology companies such as LITEMAX, Shenzhen Viewa Technology, BenQ, Winmate, and LG, who are key players in driving innovation. The market’s global footprint spans North America, Europe, Asia, South America, and the Middle East & Africa, with Asia leading in both production and consumption. The ongoing expansion of digital infrastructure in public spaces worldwide continues to present significant growth opportunities, although manufacturers face challenges related to supply chain dynamics and the need for continuous technological advancement to meet evolving customer expectations.
COMPETITIVE LANDSCAPE
Key Industry Players
A Market Dominated by Digital Display Specialists and Regional Manufacturing Hubs
Global Bar Type Display market is characterized by a moderately concentrated competitive environment, with the top five manufacturers accounting for a significant combined market share of approximately 60%. The market structure is heavily influenced by regional manufacturing prowess, with Taiwan (China) being the dominant production hub, holding about 50% of the market share, closely followed by China with a 40% share. This manufacturing concentration underscores the importance of supply chain efficiency and cost competitiveness. Leading players leverage their expertise in custom digital display solutions and strong distribution networks to cater to key application sectors such as transportation, advertising, and retail. Competition is primarily based on product innovation, particularly in screen sizes and aspect ratios, durability for public use, pricing, and the ability to provide integrated solutions for digital signage networks.
Beyond the major players, the market includes a range of other significant companies that hold niche positions or serve specific geographic regions. These players often compete by specializing in certain display sizes, such as those less than 28 inches or more than 38 inches, or by focusing on particular applications like high-brightness displays for sunlit advertising spaces or ruggedized units for harsh transportation environments. While the top-tier companies drive technological advancements and set market trends, these other participants contribute to market dynamism by addressing the diverse and specific needs of various end-users, ensuring a wide range of options are available across different price points and performance specifications.
List of Key Bar Type Display Companies Profiled
- LITEMAX
- Shenzhen Viewa Technology
- BenQ
- Winmate
- LG
- Samsung
- NEC Display Solutions
- Sharp
- Panasonic
- Advantech
- Planar Systems (a Leyard company)
- Delta Electronics
- Innodisk
- AOPEN
- Comark
Segment Analysis:
| Segment Category | Sub-Segments | Key Insights |
| By Type |
|
28 Inches ~ 38 Inches displays represent the leading type segment, striking an optimal balance between impactful visual presence and practical installation feasibility. This size range delivers a prominent display area that is highly effective for information dissemination and advertising while remaining versatile enough for integration into diverse architectural spaces and fixtures, making it the preferred choice for a broad range of commercial applications. Manufacturers focus development efforts on this segment to cater to the widest possible customer base. |
| By Application |
|
Transportation is the leading application segment, where bar type displays are essential for dynamic passenger information systems in airports, train stations, and subway networks. Their elongated form factor is ideal for displaying schedules, wayfinding information, and safety alerts in high-traffic environments where horizontal space is optimized for visibility from a distance. The critical need for reliable, real-time information dissemination in transit hubs secures this segment’s dominance, driving demand for durable and high-brightness displays. |
| By End User |
|
Public Infrastructure Operators constitute the leading end-user segment, encompassing entities responsible for managing transportation networks and public venues. These users prioritize operational efficiency and public communication, making bar type displays a core component of their digital signage infrastructure. The demand from this segment is characterized by large-scale, standardized deployments and a strong emphasis on product reliability, longevity, and integration with centralized control systems to ensure seamless information flow. |
| By Product Feature |
|
High Brightness (Outdoor/Sunlight Readable) displays are the leading segment in product features, driven by the extensive use of bar type displays in environments with challenging ambient light conditions. The ability to maintain clear visibility in transportation hubs with large windows or in outdoor advertising locations is a critical purchasing factor. This focus on superior luminance and anti-glare technology reflects the market’s shift towards more versatile and robust display solutions that can perform reliably in a wider range of settings. |
| By Sales Channel |
|
Direct Sales (OEM/System Integrators) is the dominant channel for bar type displays, as these products are often sold as components within larger digital signage or information system solutions. Close collaboration with system integrators and original equipment manufacturers is crucial for tailoring displays to specific project requirements, ensuring compatibility, and providing the necessary technical support for complex installations in public and commercial infrastructures. This channel facilitates long-term partnerships and customized solutions. |
Regional Analysis: Bar Type Display Market
Asia-Pacific’s dominance is anchored in its dense manufacturing and supply chain network for display components. The region offers unparalleled scale and expertise in producing the essential materials, drivers, and assembly for bar type displays. Proximity to raw materials and a skilled technical workforce allows for efficient, large-volume production that supplies global markets. This integrated ecosystem is a critical factor that other regions struggle to replicate, ensuring cost leadership and speed to market for manufacturers operating here.
The region exhibits voracious demand for consumer electronics that extensively utilize bar type displays. This includes a massive market for smartphones, laptops, and smart home devices. The presence of globally recognized brands headquartered in the region fuels a cycle of innovation and consumption. Consumer preference for devices with modern, slim display form factors ensures a consistently high-volume market, driving production and technological upgrades specific to bar type implementations in these products.
Rapid urbanization and infrastructure development across the Asia-Pacific are creating significant opportunities for bar type displays in public and commercial applications. Airports, retail malls, transportation hubs, and corporate offices are increasingly deploying large-format information and advertising displays. Governments and private enterprises are investing heavily in smart city projects, which rely on digital displays for real-time information dissemination, further cementing the region as a key growth market for these specific applications.
The competitive landscape in Asia-Pacific pushes manufacturers to be at the forefront of display technology. There is a strong focus on research and development to improve attributes like brightness, contrast ratio, and power consumption for bar type displays. This drive for innovation ensures the region not only leads in manufacturing volume but also in the development of next-generation products, such as flexible and microLED bar displays, setting trends for the global industry.
North America
North America represents a mature and sophisticated market for bar type displays, characterized by high adoption rates in premium consumer electronics, professional applications, and the automotive sector. The region is a key hub for technology giants and automotive manufacturers who demand high-performance, reliable displays for their products. There is a strong emphasis on quality, advanced features, and integration with sophisticated software systems. The market is driven by replacement cycles in consumer devices and the ongoing trend towards digitalization in retail, healthcare, and enterprise environments. While manufacturing is less concentrated here compared to Asia-Pacific, North America remains a critical market for high-value, innovative display solutions and is often the first market for launching premium products featuring the latest bar type display technologies.
Europe
The European market for bar type displays is defined by stringent regulatory standards, a focus on energy efficiency, and high-quality manufacturing. Demand is robust in the automotive industry, where bar displays are integral to modern dashboards and infotainment systems, and in the industrial sector for control panels and instrumentation. The region also shows strong uptake in retail digital signage and high-end consumer electronics. European manufacturers and brands often emphasize design aesthetics and durability, leading to a market that values premium materials and long product lifecycles. Sustainability directives influence product development, pushing for displays with lower power consumption and environmentally friendly materials, shaping the specific type of bar displays that gain traction in this region.
South America
South America is an emerging market with growing potential for bar type displays, though its development is more gradual compared to other regions. Growth is primarily driven by the expanding middle class and increasing urbanization, which fuels demand for consumer electronics like smartphones and televisions. The commercial sector, including retail and hospitality, is also beginning to adopt digital signage solutions. Market dynamics are influenced by economic fluctuations, but the long-term trend points towards increased digitization. Local assembly operations are growing, though the region still relies significantly on imports for high-tech components, presenting both a challenge and an opportunity for market expansion as local infrastructure develops.
Middle East & Africa
The Middle East & Africa region presents a diverse and evolving landscape for the Bar Type Display Market. The Gulf Cooperation Council (GCC) countries are driving demand through large-scale infrastructure projects, smart city initiatives, and a flourishing retail and hospitality sector, all of which utilize digital displays extensively. In contrast, other parts of the region are at an earlier stage of market development, with growth tied to basic consumer electronics penetration. The market is characterized by a high sensitivity to price points, but there is a clear upward trajectory in adoption as digital transformation efforts gain momentum across the public and private sectors, creating new avenues for bar type display applications.
Report Scope
This market research report provides a comprehensive analysis of the Bar Type Display Market, covering the forecast period 2025–2032. It offers detailed insights into market dynamics, technological advancements, competitive landscape, and key trends shaping the industry.
Key focus areas of the report include:
- Market Overview: The report begins with an overview outlining its current market scenario, key growth indicators, and industry transformation drivers. It discusses macroeconomic factors, demand–supply balance, regulatory landscape, and the strategic role of semiconductors in powering advancements across industries such as automotive, telecommunications, consumer electronics, and industrial automation.
- Market Size & Forecast: Historical data and future projections for revenue, unit shipments, and market value across major regions and segments.
- Segmentation Analysis: Detailed breakdown by product type, technology, application, and end-user industry to identify high-growth segments and investment opportunities.
- Regional Insights: Insights into market performance across North America, Europe, Asia-Pacific, Latin America, and the Middle East & Africa, including country-level analysis where relevant.
- Competitive Landscape: Profiles of leading market participants, including their product offerings, R&D focus, manufacturing capacity, pricing strategies, and recent developments such as mergers, acquisitions, and partnerships.
- Technology Trends & Innovation: Assessment of emerging technologies, integration of AI/IoT, semiconductor design trends, fabrication techniques, and evolving industry standards.
- Market Drivers & Restraints: Evaluation of factors driving market growth along with challenges, supply chain constraints, regulatory issues, and market-entry barriers.
- Stakeholder Insights: Insights for component suppliers, OEMs, system integrators, investors, and policymakers regarding the evolving ecosystem and strategic opportunities.
Primary and secondary research methods are employed, including interviews with industry experts, data from verified sources, and real-time market intelligence to ensure the accuracy and reliability of the insights presented.
FREQUENTLY ASKED QUESTIONS:
What is the current market size of Bar Type Display Market?
-> Bar Type Display Market size was valued at USD 49.2 million in 2024 to USD 125 million by 2032, exhibiting a CAGR of 14.6% during the forecast period.
Which key companies operate in Bar Type Display Market?
-> Key players include LITEMAX, Shenzhen Viewa Technology, BenQ, Winmate, and LG, among others. The top 5 manufacturers, such as Fin Fun, Mertailor, Sun Tail Mermaid, Dubai Mermaids, and Swimtails, held about 60% combined market share.
What are the key growth drivers?
-> Key growth drivers include increasing demand from transportation hubs (airports, bus/train stations, subways) and the advertising sector in shopping centers, retail stores, and restaurants.
Which region dominates the market?
-> Taiwan (China) is the largest producer, with a market share of about 50%, followed by China with 40%.
What are the emerging trends?
-> Emerging trends include the adoption of bar type displays with aspect ratios exceeding 3:1 for enhanced digital signage and information display in public and commercial spaces.

Get Sample Report PDF for Exclusive Insights
Report Sample Includes
- Table of Contents
- List of Tables & Figures
- Charts, Research Methodology, and more...