AR Array Optical Waveguide Market, Trends, Business Strategies 2025-2032

AR Array Optical Waveguide Market was valued at 65.1 million in 2024 and is projected to reach US$ 658 million by 2032, at a CAGR of 40.7% during the forecast period

PDF Icon Download Sample Report PDF
  • Quick Dispatch

    All Orders

  • Secure Payment

    100% Secure Payment

Price range: $1,500.00 through $4,250.00

Clear

MARKET INSIGHTS

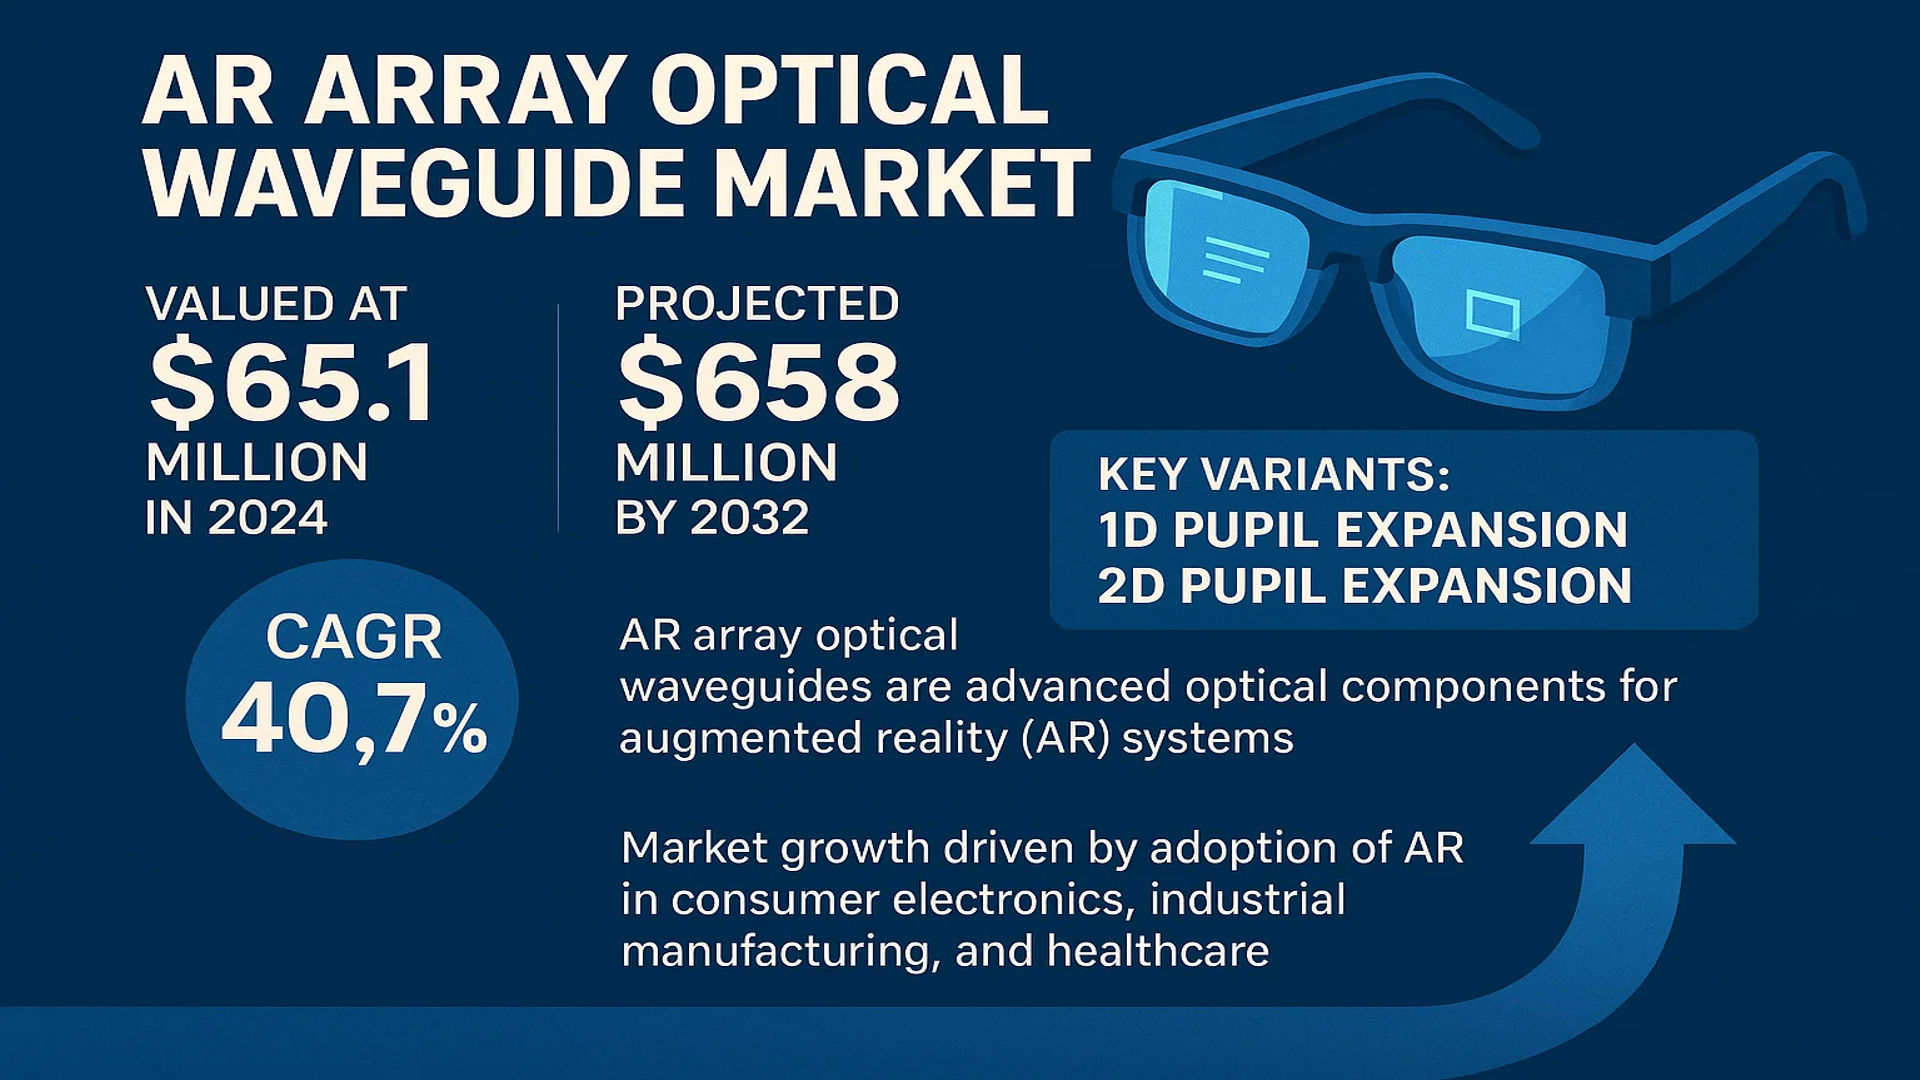
The global AR Array Optical Waveguide Market was valued at 65.1 million in 2024 and is projected to reach US$ 658 million by 2032, at a CAGR of 40.7% during the forecast period.

AR Array Optical Waveguides are advanced optical components designed for augmented reality (AR) systems, facilitating precise light guidance and manipulation. These waveguides serve as a critical technology in AR devices such as smart glasses and head-mounted displays, enabling high-resolution virtual image projection while maintaining real-world visibility through transparent optics. Key variants include 1D Pupil Expansion and 2D Pupil Expansion waveguides, which enhance field-of-view and image clarity.

Market growth is driven by accelerating adoption of AR in consumer electronics, industrial manufacturing, and healthcare applications. While North America leads in technological innovation, Asia-Pacific is witnessing rapid expansion due to increasing investments in AR hardware. Leading manufacturers like Lumus and Optinvent are scaling production capabilities to meet surging demand, with the top five players holding approximately 42% market share in 2024. Recent advancements in waveguide efficiency and miniaturization are further propelling market adoption.

AR Array Optical Waveguide Market

MARKET DYNAMICS

MARKET DRIVERS

Rising Adoption of AR Technologies Across Industries Accelerates Market Growth

The AR array optical waveguide market is experiencing robust growth driven by the widespread adoption of augmented reality technologies across multiple sectors. Global spending on AR technologies is projected to grow at a compound annual rate exceeding 40% through 2032, with consumer electronics and industrial applications leading this expansion. Multiple industries are integrating AR solutions for training, remote assistance, and product visualization, creating sustained demand for optical waveguides as the critical light-guiding component in AR displays. The medical sector’s adoption of AR for surgical navigation and medical training has increased waveguide demand by over 35% in the past three years alone.

Advancements in Display Technologies Propel Next-Generation Waveguide Development

Technological advancements in micro-optics and nanofabrication are enabling significant improvements in waveguide performance metrics. Recent innovations have achieved waveguide efficiencies exceeding 80% compared to just 50-60% in earlier generations, while simultaneously reducing thickness below 2mm. These improvements directly address historical limitations in brightness and form factor that previously constrained AR device adoption. Major manufacturers are investing heavily in R&D, with waveguide-related patents increasing by 28% year-over-year, signaling continued technological evolution. Such advancements are making waveguides more viable for mass-market AR applications.

Growing Consumer Electronics Market Creates Conducive Ecosystem

The consumer electronics sector accounts for over 45% of current waveguide demand, driven by smart glasses and emerging AR wearable devices. With the global consumer AR device market projected to exceed 30 million units annually by 2026, waveguide manufacturers are scaling production capabilities accordingly. The increasing consumer acceptance of wearables, coupled with improving waveguide performance at declining price points, is creating a favorable environment for market expansion. Smart glasses shipments incorporating waveguide displays grew by 120% in the past year, demonstrating this accelerating adoption curve.

MARKET RESTRAINTS

High Manufacturing Costs and Complex Production Processes Limit Market Penetration

Despite growing demand, AR array optical waveguides face significant production challenges that restrain broader market adoption. Current manufacturing requires specialized cleanroom facilities and precision equipment, resulting in production costs that can exceed $150 per square centimeter for high-performance variants. The complex nanolithography and etching processes necessary for creating precise optical structures have yield rates below 60% in many production environments, further increasing effective costs. These economic factors currently limit waveguide implementation to premium AR devices priced above $1,000, constraining mass-market accessibility.

Performance Limitations in Field of View and Efficiency Challenge Adoption

Technical limitations in waveguide performance continue to present obstacles to wider deployment. While recent advancements have improved key metrics, most commercial waveguide solutions still offer limited field of view between 30-50 degrees, well below the 120-degree human binocular vision range. Light efficiency losses through multiple diffractive surfaces remain a persistent challenge, with typical systems losing over 70% of input brightness through the waveguide structure. These technical constraints impact the immersive quality of AR experiences and require continued investment in next-generation waveguide architectures.

Supply Chain Vulnerabilities Impact Production Consistency

The specialized materials and equipment required for waveguide manufacturing create supply chain vulnerabilities that can disrupt production. Key optical materials such as high-index glasses and precision optical coatings face limited global sourcing options, with lead times extending beyond six months for some critical components. The semiconductor-like fabrication equipment needed for mass production represents another bottleneck, with delivery times for new systems exceeding 18 months. These supply chain constraints amplify the challenges of scaling production to meet rapidly growing demand.

MARKET OPPORTUNITIES

Emerging Applications in Automotive and Healthcare Present New Growth Frontiers

The AR waveguide market stands to benefit significantly from emerging applications beyond consumer electronics. Automotive heads-up displays are transitioning from conventional combiner systems to waveguide-based solutions, creating a potential addressable market exceeding 15 million units annually by 2028. In healthcare, AR surgical navigation systems using waveguide displays are demonstrating 30% improvement in procedural accuracy, driving adoption in operating rooms worldwide. These developing applications represent high-value opportunities for waveguide manufacturers to diversify beyond current consumer-focused implementations.

Advancements in Materials Science Enable Next-Generation Waveguide Designs

Breakthroughs in optical materials are opening new possibilities for waveguide performance and manufacturability. The development of high-index polymers with refractive indices above 1.7 enables thinner waveguide structures while maintaining optical performance. Novel holographic material systems allow for integrated waveguide fabrication without complex multi-layer deposition processes. These material innovations are reducing production costs by up to 40% while simultaneously improving optical characteristics, potentially overcoming current market restraints.

Integration with AI and Contextual Computing Creates Value-Added Systems

The convergence of waveguide displays with advanced artificial intelligence creates compelling opportunities for differentiated products. Context-aware AR systems leveraging environmental understanding and user intent prediction can drive more intuitive interactions through waveguide displays. This integration is particularly valuable in enterprise applications, where the combination of AI-powered content generation and waveguide-based visualization can enhance workforce productivity by over 25%. Such value-added capabilities enable waveguide manufacturers to transition from component suppliers to complete solution providers.

MARKET CHALLENGES

Intellectual Property Complexities Hinder Innovation Pace

The AR waveguide market faces significant intellectual property challenges that complicate development efforts. Over 3,000 active patents cover various waveguide technologies, creating a dense patent landscape that requires careful navigation. This IP complexity has led to multiple legal disputes between industry players, diverting resources from product development. Smaller companies in particular face difficulties entering the market due to these IP barriers, potentially limiting innovation diversity in the long term.

Standardization Gaps Create Integration Challenges

The lack of industry-wide standards for waveguide interfaces and performance metrics creates integration challenges for device manufacturers. Current implementations require custom optical engines and display drivers tailored to specific waveguide designs, increasing development costs and time-to-market. This standardization gap becomes particularly problematic as AR systems grow more complex, incorporating multiple waveguide modules for different wavelength bands and field of view requirements.

Consumer Acceptance Barriers Limit Mass Market Potential

Despite technological progress, consumer acceptance remains a persistent challenge for waveguide-based AR devices. Form factor limitations prevent many current implementations from achieving the aesthetic appeal of conventional eyewear, with most smart glasses offering waveguide displays remaining noticeably bulkier than traditional frames. Additionally, concerns about prolonged use effects and social acceptance continue to inhibit broader adoption, requiring both technological and cultural evolution to overcome.

AR ARRAY OPTICAL WAVEGUIDE MARKET TRENDS

Advancements in AR Wearable Technology Driving Market Growth

The AR Array Optical Waveguide market is experiencing rapid expansion due to the growing adoption of augmented reality (AR) in consumer and industrial applications. The global market, valued at $65.1 million in 2024, is projected to reach $658 million by 2032, growing at a compound annual growth rate (CAGR) of 40.7%. This surge is driven by technological advancements, particularly in smart glasses and head-mounted displays, where waveguide technology enables high-resolution virtual overlays without obstructing real-world vision. Companies like Lumus and Optinvent lead innovation with lightweight, high-efficiency waveguides that enhance user experience in gaming, manufacturing, and healthcare.

Other Trends

Expansion into Industrial and Medical Applications

While consumer electronics dominate the AR landscape, industrial and medical sectors are emerging as high-growth areas. Optical waveguides are increasingly integrated into training simulations for manufacturing workers and surgical guidance systems, where precision and real-time data overlay are critical. The medical segment, in particular, is leveraging waveguide-based AR for minimally invasive procedures, with applications projected to grow at a CAGR of over 35% through 2032. Meanwhile, industrial use cases, such as remote equipment maintenance and quality control, are accelerating demand for ruggedized waveguide solutions.

1D vs. 2D Pupil Expansion: A Key Competitive Battleground

The waveguide technology segment is bifurcating between 1D and 2D pupil expansion systems, each with distinct advantages. 1D solutions, which expand light along a single axis, currently hold over 60% market share due to lower production costs and simpler integration. However, 2D waveguides are gaining traction as they enable wider fields of view (FOV) up to 60 degrees—critical for immersive experiences. Manufacturers are investing heavily in nanoimprinting and holographic techniques to reduce the cost gap, with 2D systems expected to grow 3x faster than 1D variants by 2030.

Geographically, Asia-Pacific leads in waveguide production, accounting for 45% of global output in 2024, driven by China’s dominance in consumer electronics manufacturing. However, North America remains the innovation hub, with U.S.-based firms pioneering military and enterprise applications. The market is also witnessing consolidation, as evidenced by recent acquisitions of specialized waveguide startups by major AR platform providers aiming to verticalize their supply chains.

COMPETITIVE LANDSCAPE

Key Industry Players

Innovation and Strategic Partnerships Drive Market Leadership in AR Array Optical Waveguide

The global AR Array Optical Waveguide market is characterized by a mix of established players and emerging innovators, with the top five companies holding a significant revenue share in 2024. Lumus, an Israeli-based technology firm, leads the market with its patented light-guide optical element (LOE) technology, which enables superior image quality in AR devices. Their recent partnership with major electronics manufacturers has further solidified their position as a market leader.

Competing closely, Optinvent, a French AR optics specialist, has gained substantial market traction through its unique folded optics approach. The company’s recent expansion into industrial and medical applications demonstrates how versatile waveguide technology is becoming beyond consumer electronics.

Regional Powerhouses Emerging

Chinese manufacturers are rapidly catching up, with Shanghai Lipai Optical Crystal Technology and Beijing LLVision Technology showing particularly strong growth. These companies benefit from China’s robust manufacturing ecosystem and increasing domestic demand for AR solutions. Shanghai Lipai’s recent breakthrough in mass production techniques has enabled them to reduce costs by approximately 30%, making waveguide technology more accessible.

Meanwhile, in Europe, Optinvent continues to innovate with specialty coatings that enhance optical clarity. The company’s collaboration with automotive AR display developers positions it strongly in the industrial segment, which is expected to grow at 42% CAGR through 2032.

Strategies for Market Expansion

Key players are employing three main strategies to maintain competitiveness. First, vertical integration allows companies like Lumus to control more of the supply chain. Second, technology licensing, as seen with Lohn Optics, helps smaller players access patented innovations. Third, application-specific customization enables firms to serve niche markets like medical imaging more effectively.

Gudong Technology and COSTAR GROUP represent the new wave of Asian manufacturers focusing on cost-efficient production without compromising optical performance. Their ability to deliver at scale makes them preferred suppliers for consumer AR device manufacturers.

List of Key AR Array Optical Waveguide Companies Profiled

  • Lumus (Israel)
  • Optinvent (France)
  • Shanghai Lipai Optical Crystal Technology (China)
  • Lohn Optics (U.S.)
  • LINGXI (China)
  • Beijing LLVision Technology (China)
  • Hangzhou Lili Information Technology (China)
  • Gudong Technology (China)
  • OPTIX (Japan)
  • Beijing Nai Dejia Display Technology (China)
  • COSTAR GROUP (China)
  • GodView (China)

Segment Analysis:

By Type

2D Pupil Expansion Segment Leads Due to Superior Image Quality in AR Displays

The market is segmented based on type into:

  • 1D Pupil Expansion
  • 2D Pupil Expansion

By Application

Consumer Electronics Segment Dominates with High Demand for AR Smart Glasses

The market is segmented based on application into:

  • Consumer Electronics
  • Industrial Manufacturing
  • Advanced Medical
  • Others

By End User

Enterprise Segment Expands Rapidly with Adoption in Industrial Applications

The market is segmented based on end user into:

  • Enterprise
  • Consumer

By Material

Glass Substrate Remains Preferred Choice for Optical Clarity and Durability

The market is segmented based on material into:

  • Glass
  • Polymer
  • Others

Regional Analysis: AR Array Optical Waveguide Market

Asia-Pacific
The Asia-Pacific region currently leads the global AR Array Optical Waveguide market, driven by robust manufacturing capabilities and rapid technological adoption in countries like China, Japan, and South Korea. Major players such as Shanghai Lipai Optical Crystal Technology, LINGXI, and Hangzhou Lili Information Technology dominate regional production, leveraging established supply chains and government support for AR/VR development. China’s push for indigenous optical technology innovation, coupled with heavy investment in AR applications across consumer electronics and industrial sectors, accelerates market growth. While 2D Pupil Expansion waveguide technology sees higher adoption in premium AR devices, cost-conscious markets show preference for 1D solutions.

North America
North America remains a high-value market with strong R&D focus, where companies like Lumus and Optinvent pioneer advanced waveguide solutions. The region benefits from defense sector demand (e.g., military HUD applications) and enterprise AR adoption in logistics and healthcare. Strict IP protection enables premium pricing strategies, though competition from Asian manufacturers pressures margins. Recent partnerships between waveguide producers and tech giants signal growing integration into next-gen AR glasses. The U.S. accounts for over 70% of regional demand, with Canadian and Mexican markets evolving through niche medical and automotive applications.

Europe
European growth stems from precision manufacturing expertise, particularly in Germany (Lohn Optics) and France, where waveguide technologies align with Industry 4.0 initiatives. Stringent quality standards create barriers for foreign entrants but foster specialized applications in aerospace and luxury automotive AR displays. EU-funded projects on photonics and lightweight optics further stimulate innovation. While adoption lags behind Asia in volume, European manufacturers lead in customized industrial waveguide solutions with higher durability and optical precision. The UK and Nordic countries show particular strength in research collaborations bridging academia and industry.

South America
This emerging market demonstrates uneven adoption, with Brazil and Argentina accounting for nearly 80% of regional waveguide demand through medical imaging and mining sector applications. Infrastructure limitations and import dependency constrain mass-market AR device penetration, favoring industrial over consumer applications. Local assembly of foreign waveguide components is increasing, particularly for automotive HUD systems. However, economic volatility and limited local R&D investment hinder technological parity with global leaders. Strategic partnerships with Asian suppliers aim to improve cost competitiveness in basic waveguide implementations.

Middle East & Africa
The MEA market shows high growth potential but remains hampered by fragmented infrastructure and nascent AR ecosystems. Gulf nations lead through smart city initiatives incorporating waveguide-based AR for tourism and urban planning. GodView and regional players are establishing local waveguide production with Asian technical collaborations. South Africa emerges as a hub for medical AR applications, leveraging waveguide tech in surgical visualization systems. While current volumes remain low compared to global standards, increasing FDI in tech sectors and government digital transformation agendas signal long-term opportunity for waveguide integration across key verticals.

Report Scope

This market research report provides a comprehensive analysis of the Global AR Array Optical Waveguide market, covering the forecast period 2024–2032. It offers detailed insights into market dynamics, technological advancements, competitive landscape, and key trends shaping the industry.

Key focus areas of the report include:

  • Market Size & Forecast: Historical data and future projections for revenue, unit shipments, and market value across major regions and segments. The Global AR Array Optical Waveguide market was valued at USD 65.1 million in 2024 and is projected to reach USD 658 million by 2032, at a CAGR of 40.7% during the forecast period.
  • Segmentation Analysis: Detailed breakdown by product type (1D Pupil Expansion, 2D Pupil Expansion) and application (Consumer Electronics, Industrial Manufacturing, Advanced Medical, Others) to identify high-growth segments and investment opportunities.
  • Regional Outlook: Insights into market performance across North America, Europe, Asia-Pacific, Latin America, and the Middle East & Africa. The U.S. market size is estimated at USD million in 2024, while China is expected to reach USD million.
  • Competitive Landscape: Profiles of leading market participants including Lumus, Optinvent, Shanghai Lipai Optical Crystal Technology, Lohn Optics, LINGXI, and others, covering their product offerings, R&D focus, and recent developments.
  • Technology Trends & Innovation: Assessment of emerging AR waveguide technologies, integration with AI/ML, and advancements in optical materials.
  • Market Drivers & Restraints: Evaluation of factors driving market growth along with challenges such as manufacturing complexity and high production costs.
  • Stakeholder Analysis: Insights for component suppliers, AR device manufacturers, investors, and policymakers regarding the evolving ecosystem and strategic opportunities.

Primary and secondary research methods are employed, including interviews with industry experts and data from verified sources, to ensure the accuracy and reliability of the insights presented.

FREQUENTLY ASKED QUESTIONS:

What is the current market size of Global AR Array Optical Waveguide Market?

-> AR Array Optical Waveguide Market was valued at 65.1 million in 2024 and is projected to reach US$ 658 million by 2032, at a CAGR of 40.7% during the forecast period.

Which key companies operate in Global AR Array Optical Waveguide Market?

-> Key players include Lumus, Optinvent, Shanghai Lipai Optical Crystal Technology, Lohn Optics, LINGXI, Beijing LLVision Technology, and Hangzhou Lili Information Technology, among others.

What are the key growth drivers?

-> Key growth drivers include rising adoption of AR devices, advancements in waveguide technology, and increasing applications in consumer electronics and industrial sectors.

Which region dominates the market?

-> Asia-Pacific is the fastest-growing region, particularly China, while North America maintains technological leadership in waveguide development.

What are the emerging trends?

-> Emerging trends include development of ultra-thin waveguides, integration with 5G networks, and application-specific waveguide solutions for enterprise and medical use cases.

AR Array Optical Waveguide Market, Trends, Business Strategies 2025-2032

Get Sample Report PDF for Exclusive Insights

Report Sample Includes

  • Table of Contents
  • List of Tables & Figures
  • Charts, Research Methodology, and more...
PDF Icon Download Sample Report PDF

Download Sample Report

Table of Content

1 Introduction to Research & Analysis Reports
1.1 AR Array Optical Waveguide Market Definition
1.2 Market Segments
1.2.1 Segment by Type
1.2.2 Segment by Application
1.3 Global AR Array Optical Waveguide Market Overview
1.4 Features & Benefits of This Report
1.5 Methodology & Sources of Information
1.5.1 Research Methodology
1.5.2 Research Process
1.5.3 Base Year
1.5.4 Report Assumptions & Caveats
2 Global AR Array Optical Waveguide Overall Market Size
2.1 Global AR Array Optical Waveguide Market Size: 2024 VS 2032
2.2 Global AR Array Optical Waveguide Market Size, Prospects & Forecasts: 2020-2032
2.3 Global AR Array Optical Waveguide Sales: 2020-2032
3 Company Landscape
3.1 Top AR Array Optical Waveguide Players in Global Market
3.2 Top Global AR Array Optical Waveguide Companies Ranked by Revenue
3.3 Global AR Array Optical Waveguide Revenue by Companies
3.4 Global AR Array Optical Waveguide Sales by Companies
3.5 Global AR Array Optical Waveguide Price by Manufacturer (2020-2025)
3.6 Top 3 and Top 5 AR Array Optical Waveguide Companies in Global Market, by Revenue in 2024
3.7 Global Manufacturers AR Array Optical Waveguide Product Type
3.8 Tier 1, Tier 2, and Tier 3 AR Array Optical Waveguide Players in Global Market
3.8.1 List of Global Tier 1 AR Array Optical Waveguide Companies
3.8.2 List of Global Tier 2 and Tier 3 AR Array Optical Waveguide Companies
4 Sights by Product
4.1 Overview
4.1.1 Segment by Type – Global AR Array Optical Waveguide Market Size Markets, 2024 & 2032
4.1.2 1D Pupil Expansion
4.1.3 2D Pupil Expansion
4.2 Segment by Type – Global AR Array Optical Waveguide Revenue & Forecasts
4.2.1 Segment by Type – Global AR Array Optical Waveguide Revenue, 2020-2025
4.2.2 Segment by Type – Global AR Array Optical Waveguide Revenue, 2026-2032
4.2.3 Segment by Type – Global AR Array Optical Waveguide Revenue Market Share, 2020-2032
4.3 Segment by Type – Global AR Array Optical Waveguide Sales & Forecasts
4.3.1 Segment by Type – Global AR Array Optical Waveguide Sales, 2020-2025
4.3.2 Segment by Type – Global AR Array Optical Waveguide Sales, 2026-2032
4.3.3 Segment by Type – Global AR Array Optical Waveguide Sales Market Share, 2020-2032
4.4 Segment by Type – Global AR Array Optical Waveguide Price (Manufacturers Selling Prices), 2020-2032
5 Sights by Application
5.1 Overview
5.1.1 Segment by Application – Global AR Array Optical Waveguide Market Size, 2024 & 2032
5.1.2 Consumer Electronics
5.1.3 Industrial Manufacturing
5.1.4 Advanced Medical
5.1.5 Others
5.2 Segment by Application – Global AR Array Optical Waveguide Revenue & Forecasts
5.2.1 Segment by Application – Global AR Array Optical Waveguide Revenue, 2020-2025
5.2.2 Segment by Application – Global AR Array Optical Waveguide Revenue, 2026-2032
5.2.3 Segment by Application – Global AR Array Optical Waveguide Revenue Market Share, 2020-2032
5.3 Segment by Application – Global AR Array Optical Waveguide Sales & Forecasts
5.3.1 Segment by Application – Global AR Array Optical Waveguide Sales, 2020-2025
5.3.2 Segment by Application – Global AR Array Optical Waveguide Sales, 2026-2032
5.3.3 Segment by Application – Global AR Array Optical Waveguide Sales Market Share, 2020-2032
5.4 Segment by Application – Global AR Array Optical Waveguide Price (Manufacturers Selling Prices), 2020-2032
6 Sights by Region
6.1 By Region – Global AR Array Optical Waveguide Market Size, 2024 & 2032
6.2 By Region – Global AR Array Optical Waveguide Revenue & Forecasts
6.2.1 By Region – Global AR Array Optical Waveguide Revenue, 2020-2025
6.2.2 By Region – Global AR Array Optical Waveguide Revenue, 2026-2032
6.2.3 By Region – Global AR Array Optical Waveguide Revenue Market Share, 2020-2032
6.3 By Region – Global AR Array Optical Waveguide Sales & Forecasts
6.3.1 By Region – Global AR Array Optical Waveguide Sales, 2020-2025
6.3.2 By Region – Global AR Array Optical Waveguide Sales, 2026-2032
6.3.3 By Region – Global AR Array Optical Waveguide Sales Market Share, 2020-2032
6.4 North America
6.4.1 By Country – North America AR Array Optical Waveguide Revenue, 2020-2032
6.4.2 By Country – North America AR Array Optical Waveguide Sales, 2020-2032
6.4.3 United States AR Array Optical Waveguide Market Size, 2020-2032
6.4.4 Canada AR Array Optical Waveguide Market Size, 2020-2032
6.4.5 Mexico AR Array Optical Waveguide Market Size, 2020-2032
6.5 Europe
6.5.1 By Country – Europe AR Array Optical Waveguide Revenue, 2020-2032
6.5.2 By Country – Europe AR Array Optical Waveguide Sales, 2020-2032
6.5.3 Germany AR Array Optical Waveguide Market Size, 2020-2032
6.5.4 France AR Array Optical Waveguide Market Size, 2020-2032
6.5.5 U.K. AR Array Optical Waveguide Market Size, 2020-2032
6.5.6 Italy AR Array Optical Waveguide Market Size, 2020-2032
6.5.7 Russia AR Array Optical Waveguide Market Size, 2020-2032
6.5.8 Nordic Countries AR Array Optical Waveguide Market Size, 2020-2032
6.5.9 Benelux AR Array Optical Waveguide Market Size, 2020-2032
6.6 Asia
6.6.1 By Region – Asia AR Array Optical Waveguide Revenue, 2020-2032
6.6.2 By Region – Asia AR Array Optical Waveguide Sales, 2020-2032
6.6.3 China AR Array Optical Waveguide Market Size, 2020-2032
6.6.4 Japan AR Array Optical Waveguide Market Size, 2020-2032
6.6.5 South Korea AR Array Optical Waveguide Market Size, 2020-2032
6.6.6 Southeast Asia AR Array Optical Waveguide Market Size, 2020-2032
6.6.7 India AR Array Optical Waveguide Market Size, 2020-2032
6.7 South America
6.7.1 By Country – South America AR Array Optical Waveguide Revenue, 2020-2032
6.7.2 By Country – South America AR Array Optical Waveguide Sales, 2020-2032
6.7.3 Brazil AR Array Optical Waveguide Market Size, 2020-2032
6.7.4 Argentina AR Array Optical Waveguide Market Size, 2020-2032
6.8 Middle East & Africa
6.8.1 By Country – Middle East & Africa AR Array Optical Waveguide Revenue, 2020-2032
6.8.2 By Country – Middle East & Africa AR Array Optical Waveguide Sales, 2020-2032
6.8.3 Turkey AR Array Optical Waveguide Market Size, 2020-2032
6.8.4 Israel AR Array Optical Waveguide Market Size, 2020-2032
6.8.5 Saudi Arabia AR Array Optical Waveguide Market Size, 2020-2032
6.8.6 UAE AR Array Optical Waveguide Market Size, 2020-2032
7 Manufacturers & Brands Profiles
7.1 Lumus
7.1.1 Lumus Company Summary
7.1.2 Lumus Business Overview
7.1.3 Lumus AR Array Optical Waveguide Major Product Offerings
7.1.4 Lumus AR Array Optical Waveguide Sales and Revenue in Global (2020-2025)
7.1.5 Lumus Key News & Latest Developments
7.2 Optinvent
7.2.1 Optinvent Company Summary
7.2.2 Optinvent Business Overview
7.2.3 Optinvent AR Array Optical Waveguide Major Product Offerings
7.2.4 Optinvent AR Array Optical Waveguide Sales and Revenue in Global (2020-2025)
7.2.5 Optinvent Key News & Latest Developments
7.3 Shanghai Lipai Optical Crystal Technology
7.3.1 Shanghai Lipai Optical Crystal Technology Company Summary
7.3.2 Shanghai Lipai Optical Crystal Technology Business Overview
7.3.3 Shanghai Lipai Optical Crystal Technology AR Array Optical Waveguide Major Product Offerings
7.3.4 Shanghai Lipai Optical Crystal Technology AR Array Optical Waveguide Sales and Revenue in Global (2020-2025)
7.3.5 Shanghai Lipai Optical Crystal Technology Key News & Latest Developments
7.4 Lohn Optics
7.4.1 Lohn Optics Company Summary
7.4.2 Lohn Optics Business Overview
7.4.3 Lohn Optics AR Array Optical Waveguide Major Product Offerings
7.4.4 Lohn Optics AR Array Optical Waveguide Sales and Revenue in Global (2020-2025)
7.4.5 Lohn Optics Key News & Latest Developments
7.5 LINGXI
7.5.1 LINGXI Company Summary
7.5.2 LINGXI Business Overview
7.5.3 LINGXI AR Array Optical Waveguide Major Product Offerings
7.5.4 LINGXI AR Array Optical Waveguide Sales and Revenue in Global (2020-2025)
7.5.5 LINGXI Key News & Latest Developments
7.6 Beijing LLVision Technology
7.6.1 Beijing LLVision Technology Company Summary
7.6.2 Beijing LLVision Technology Business Overview
7.6.3 Beijing LLVision Technology AR Array Optical Waveguide Major Product Offerings
7.6.4 Beijing LLVision Technology AR Array Optical Waveguide Sales and Revenue in Global (2020-2025)
7.6.5 Beijing LLVision Technology Key News & Latest Developments
7.7 Hangzhou Lili Information Technology
7.7.1 Hangzhou Lili Information Technology Company Summary
7.7.2 Hangzhou Lili Information Technology Business Overview
7.7.3 Hangzhou Lili Information Technology AR Array Optical Waveguide Major Product Offerings
7.7.4 Hangzhou Lili Information Technology AR Array Optical Waveguide Sales and Revenue in Global (2020-2025)
7.7.5 Hangzhou Lili Information Technology Key News & Latest Developments
7.8 Gudong Technology
7.8.1 Gudong Technology Company Summary
7.8.2 Gudong Technology Business Overview
7.8.3 Gudong Technology AR Array Optical Waveguide Major Product Offerings
7.8.4 Gudong Technology AR Array Optical Waveguide Sales and Revenue in Global (2020-2025)
7.8.5 Gudong Technology Key News & Latest Developments
7.9 OPTIX
7.9.1 OPTIX Company Summary
7.9.2 OPTIX Business Overview
7.9.3 OPTIX AR Array Optical Waveguide Major Product Offerings
7.9.4 OPTIX AR Array Optical Waveguide Sales and Revenue in Global (2020-2025)
7.9.5 OPTIX Key News & Latest Developments
7.10 Beijing Nai Dejia Display Technology
7.10.1 Beijing Nai Dejia Display Technology Company Summary
7.10.2 Beijing Nai Dejia Display Technology Business Overview
7.10.3 Beijing Nai Dejia Display Technology AR Array Optical Waveguide Major Product Offerings
7.10.4 Beijing Nai Dejia Display Technology AR Array Optical Waveguide Sales and Revenue in Global (2020-2025)
7.10.5 Beijing Nai Dejia Display Technology Key News & Latest Developments
7.11 COSTAR GROUP
7.11.1 COSTAR GROUP Company Summary
7.11.2 COSTAR GROUP Business Overview
7.11.3 COSTAR GROUP AR Array Optical Waveguide Major Product Offerings
7.11.4 COSTAR GROUP AR Array Optical Waveguide Sales and Revenue in Global (2020-2025)
7.11.5 COSTAR GROUP Key News & Latest Developments
7.12 GodView
7.12.1 GodView Company Summary
7.12.2 GodView Business Overview
7.12.3 GodView AR Array Optical Waveguide Major Product Offerings
7.12.4 GodView AR Array Optical Waveguide Sales and Revenue in Global (2020-2025)
7.12.5 GodView Key News & Latest Developments
8 Global AR Array Optical Waveguide Production Capacity, Analysis
8.1 Global AR Array Optical Waveguide Production Capacity, 2020-2032
8.2 AR Array Optical Waveguide Production Capacity of Key Manufacturers in Global Market
8.3 Global AR Array Optical Waveguide Production by Region
9 Key Market Trends, Opportunity, Drivers and Restraints
9.1 Market Opportunities & Trends
9.2 Market Drivers
9.3 Market Restraints
10 AR Array Optical Waveguide Supply Chain Analysis
10.1 AR Array Optical Waveguide Industry Value Chain
10.2 AR Array Optical Waveguide Upstream Market
10.3 AR Array Optical Waveguide Downstream and Clients
10.4 Marketing Channels Analysis
10.4.1 Marketing Channels
10.4.2 AR Array Optical Waveguide Distributors and Sales Agents in Global
11 Conclusion
12 Appendix
12.1 Note
12.2 Examples of Clients
12.3 DisclaimerList of Tables
Table 1. Key Players of AR Array Optical Waveguide in Global Market
Table 2. Top AR Array Optical Waveguide Players in Global Market, Ranking by Revenue (2024)
Table 3. Global AR Array Optical Waveguide Revenue by Companies, (US$, Mn), 2020-2025
Table 4. Global AR Array Optical Waveguide Revenue Share by Companies, 2020-2025
Table 5. Global AR Array Optical Waveguide Sales by Companies, (K Units), 2020-2025
Table 6. Global AR Array Optical Waveguide Sales Share by Companies, 2020-2025
Table 7. Key Manufacturers AR Array Optical Waveguide Price (2020-2025) & (US$/Unit)
Table 8. Global Manufacturers AR Array Optical Waveguide Product Type
Table 9. List of Global Tier 1 AR Array Optical Waveguide Companies, Revenue (US$, Mn) in 2024 and Market Share
Table 10. List of Global Tier 2 and Tier 3 AR Array Optical Waveguide Companies, Revenue (US$, Mn) in 2024 and Market Share
Table 11. Segment by Type – Global AR Array Optical Waveguide Revenue, (US$, Mn), 2024 & 2032
Table 12. Segment by Type – Global AR Array Optical Waveguide Revenue (US$, Mn), 2020-2025
Table 13. Segment by Type – Global AR Array Optical Waveguide Revenue (US$, Mn), 2026-2032
Table 14. Segment by Type – Global AR Array Optical Waveguide Sales (K Units), 2020-2025
Table 15. Segment by Type – Global AR Array Optical Waveguide Sales (K Units), 2026-2032
Table 16. Segment by Application – Global AR Array Optical Waveguide Revenue, (US$, Mn), 2024 & 2032
Table 17. Segment by Application – Global AR Array Optical Waveguide Revenue, (US$, Mn), 2020-2025
Table 18. Segment by Application – Global AR Array Optical Waveguide Revenue, (US$, Mn), 2026-2032
Table 19. Segment by Application – Global AR Array Optical Waveguide Sales, (K Units), 2020-2025
Table 20. Segment by Application – Global AR Array Optical Waveguide Sales, (K Units), 2026-2032
Table 21. By Region – Global AR Array Optical Waveguide Revenue, (US$, Mn), 2025-2032
Table 22. By Region – Global AR Array Optical Waveguide Revenue, (US$, Mn), 2020-2025
Table 23. By Region – Global AR Array Optical Waveguide Revenue, (US$, Mn), 2026-2032
Table 24. By Region – Global AR Array Optical Waveguide Sales, (K Units), 2020-2025
Table 25. By Region – Global AR Array Optical Waveguide Sales, (K Units), 2026-2032
Table 26. By Country – North America AR Array Optical Waveguide Revenue, (US$, Mn), 2020-2025
Table 27. By Country – North America AR Array Optical Waveguide Revenue, (US$, Mn), 2026-2032
Table 28. By Country – North America AR Array Optical Waveguide Sales, (K Units), 2020-2025
Table 29. By Country – North America AR Array Optical Waveguide Sales, (K Units), 2026-2032
Table 30. By Country – Europe AR Array Optical Waveguide Revenue, (US$, Mn), 2020-2025
Table 31. By Country – Europe AR Array Optical Waveguide Revenue, (US$, Mn), 2026-2032
Table 32. By Country – Europe AR Array Optical Waveguide Sales, (K Units), 2020-2025
Table 33. By Country – Europe AR Array Optical Waveguide Sales, (K Units), 2026-2032
Table 34. By Region – Asia AR Array Optical Waveguide Revenue, (US$, Mn), 2020-2025
Table 35. By Region – Asia AR Array Optical Waveguide Revenue, (US$, Mn), 2026-2032
Table 36. By Region – Asia AR Array Optical Waveguide Sales, (K Units), 2020-2025
Table 37. By Region – Asia AR Array Optical Waveguide Sales, (K Units), 2026-2032
Table 38. By Country – South America AR Array Optical Waveguide Revenue, (US$, Mn), 2020-2025
Table 39. By Country – South America AR Array Optical Waveguide Revenue, (US$, Mn), 2026-2032
Table 40. By Country – South America AR Array Optical Waveguide Sales, (K Units), 2020-2025
Table 41. By Country – South America AR Array Optical Waveguide Sales, (K Units), 2026-2032
Table 42. By Country – Middle East & Africa AR Array Optical Waveguide Revenue, (US$, Mn), 2020-2025
Table 43. By Country – Middle East & Africa AR Array Optical Waveguide Revenue, (US$, Mn), 2026-2032
Table 44. By Country – Middle East & Africa AR Array Optical Waveguide Sales, (K Units), 2020-2025
Table 45. By Country – Middle East & Africa AR Array Optical Waveguide Sales, (K Units), 2026-2032
Table 46. Lumus Company Summary
Table 47. Lumus AR Array Optical Waveguide Product Offerings
Table 48. Lumus AR Array Optical Waveguide Sales (K Units), Revenue (US$, Mn) and Average Price (US$/Unit) & (2020-2025)
Table 49. Lumus Key News & Latest Developments
Table 50. Optinvent Company Summary
Table 51. Optinvent AR Array Optical Waveguide Product Offerings
Table 52. Optinvent AR Array Optical Waveguide Sales (K Units), Revenue (US$, Mn) and Average Price (US$/Unit) & (2020-2025)
Table 53. Optinvent Key News & Latest Developments
Table 54. Shanghai Lipai Optical Crystal Technology Company Summary
Table 55. Shanghai Lipai Optical Crystal Technology AR Array Optical Waveguide Product Offerings
Table 56. Shanghai Lipai Optical Crystal Technology AR Array Optical Waveguide Sales (K Units), Revenue (US$, Mn) and Average Price (US$/Unit) & (2020-2025)
Table 57. Shanghai Lipai Optical Crystal Technology Key News & Latest Developments
Table 58. Lohn Optics Company Summary
Table 59. Lohn Optics AR Array Optical Waveguide Product Offerings
Table 60. Lohn Optics AR Array Optical Waveguide Sales (K Units), Revenue (US$, Mn) and Average Price (US$/Unit) & (2020-2025)
Table 61. Lohn Optics Key News & Latest Developments
Table 62. LINGXI Company Summary
Table 63. LINGXI AR Array Optical Waveguide Product Offerings
Table 64. LINGXI AR Array Optical Waveguide Sales (K Units), Revenue (US$, Mn) and Average Price (US$/Unit) & (2020-2025)
Table 65. LINGXI Key News & Latest Developments
Table 66. Beijing LLVision Technology Company Summary
Table 67. Beijing LLVision Technology AR Array Optical Waveguide Product Offerings
Table 68. Beijing LLVision Technology AR Array Optical Waveguide Sales (K Units), Revenue (US$, Mn) and Average Price (US$/Unit) & (2020-2025)
Table 69. Beijing LLVision Technology Key News & Latest Developments
Table 70. Hangzhou Lili Information Technology Company Summary
Table 71. Hangzhou Lili Information Technology AR Array Optical Waveguide Product Offerings
Table 72. Hangzhou Lili Information Technology AR Array Optical Waveguide Sales (K Units), Revenue (US$, Mn) and Average Price (US$/Unit) & (2020-2025)
Table 73. Hangzhou Lili Information Technology Key News & Latest Developments
Table 74. Gudong Technology Company Summary
Table 75. Gudong Technology AR Array Optical Waveguide Product Offerings
Table 76. Gudong Technology AR Array Optical Waveguide Sales (K Units), Revenue (US$, Mn) and Average Price (US$/Unit) & (2020-2025)
Table 77. Gudong Technology Key News & Latest Developments
Table 78. OPTIX Company Summary
Table 79. OPTIX AR Array Optical Waveguide Product Offerings
Table 80. OPTIX AR Array Optical Waveguide Sales (K Units), Revenue (US$, Mn) and Average Price (US$/Unit) & (2020-2025)
Table 81. OPTIX Key News & Latest Developments
Table 82. Beijing Nai Dejia Display Technology Company Summary
Table 83. Beijing Nai Dejia Display Technology AR Array Optical Waveguide Product Offerings
Table 84. Beijing Nai Dejia Display Technology AR Array Optical Waveguide Sales (K Units), Revenue (US$, Mn) and Average Price (US$/Unit) & (2020-2025)
Table 85. Beijing Nai Dejia Display Technology Key News & Latest Developments
Table 86. COSTAR GROUP Company Summary
Table 87. COSTAR GROUP AR Array Optical Waveguide Product Offerings
Table 88. COSTAR GROUP AR Array Optical Waveguide Sales (K Units), Revenue (US$, Mn) and Average Price (US$/Unit) & (2020-2025)
Table 89. COSTAR GROUP Key News & Latest Developments
Table 90. GodView Company Summary
Table 91. GodView AR Array Optical Waveguide Product Offerings
Table 92. GodView AR Array Optical Waveguide Sales (K Units), Revenue (US$, Mn) and Average Price (US$/Unit) & (2020-2025)
Table 93. GodView Key News & Latest Developments
Table 94. AR Array Optical Waveguide Capacity of Key Manufacturers in Global Market, 2023-2025 (K Units)
Table 95. Global AR Array Optical Waveguide Capacity Market Share of Key Manufacturers, 2023-2025
Table 96. Global AR Array Optical Waveguide Production by Region, 2020-2025 (K Units)
Table 97. Global AR Array Optical Waveguide Production by Region, 2026-2032 (K Units)
Table 98. AR Array Optical Waveguide Market Opportunities & Trends in Global Market
Table 99. AR Array Optical Waveguide Market Drivers in Global Market
Table 100. AR Array Optical Waveguide Market Restraints in Global Market
Table 101. AR Array Optical Waveguide Raw Materials
Table 102. AR Array Optical Waveguide Raw Materials Suppliers in Global Market
Table 103. Typical AR Array Optical Waveguide Downstream
Table 104. AR Array Optical Waveguide Downstream Clients in Global Market
Table 105. AR Array Optical Waveguide Distributors and Sales Agents in Global Market

List of Figures
Figure 1. AR Array Optical Waveguide Product Picture
Figure 2. AR Array Optical Waveguide Segment by Type in 2024
Figure 3. AR Array Optical Waveguide Segment by Application in 2024
Figure 4. Global AR Array Optical Waveguide Market Overview: 2024
Figure 5. Key Caveats
Figure 6. Global AR Array Optical Waveguide Market Size: 2024 VS 2032 (US$, Mn)
Figure 7. Global AR Array Optical Waveguide Revenue: 2020-2032 (US$, Mn)
Figure 8. AR Array Optical Waveguide Sales in Global Market: 2020-2032 (K Units)
Figure 9. The Top 3 and 5 Players Market Share by AR Array Optical Waveguide Revenue in 2024
Figure 10. Segment by Type – Global AR Array Optical Waveguide Revenue, (US$, Mn), 2024 & 2032
Figure 11. Segment by Type – Global AR Array Optical Waveguide Revenue Market Share, 2020-2032
Figure 12. Segment by Type – Global AR Array Optical Waveguide Sales Market Share, 2020-2032
Figure 13. Segment by Type – Global AR Array Optical Waveguide Price (US$/Unit), 2020-2032
Figure 14. Segment by Application – Global AR Array Optical Waveguide Revenue, (US$, Mn), 2024 & 2032
Figure 15. Segment by Application – Global AR Array Optical Waveguide Revenue Market Share, 2020-2032
Figure 16. Segment by Application – Global AR Array Optical Waveguide Sales Market Share, 2020-2032
Figure 17. Segment by Application -Global AR Array Optical Waveguide Price (US$/Unit), 2020-2032
Figure 18. By Region – Global AR Array Optical Waveguide Revenue, (US$, Mn), 2025 & 2032
Figure 19. By Region – Global AR Array Optical Waveguide Revenue Market Share, 2020 VS 2024 VS 2032
Figure 20. By Region – Global AR Array Optical Waveguide Revenue Market Share, 2020-2032
Figure 21. By Region – Global AR Array Optical Waveguide Sales Market Share, 2020-2032
Figure 22. By Country – North America AR Array Optical Waveguide Revenue Market Share, 2020-2032
Figure 23. By Country – North America AR Array Optical Waveguide Sales Market Share, 2020-2032
Figure 24. United States AR Array Optical Waveguide Revenue, (US$, Mn), 2020-2032
Figure 25. Canada AR Array Optical Waveguide Revenue, (US$, Mn), 2020-2032
Figure 26. Mexico AR Array Optical Waveguide Revenue, (US$, Mn), 2020-2032
Figure 27. By Country – Europe AR Array Optical Waveguide Revenue Market Share, 2020-2032
Figure 28. By Country – Europe AR Array Optical Waveguide Sales Market Share, 2020-2032
Figure 29. Germany AR Array Optical Waveguide Revenue, (US$, Mn), 2020-2032
Figure 30. France AR Array Optical Waveguide Revenue, (US$, Mn), 2020-2032
Figure 31. U.K. AR Array Optical Waveguide Revenue, (US$, Mn), 2020-2032
Figure 32. Italy AR Array Optical Waveguide Revenue, (US$, Mn), 2020-2032
Figure 33. Russia AR Array Optical Waveguide Revenue, (US$, Mn), 2020-2032
Figure 34. Nordic Countries AR Array Optical Waveguide Revenue, (US$, Mn), 2020-2032
Figure 35. Benelux AR Array Optical Waveguide Revenue, (US$, Mn), 2020-2032
Figure 36. By Region – Asia AR Array Optical Waveguide Revenue Market Share, 2020-2032
Figure 37. By Region – Asia AR Array Optical Waveguide Sales Market Share, 2020-2032
Figure 38. China AR Array Optical Waveguide Revenue, (US$, Mn), 2020-2032
Figure 39. Japan AR Array Optical Waveguide Revenue, (US$, Mn), 2020-2032
Figure 40. South Korea AR Array Optical Waveguide Revenue, (US$, Mn), 2020-2032
Figure 41. Southeast Asia AR Array Optical Waveguide Revenue, (US$, Mn), 2020-2032
Figure 42. India AR Array Optical Waveguide Revenue, (US$, Mn), 2020-2032
Figure 43. By Country – South America AR Array Optical Waveguide Revenue Market Share, 2020-2032
Figure 44. By Country – South America AR Array Optical Waveguide Sales, Market Share, 2020-2032
Figure 45. Brazil AR Array Optical Waveguide Revenue, (US$, Mn), 2020-2032
Figure 46. Argentina AR Array Optical Waveguide Revenue, (US$, Mn), 2020-2032
Figure 47. By Country – Middle East & Africa AR Array Optical Waveguide Revenue, Market Share, 2020-2032
Figure 48. By Country – Middle East & Africa AR Array Optical Waveguide Sales, Market Share, 2020-2032
Figure 49. Turkey AR Array Optical Waveguide Revenue, (US$, Mn), 2020-2032
Figure 50. Israel AR Array Optical Waveguide Revenue, (US$, Mn), 2020-2032
Figure 51. Saudi Arabia AR Array Optical Waveguide Revenue, (US$, Mn), 2020-2032
Figure 52. UAE AR Array Optical Waveguide Revenue, (US$, Mn), 2020-2032
Figure 53. Global AR Array Optical Waveguide Production Capacity (K Units), 2020-2032
Figure 54. The Percentage of Production AR Array Optical Waveguide by Region, 2024 VS 2032
Figure 55. AR Array Optical Waveguide Industry Value Chain
Figure 56. Marketing Channels