
MARKET INSIGHTS
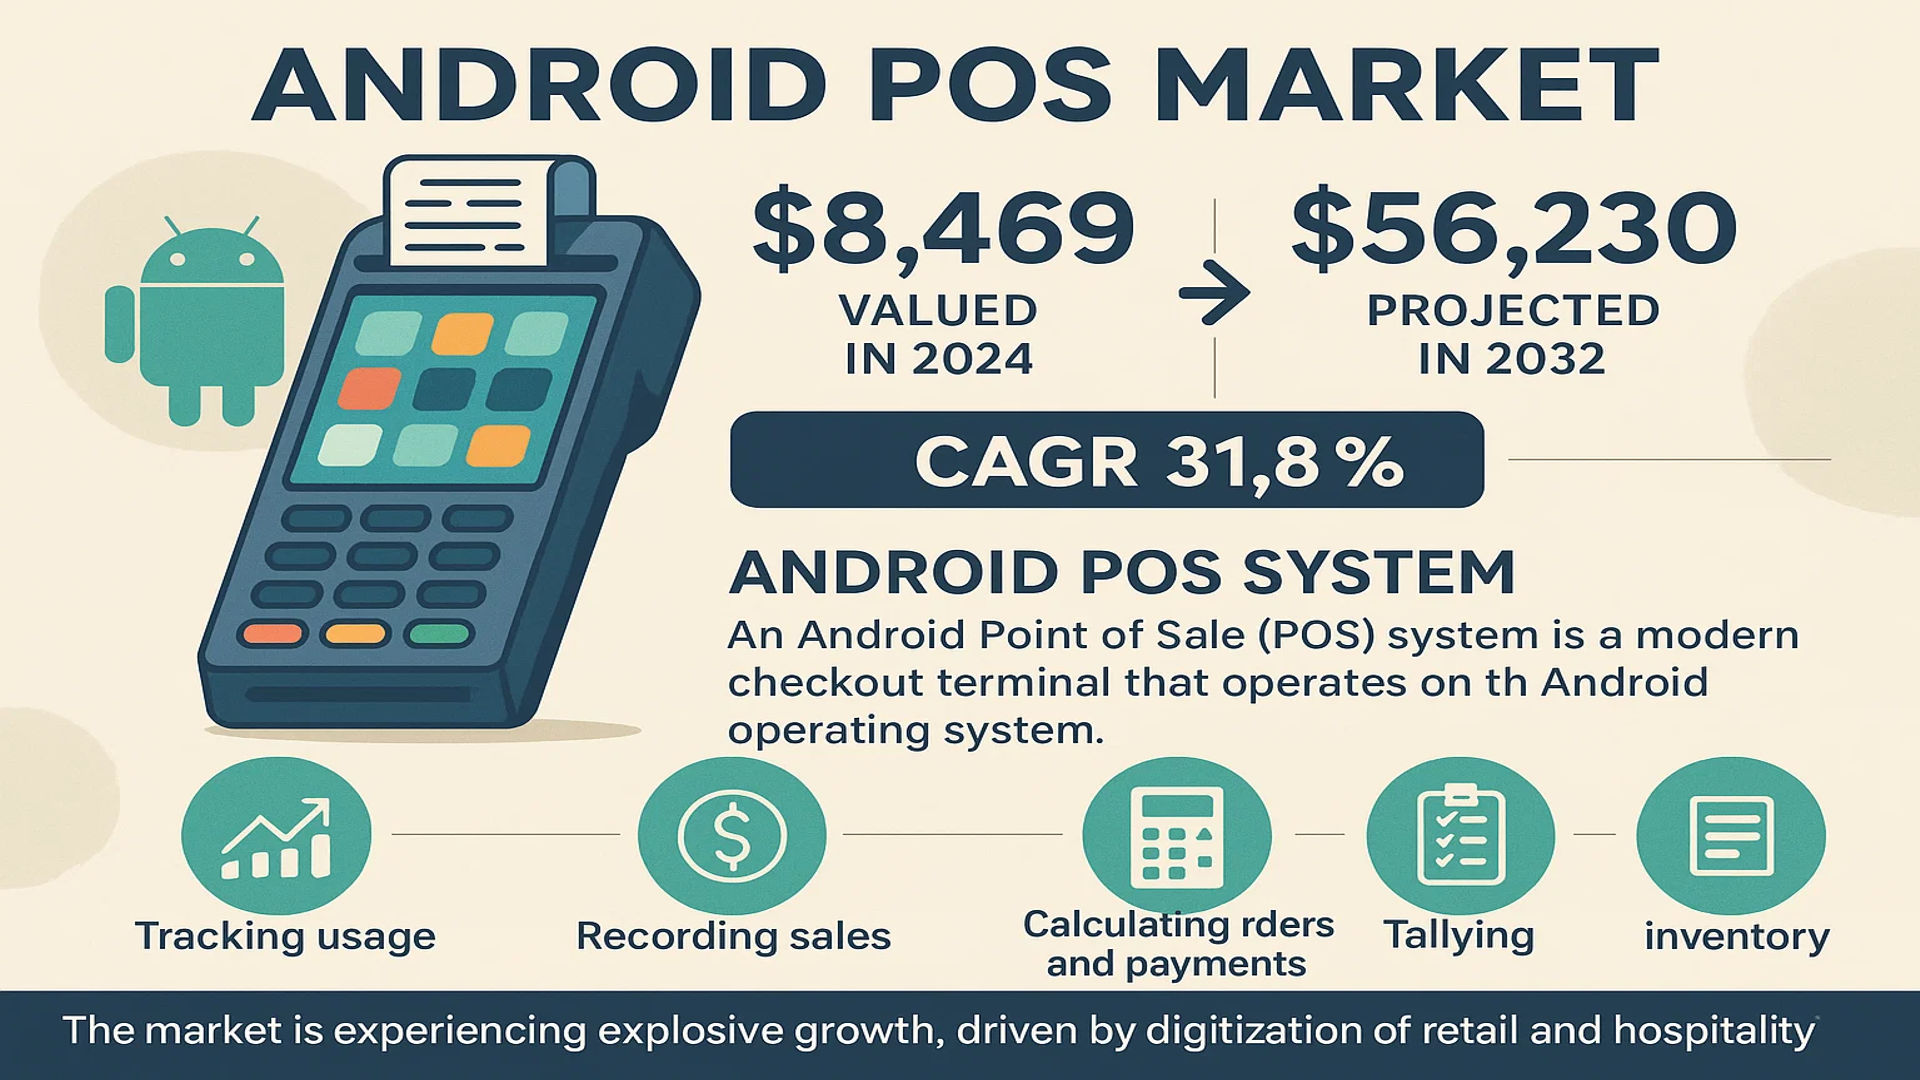
The global Android POS Market was valued at 8469 million in 2024 and is projected to reach US$ 56230 million by 2032, at a CAGR of 31.8% during the forecast period.
An Android Point of Sale (POS) system is a modern checkout terminal that operates on the Android operating system. These systems connect to a main computer and are programmed to perform a wide array of functions, including tracking usage, recording sales, monitoring currency updates, calculating orders and payments, and tallying inventory based on items stored within the system. This technology provides businesses with enhanced control and security over their cash registers by limiting employee access.
The market is experiencing explosive growth, primarily driven by the rapid digitization of retail and hospitality sectors globally. The flexibility, cost-effectiveness, and rich app ecosystem of the Android platform make these systems highly attractive, especially to small and medium-sized businesses seeking to streamline operations. Furthermore, the dominance of the portable POS segment, which holds approximately 90% of the market share, underscores the strong demand for mobile and wireless payment solutions. The Asia-Pacific region is the largest market, accounting for about 70% of global revenue, because of widespread adoption in countries like China and India.
MARKET DYNAMICS
MARKET DRIVERS
Accelerated Shift Towards Cashless Economies to Drive Android POS Adoption
The global transition towards digital payments is significantly accelerating the adoption of Android POS systems. With over 80% of consumers in developed economies preferring contactless payments, businesses are increasingly upgrading to Android-based terminals to meet customer expectations. These systems support multiple payment methods including NFC, QR codes, and mobile wallets, providing the flexibility required in modern retail environments. The COVID-19 pandemic further accelerated this shift, with contactless payment volumes increasing by approximately 150% globally between 2020 and 2024. Android POS systems enable seamless integration with emerging payment technologies, making them essential for businesses seeking to remain competitive in the rapidly evolving payment landscape.
Growing Retail Digitalization and Omnichannel Strategies to Boost Market Expansion
Retail digitalization is transforming business operations worldwide, creating substantial demand for Android POS solutions. Modern retailers require integrated systems that can manage inventory, customer relationships, and sales data across multiple channels simultaneously. Android POS systems offer this capability through cloud-based platforms that synchronize data in real-time, enabling businesses to implement effective omnichannel strategies. The retail sector’s digital transformation investment is projected to exceed $2.8 trillion globally by 2025, with POS modernization representing a significant portion of this expenditure. These systems provide advanced analytics capabilities, allowing retailers to track consumer behavior, optimize inventory management, and personalize customer experiences, ultimately driving higher sales conversion rates and operational efficiency.
Cost Efficiency and Scalability Advantages for SMEs to Fuel Market Growth
Android POS systems offer exceptional cost efficiency and scalability, particularly beneficial for small and medium enterprises. Traditional POS systems often require substantial upfront investment and ongoing maintenance costs, whereas Android-based solutions typically operate on a subscription model with lower initial expenditure. The total cost of ownership for Android POS systems is approximately 40% lower than traditional systems over a five-year period. This affordability has enabled widespread adoption among smaller businesses, which represent over 90% of enterprises globally. Furthermore, Android POS systems can easily scale as businesses grow, adding new functionalities through software updates rather than hardware replacements. This scalability is crucial in emerging markets where business expansion rates exceed 15% annually.
Additionally, the open-source nature of Android allows for extensive customization, enabling businesses to tailor POS solutions to their specific requirements without significant development costs.
➤ For instance, many restaurant chains have implemented customized Android POS systems that integrate reservation management, kitchen display systems, and customer loyalty programs into a single platform.
Moreover, government initiatives promoting digital payments and cashless economies across various regions are providing additional impetus for Android POS adoption.
MARKET RESTRAINTS
Security Concerns and Data Privacy Regulations to Limit Market Penetration
Despite rapid growth, the Android POS market faces significant security challenges that restrain broader adoption. Payment card industry data security standards require stringent protection of sensitive customer information, and Android’s open ecosystem presents unique vulnerabilities. Approximately 35% of data breaches in retail environments originate from POS systems, creating substantial concern among merchants handling financial transactions. The fragmented nature of Android devices and operating system versions complicates security updates, with many devices running outdated software that lacks critical security patches. This vulnerability is particularly problematic given that financial fraud losses exceeded $40 billion globally in 2023, with POS systems representing a substantial target for cybercriminals.
Integration Complexities with Legacy Systems to Hinder Market Expansion
The integration of Android POS systems with existing legacy infrastructure presents significant challenges for many enterprises. Many established businesses have invested substantial resources in traditional POS systems and complementary software over decades. The migration to Android-based solutions often requires complex data migration, staff retraining, and system compatibility assessments. Approximately 60% of businesses report integration difficulties when implementing new POS systems, with integration projects typically requiring 3-6 months for completion. The cost of integration and system downtime during transition periods can represent up to 30% of the total project cost, creating financial barriers for many organizations, particularly in price-sensitive markets and among smaller enterprises with limited technical resources.
Limited Internet Connectivity in Emerging Markets to Restrict Adoption Rates
Android POS systems heavily rely on consistent internet connectivity for cloud-based operations and real-time data synchronization, creating adoption barriers in regions with inadequate digital infrastructure. In many emerging economies, internet penetration remains below 50%, and connectivity reliability issues affect approximately 40% of businesses operating in rural areas. The Android POS market growth in these regions is constrained by the prerequisite of stable internet access, which is not universally available. Furthermore, the cost of maintaining reliable internet connections adds operational expenses that many small businesses cannot sustain. This digital divide creates significant market fragmentation, with advanced economies adopting Android POS systems at rates 300% higher than developing regions.
MARKET CHALLENGES
Fragmented Android Ecosystem and Compatibility Issues to Challenge Market Consistency
The Android POS market faces substantial challenges due to the fragmented nature of the Android ecosystem. With multiple device manufacturers, chipset variations, and operating system versions in circulation, ensuring consistent performance and security across all platforms becomes increasingly difficult. Currently, there are over 24,000 distinct Android device models available globally, each with different hardware specifications and software capabilities. This diversity creates compatibility challenges for POS application developers who must ensure their software functions correctly across numerous device configurations. The testing and certification process for each device variant adds significant development time and cost, ultimately slowing down innovation and market responsiveness.
Other Challenges
Rapid Technological Obsolescence
The fast pace of technological advancement presents ongoing challenges for Android POS system viability. Hardware components become outdated within 2-3 years, while software requirements evolve even more rapidly. This accelerated obsolescence cycle forces businesses to frequently update their systems to maintain compatibility with new payment technologies and security standards. The cost of continuous upgrades can be prohibitive for many businesses, particularly smaller enterprises operating with limited capital expenditure budgets.
Regulatory Compliance Complexity
Navigating diverse regulatory requirements across different regions and industries creates significant compliance challenges. Payment processing regulations vary substantially between countries, and Android POS providers must ensure their systems meet all local compliance standards. The complexity increases with each market expansion, requiring extensive legal expertise and system modifications to address specific regional requirements.
MARKET OPPORTUNITIES
Integration with Artificial Intelligence and Advanced Analytics to Create New Revenue Streams
The integration of artificial intelligence and machine learning capabilities into Android POS systems presents substantial growth opportunities. Advanced analytics can transform raw transaction data into actionable business intelligence, enabling retailers to optimize pricing strategies, inventory management, and customer engagement. AI-powered POS systems can analyze purchasing patterns to predict demand fluctuations with over 85% accuracy, significantly reducing inventory costs and stockouts. The global market for AI in retail is projected to grow at approximately 35% annually, with POS systems representing a primary implementation channel. These intelligent systems can also personalize customer experiences in real-time, suggesting complementary products based on purchase history and current selections.
Expansion into Untapped SME Markets in Developing Economies to Drive Future Growth
Developing economies represent significant untapped potential for Android POS system providers. With over 400 million small and medium enterprises worldwide, and approximately 70% located in emerging markets, the addressable market remains substantially underserved. Mobile penetration in these regions exceeds 90%, providing the necessary infrastructure for Android POS adoption. The gradual improvement in internet connectivity and digital literacy, combined with government initiatives promoting digital payments, creates favorable conditions for market expansion. Android POS systems offer particular advantages in these markets due to their affordability, ease of use, and compatibility with widely available Android devices. The convergence of these factors suggests that emerging markets could account for over 60% of new Android POS installations in the coming years.
Adoption in Non-Traditional Sectors to Open New Application Verticals
Beyond traditional retail and hospitality sectors, Android POS systems are finding new applications across diverse industries including healthcare, education, transportation, and government services. The healthcare sector, for example, is adopting POS systems for patient billing and payment processing, with the global healthcare POS market growing at approximately 28% annually. Educational institutions are implementing these systems for fee collections and campus store operations. The versatility of Android platforms allows for customization to meet specific industry requirements, creating numerous niche market opportunities. This diversification reduces market dependency on traditional retail sectors and provides stability against economic fluctuations affecting specific industries.
Furthermore, the integration of Android POS systems with Internet of Things devices and smart city infrastructure presents additional growth avenues across various service sectors.
ANDROID POS MARKET TRENDS
Integration of Advanced Analytics and AI to Emerge as a Dominant Trend
The integration of advanced analytics and artificial intelligence (AI) into Android POS systems is revolutionizing how businesses operate, driving significant market growth. These intelligent systems now offer predictive sales analytics, real-time inventory optimization, and personalized customer engagement tools that were previously unavailable on traditional terminals. For instance, AI algorithms can analyze purchasing patterns to forecast demand, reducing stockouts by up to 30% and minimizing overstock situations. Furthermore, machine learning capabilities enable dynamic pricing adjustments based on factors like time of day, local events, or inventory levels, directly impacting profitability. The shift toward data-driven decision making is particularly crucial in the retail and hospitality sectors, where margins are tight and customer preferences evolve rapidly. This trend is further accelerated by the declining cost of cloud computing and data storage, making sophisticated analytics accessible even to small and medium-sized enterprises. As businesses increasingly recognize the competitive advantage offered by intelligent POS systems, adoption rates are projected to climb, reinforcing the market’s robust expansion.
Other Trends
Rapid Shift Toward Cloud-Based and Mobile-First Solutions
The Android POS market is experiencing a fundamental transformation driven by the rapid adoption of cloud-based architectures and mobile-first designs. Unlike traditional, stationary systems, modern Android POS solutions offer unparalleled flexibility, allowing businesses to process transactions anywhere within their premises using smartphones or tablets. This mobility is particularly valuable in industries like restaurants and retail, where line-busting during peak hours can improve customer throughput by over 20%. Cloud connectivity ensures that all data—from sales figures to inventory levels—is synchronized in real-time across multiple locations, providing business owners with a comprehensive, up-to-date view of their operations from any device. Moreover, software updates and security patches are deployed seamlessly over-the-air, reducing downtime and maintenance costs. The subscription-based pricing model common with these solutions also lowers the barrier to entry for smaller businesses, as it avoids large upfront capital expenditures. This trend is fundamentally reshaping merchant expectations, moving the market away from hardware-centric purchases toward ongoing service relationships focused on continuous improvement and scalability.
Enhanced Security and Payment Diversification
Security enhancements and payment diversification represent critical trends propelling the Android POS market forward. With the increasing frequency and sophistication of cyberattacks targeting payment systems, modern Android terminals are incorporating advanced encryption standards, tokenization, and end-to-end secure card reader technologies to protect sensitive customer data. The adoption of EMV chip technology and contactless payments has become nearly universal, with contactless transaction volumes growing by approximately 40% annually in many developed markets. Furthermore, Android POS systems are now supporting a widening array of payment methods beyond traditional credit and debit cards, including digital wallets like Apple Pay and Google Pay, QR code-based payments popular in Asian markets, and even emerging cryptocurrencies. This diversification is essential for merchants aiming to cater to a global customer base with varying payment preferences. The robust and open nature of the Android platform allows manufacturers to quickly integrate new payment technologies as they emerge, ensuring that businesses can future-proof their investment and meet evolving consumer demands for convenience and security.
COMPETITIVE LANDSCAPE
Key Industry Players
Companies Strive to Strengthen their Product Portfolio to Sustain Competition
The global Android POS market exhibits a semi-consolidated competitive structure, dominated by a handful of major players, particularly from the Asia-Pacific region, which holds approximately 70% of the market share. This landscape is characterized by intense competition driven by technological innovation, strategic partnerships, and aggressive expansion into emerging markets. The top five manufacturers collectively command a significant portion of the market, estimated at around 70%, underscoring the concentration of power among leading firms.
PAX Technology and Ingenico (Landi) are recognized as pivotal players, largely due to their extensive global distribution networks and comprehensive product portfolios that cater to both portable and desktop POS segments. Their growth is further propelled by continuous investment in R&D, focusing on enhancing security features, improving user interfaces, and integrating advanced payment processing capabilities to meet the evolving demands of the retail and hospitality sectors.
Meanwhile, Newland Payment and Fujian Centerm have solidified their positions through strong domestic sales in China and strategic expansions into Southeast Asia and other high-growth regions. These companies are increasingly focusing on developing cost-effective solutions tailored for small and medium-sized enterprises (SMEs), a key demographic driving market adoption. Their strategy involves launching affordable, feature-rich portable Android POS terminals, which constitute nearly 90% of the market by product type.
Furthermore, other significant contributors like SZZT Electronics and Sunmi are strengthening their market presence by forging alliances with software developers and financial institutions. These partnerships enable them to offer integrated solutions that combine hardware with proprietary software, providing merchants with seamless payment, inventory management, and customer relationship management tools. Such initiatives are critical for differentiation in a crowded marketplace and are expected to fuel their market share growth throughout the forecast period.
List of Key Android POS Companies Profiled
- PAX Technology (China)
- Ingenico (Landi) (France)
- Newland Payment (China)
- Fujian Centerm (China)
- SZZT Electronics (China)
- Sunmi (China)
- Clover Network (U.S.)
- Xinguodu (China)
- Smartpeak (China)
- Zall Fintech (China)
- Justtide (China)
- NEWPOS (China)
- Wintec (China)
- Hisense (China)
Segment Analysis:
By Type
Portable POS Segment Dominates the Market Due to Unmatched Mobility and Flexibility for Modern Retail
The market is segmented based on type into:
- Portable POS
- Subtypes: Handheld terminals, mobile card readers, and others
- Desktop POS
- Subtypes: All-in-one terminals, modular systems, and others
By Application
Retail Segment Leads Due to High Adoption for Streamlined Checkout and Inventory Management
The market is segmented based on application into:
- Retail
- Restaurant
- Hospitality
- Other
By End User
Small and Medium Enterprises (SMEs) Segment Exhibits Strong Growth Driven by Affordable and Scalable Solutions
The market is segmented based on end user into:
- Large Enterprises
- Small and Medium Enterprises (SMEs)
By Component
Hardware Segment Forms the Core Foundation of the Android POS Ecosystem
The market is segmented based on component into:
- Hardware
- Subtypes: Terminals, card readers, cash drawers, and others
- Software
- Subtypes: Operating system, payment processing, inventory management, and others
- Services
- Subtypes: Installation, maintenance, support, and others
Regional Analysis: Android POS Market
Asia-Pacific
The Asia-Pacific region is the undisputed leader in the global Android POS market, accounting for approximately 70% of the total market share. This dominance is primarily fueled by the massive and rapidly digitizing retail and hospitality sectors in China and India. China, in particular, is a global manufacturing hub for these devices, home to key players like Fujian Centerm, Newland Payment, PAX Technology, and SZZT Electronics. The widespread adoption is driven by the region’s booming e-commerce ecosystem, government initiatives promoting digital payments (such as India’s Unified Payments Interface or UPI), and the affordability of Android-based solutions compared to traditional proprietary systems. The market is characterized by a strong preference for portable POS terminals, which hold about 90% of the regional market, as they offer unparalleled flexibility for mobile vendors, pop-up stores, and delivery services. While cost sensitivity remains a factor, there is a clear and accelerating trend towards adopting integrated, smart POS systems that offer inventory management, customer relationship management (CRM), and advanced analytics, moving beyond simple transaction processing.
North America
The North American market is a significant and technologically advanced adopter of Android POS systems, driven by a robust retail sector and a high demand for seamless omnichannel experiences. The United States is the largest market in the region, with businesses increasingly upgrading from legacy systems to flexible, cloud-connected Android solutions to gain real-time business insights and enhance customer engagement. Security and compliance with standards like the Payment Card Industry Data Security Standard (PCI DSS) are paramount, influencing product development and procurement decisions. The market is also seeing strong growth in niche applications beyond retail, particularly in the restaurant industry for tableside ordering and in the entertainment sector for ticketing and concessions. Key drivers include the need for improved operational efficiency, the rise of mobile and contactless payments, and the demand for solutions that can integrate with a wide array of third-party software applications for a unified business management platform.
Europe
Europe represents a mature and steadily growing market for Android POS, with demand being shaped by stringent data protection regulations like the General Data Protection Regulation (GDPR) and a strong push towards a cashless society, particularly in Western and Northern European nations. The region shows a high adoption rate in the hospitality and restaurant sectors, where the versatility of Android POS systems supports multi-language and multi-currency functionalities crucial for the tourism industry. Sustainability is becoming an increasingly important factor, with vendors and businesses showing a growing preference for energy-efficient devices and longer product lifecycles. Markets in the UK, Germany, and France are at the forefront, driven by innovation and the need for systems that can provide detailed analytics for business optimization. However, the fragmentation of the European market, with varying regulatory nuances across countries, presents both a challenge and an opportunity for vendors offering customizable and compliant solutions.
South America
The Android POS market in South America is in a growth phase, presenting substantial opportunities fueled by increasing smartphone penetration and governmental efforts to formalize economies and reduce cash transactions. Brazil and Argentina are the key markets, with the retail sector being the primary driver of adoption. The growth is further supported by the expansion of financial inclusion initiatives and the rising popularity of mobile wallets. However, the market’s expansion is tempered by economic volatility and infrastructure challenges in certain areas, which can affect the widespread rollout of stable internet connectivity required for cloud-based POS systems. Consequently, there is a noticeable demand for devices that offer reliable offline functionality. Price sensitivity is a significant factor, making cost-effective solutions from Asian manufacturers particularly competitive in this region.
Middle East & Africa
The Middle East and Africa region is an emerging market with strong long-term potential for Android POS systems. Growth is concentrated in more economically developed nations such as the UAE, Saudi Arabia, and South Africa, where large-scale investments in smart city initiatives and tourism infrastructure are driving the modernization of retail and hospitality outlets. The region is leapfrogging traditional POS systems altogether, moving directly to advanced Android-based solutions that support a wide range of payment methods. In the UAE and Saudi Arabia, particularly, Vision 2030 economic diversification plans are accelerating digital transformation across sectors, creating a fertile ground for POS adoption. However, the market’s development is uneven across the region. Progress in other areas can be slower due to varying levels of economic development, regulatory frameworks, and digital infrastructure. Nonetheless, the overall trajectory is positive, with increasing recognition of the value these systems bring to business efficiency and customer experience.
Report Scope
This market research report provides a comprehensive analysis of the global Android POS market, covering the forecast period 2024–2032. It offers detailed insights into market dynamics, technological advancements, competitive landscape, and key trends shaping the industry.
Key focus areas of the report include:
- Market Size & Forecast: Historical data and future projections for revenue, unit shipments, and market value across major regions and segments.
- Segmentation Analysis: Detailed breakdown by product type, technology, application, and end-user industry to identify high-growth segments and investment opportunities.
- Regional Outlook: Insights into market performance across North America, Europe, Asia-Pacific, Latin America, and the Middle East & Africa, including country-level analysis where relevant.
- Competitive Landscape: Profiles of leading market participants, including their product offerings, R&D focus, manufacturing capacity, pricing strategies, and recent developments such as mergers, acquisitions, and partnerships.
- Technology Trends & Innovation: Assessment of emerging technologies, integration of AI/IoT, mobile payment trends, security protocols, and evolving industry standards.
- Market Drivers & Restraints: Evaluation of factors driving market growth along with challenges, supply chain constraints, regulatory issues, and market-entry barriers.
- Stakeholder Analysis: Insights for component suppliers, OEMs, system integrators, investors, and policymakers regarding the evolving ecosystem and strategic opportunities.
Primary and secondary research methods are employed, including interviews with industry experts, data from verified sources, and real-time market intelligence to ensure the accuracy and reliability of the insights presented.
FREQUENTLY ASKED QUESTIONS:
What is the current market size of Global Android POS Market?
-> Android POS Market was valued at 8469 million in 2024 and is projected to reach US$ 56230 million by 2032, at a CAGR of 31.8% during the forecast period.
Which key companies operate in Global Android POS Market?
-> Key players include Fujian Centerm, PAX Technology, Newland Payment, Ingenico, SZZT Electronics, Sunmi, Clover Network, and Hisense, among others.
What are the key growth drivers?
-> Key growth drivers include digital payment adoption, demand for portable POS solutions, retail sector modernization, and the growth of small-to-medium businesses.
Which region dominates the market?
-> Asia-Pacific is the largest market, holding approximately 70% of the global market share.
What are the emerging trends?
-> Emerging trends include integration of AI for analytics, cloud-based POS solutions, contactless payment technologies, and enhanced security features.

Get Sample Report PDF for Exclusive Insights
Report Sample Includes
- Table of Contents
- List of Tables & Figures
- Charts, Research Methodology, and more...
 Download Sample Report PDF





