SEMICONDUCTOR INSIGHT
MARKET RESEARCH REPORT

Aluminum Nitride Ceramic Package Market

2026 to 2034
MARKET INTELLIGENCE
ACROSS KEY REGIONS
2026 EDITION
DIELECTRIC MATERIALS Semiconductor Market Research

Aluminum Nitride Ceramic Package Market

Trends, Business Strategies 2026-2034

◷
UPDATED 28 September 2026
▤
REPORT LENGTH Detailed Report
▣
REPORT CODE 7939e23e9c32
▯
FORMATS PDF

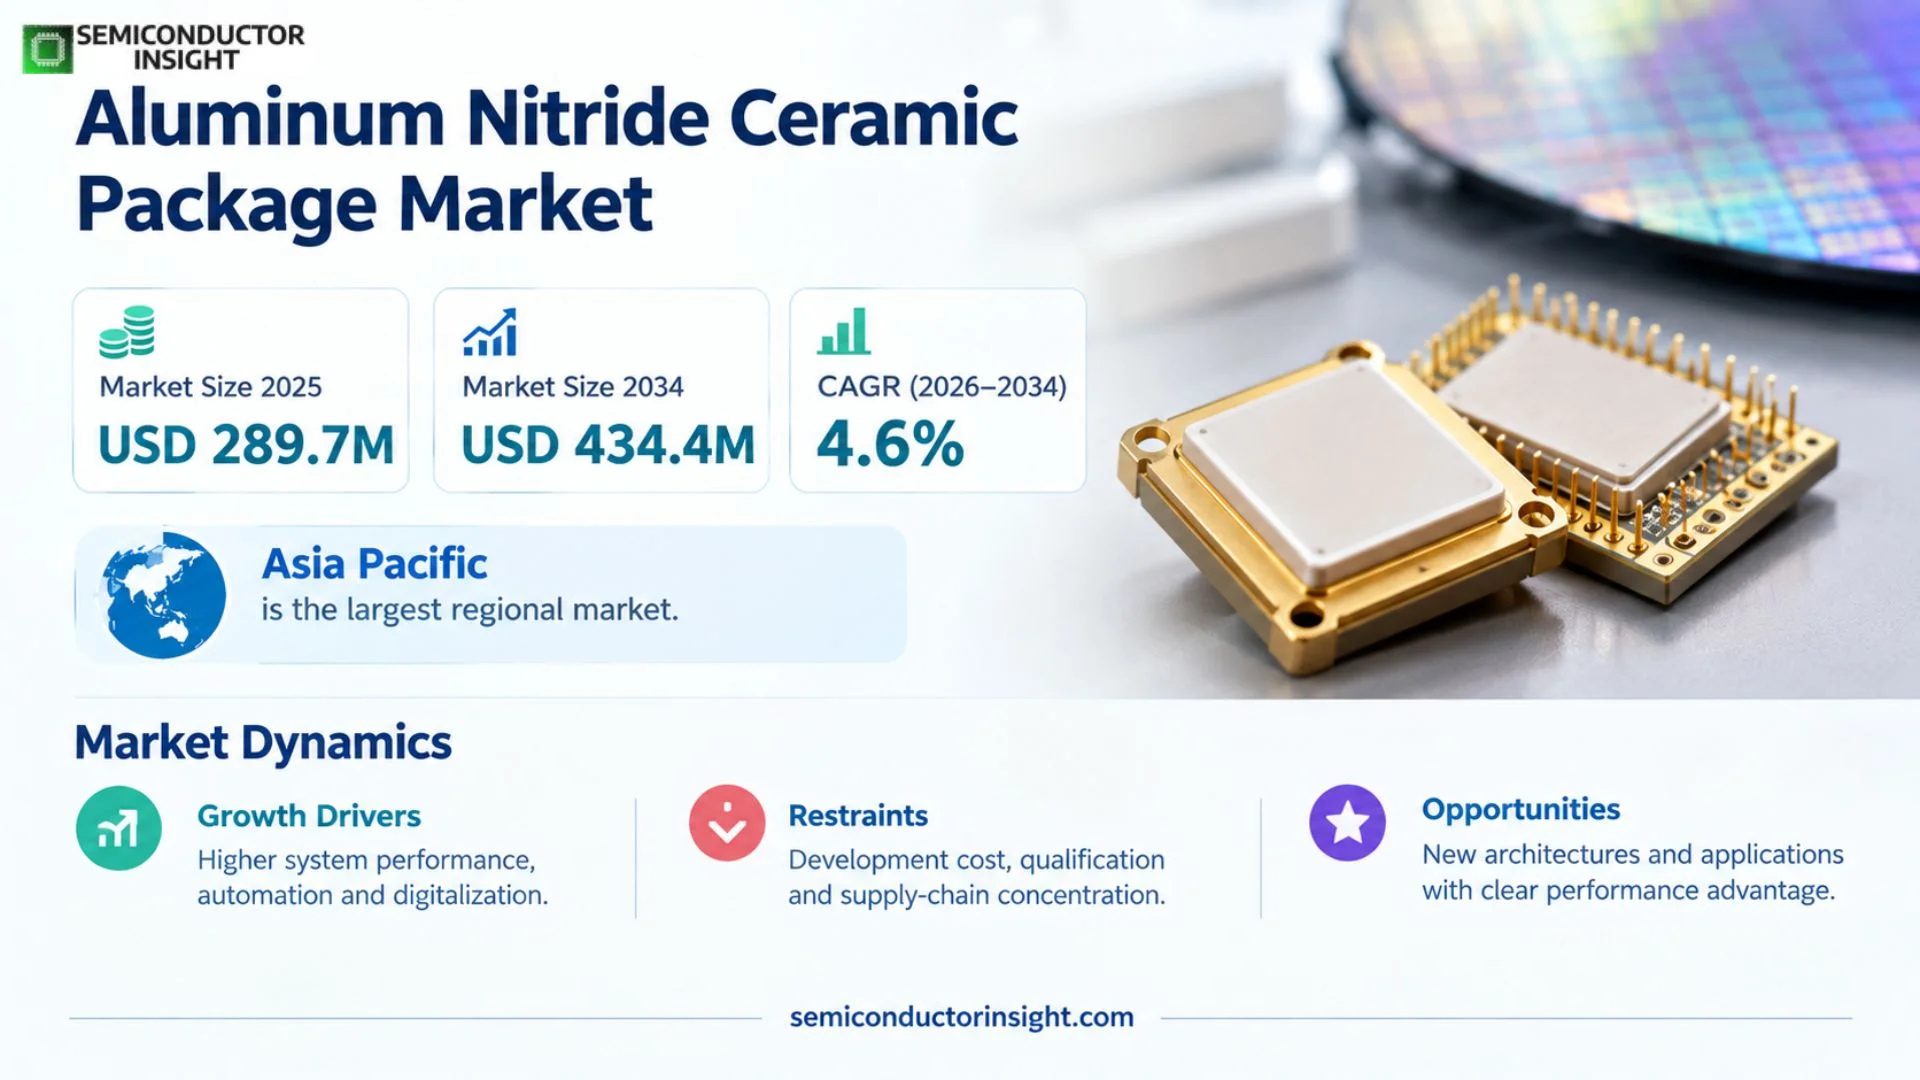
Aluminum Nitride Ceramic Package Market is estimated at USD 303.1 million in 2026. The market is projected to reach USD 434.4 million by 2034, representing a CAGR of 4.6% during 2026–2034. Asia Pacific is the largest regional market because Japan and China together hold a majority of global manufacturing capacity and the region hosts large semiconductor, LED, telecom and automotive electronics supply chains.

Get the sample PDF with study scope, segmentation and methodology details.

Key Statistics

2025 Market Size
USD 289.7 million
2026 Estimated Market Size
USD 303.1 million
2034 Projected Market Size
USD 434.4 million
CAGR (2026–2034)
4.6%

Key Takeaways

  • Market size and growth: the market is estimated at USD 303.1 million in 2026 and is projected to reach USD 434.4 million by 2034, representing a 4.6% CAGR during 2026–2034.
  • Substrates ≤0.5mm are the leading type because miniaturized electronics need thin packages that still provide high thermal conductivity and electrical isolation.
  • Communication devices are the largest application, supported by 5G RF power amplifiers and other high-power components that require efficient heat removal in compact packages.
  • Asia Pacific leads through KYOCERA, Japanese ceramic expertise and China’s expanding packaging capacity; the underlying market scope places Japan and China at more than 60% of manufacturing capacity.
  • Wide-bandgap power devices are a major growth engine because SiC and GaN modules generate high heat flux and benefit from AlN’s thermal conductivity and insulation.

Aluminum Nitride Ceramic Package Market Overview

Aluminum Nitride Ceramic Package market was valued at USD 289.7 million in 2025 and is estimated at USD 303.1 million in 2026. The market is projected to reach USD 434.4 million by 2034, representing a CAGR of 4.6% during 2026–2034. Asia Pacific is the largest regional market because Japan and China together hold a majority of global manufacturing capacity and the region hosts large semiconductor, LED, telecom and automotive electronics supply chains.

Base year: 2025 · Estimated year: 2026 · Forecast period: 2026–2034 · Values in USD million unless otherwise stated

Aluminum nitride ceramic packages provide electrical insulation together with high thermal conductivity, making them valuable where semiconductor die generate substantial heat in a small footprint. Typical applications include RF power devices, SiC and GaN power modules, high-power LEDs, automotive electronics, aerospace electronics and telecom infrastructure. AlN can achieve thermal conductivity far above conventional alumina while maintaining a coefficient of thermal expansion that is compatible with many semiconductor packaging structures.

Package performance depends on ceramic purity, sintering, metallization and bonding architecture. Thin substrates reduce thermal path length and package height, while thicker ceramics provide mechanical strength in demanding modules. Multilayer designs add routing and integration capability but require tight control of shrinkage and metallization. Direct-bonded-copper and other metalized AlN structures are especially important in power electronics because they combine electrical isolation with high current handling and heat spreading.

Asia Pacific has the deepest manufacturing ecosystem because major ceramic suppliers, semiconductor packaging companies and electronics manufacturers are concentrated in Japan, China and South Korea. KYOCERA and other established suppliers compete with Chinese companies expanding capacity and lowering production cost. North America and Europe remain important end markets through aerospace, defense, 5G and automotive power electronics, where reliability and qualification can support premium pricing.

Segment Analysis: By Type

By type, the market is segmented into substrate thickness ≤0.5mm and substrate thickness >0.5mm. Thin substrates lead because compact communication devices, LEDs and miniaturized semiconductor modules benefit from reduced package height and shorter thermal paths. Thicker substrates remain important where mechanical rigidity, high-voltage isolation or large power modules require greater structural strength. The selection balances thermal resistance, warpage, handling and metallization requirements.

Type Technical / commercial role Market position
Substrate Thickness ≤0.5mm Thin AlN package structures for compact RF, LED and semiconductor applications. Leading segment; strongest link to miniaturization and high power density.
Substrate Thickness >0.5mm More mechanically robust substrates for larger modules and demanding environments. Important in automotive, aerospace and high-power modules where rigidity and isolation matter.

Segment Analysis: By Application

Applications include automotive electronics, communication devices, aeronautics and astronautics, high-power LEDs, consumer electronics and other high-heat-flux systems. Communication devices represent the largest application because RF power amplifiers and 5G infrastructure require compact packages with strong heat dissipation. Automotive electronics is one of the fastest-growth areas as SiC and GaN power modules expand in traction inverters, onboard chargers and high-voltage electrical systems.

Application Demand characteristics
Automotive Electronics EV power modules, onboard chargers, DC-DC converters and high-reliability control electronics.
Communication Devices Largest application; RF power devices and 5G infrastructure need high thermal conductivity.
Aeronautics & Astronautics High-reliability electronics exposed to thermal cycling and demanding environments.
High Power LED Thermal management for high-brightness lighting and specialty emitters.
Consumer Electronics Selected compact high-power devices requiring thin electrically insulating substrates.
Others Industrial power, laser, sensor and specialty semiconductor packages.

Segment Analysis: By End-User Industry

End users include semiconductor manufacturers, electronics manufacturers, aerospace and defense companies, telecom equipment suppliers and other high-power electronics customers. Semiconductor customers use AlN where device performance is limited by heat, while telecom and automotive customers value both thermal conductivity and electrical isolation. Aerospace and defense purchase smaller volumes but require rigorous thermal-cycling and reliability performance. The end-user mix therefore balances high-volume electronics with lower-volume premium applications.

End-User Industry Demand logic
Semiconductor Industry Largest technical demand for high-power and high-frequency device packaging.
Electronics Manufacturing High-volume packaging across LED, power and specialty electronics.
Aerospace & Defense Premium reliability, thermal cycling and long service life.
Telecommunications 5G base stations and RF power modules.
Others Industrial, laser and energy applications.

Segment Analysis: By Package Architecture

Package architecture determines how AlN’s thermal performance is converted into system-level value. Single-layer ceramics are simple and cost-effective for direct die attachment or simple circuits. Multilayer packages support denser routing and integrated functionality but require more complex co-firing or thick-film processing. Metalized and direct-bonded-copper AlN packages are critical in high-power modules because they combine the insulating ceramic with thick conductive copper paths capable of carrying substantial current.

Package Architecture Commercial role
Single-Layer Ceramic Packages Simple high-thermal-conductivity substrates for LEDs and discrete high-power devices.
Multilayer Ceramic Packages Higher integration, routing density and hermetic package capability.
Metalized / DBC AlN Packages Power modules requiring strong heat spreading and high current handling.

Aluminum Nitride Ceramic Package Market Outlook

Regional Analysis

Asia Pacific is the largest and fastest-growing regional market, supported by Japanese ceramic technology and China’s large electronics, semiconductor and EV manufacturing base. The source market context indicates Japan and China together account for more than 60% of manufacturing capacity. North America benefits from defense, aerospace and semiconductor localization, while Europe is supported by automotive electrification and industrial power electronics.

Regional competition is shaped by manufacturing know-how and end-market specialization. Japan remains strong in precision ceramics, while China is scaling cost-competitive production. South Korea and Taiwan contribute semiconductor and electronics demand. North America purchases high-reliability packages for RF, defense and domestic semiconductor programs, and Europe’s automotive and power-semiconductor sectors create demand for metalized AlN substrates. Supply qualification remains important because material properties and metallization must remain consistent across long customer programs.

Region Position Growth outlook Demand profile Supplier-selection factor
Asia Pacific Largest High Electronics, semiconductor, EV Scale, quality and cost
North America High-value Moderate-High Defense, RF, semiconductor Reliability and domestic supply
Europe Established Moderate-High Automotive and power electronics Thermal cycling and qualification
South America Small Selective Industrial electronics Import cost
Middle East & Africa Emerging Selective Defense, telecom, energy Technical support
Asia PacificLARGEST

What defines demand in Asia Pacific?

Asia Pacific leads through the combination of Japanese precision-ceramic suppliers, Chinese capacity expansion and large semiconductor, telecom and EV manufacturing bases. Japan and China together account for a majority of production capacity in the underlying market context. The region’s density of packaging customers allows suppliers to scale thin substrates, multilayer structures and metalized power packages close to high-volume electronics manufacturing.

PositionLargest
Capacity indicatorJapan + China >60%
Demand baseSemiconductor + EV + telecom
Key hubsJapan, China, Korea
Country / subregion Role Demand logic
Japan Technology leader KYOCERA and advanced ceramic know-how support premium products.
China Capacity growth Electronics and EV manufacturing support rapid scaling.
South Korea / Taiwan Semiconductor hubs High-power and RF packaging create qualified demand.

Regional demand is shaped by the local concentration of customers, supplier service capability and the availability of qualified technical support. Companies that can shorten lead times, maintain local application engineering and support product changes during the customer lifecycle are better positioned to convert market growth into durable share. These factors matter most in technically demanding markets where a design change can affect validation, uptime or manufacturing yield.

North AmericaHIGH-VALUE

What defines demand in North America?

North America is a high-value market for aerospace, defense, RF communications and semiconductor manufacturing. U.S. customers often require domestic or secure supply for critical electronics and place a premium on documented thermal performance and reliability. Semiconductor investment can also increase demand for advanced package substrates and ceramic components. Volumes are lower than Asia, but application value per package can be high.

PositionHigh-value
Demand baseDefense + RF + semiconductors
Commercial focusReliability and domestic supply
Primary hubUnited States
Country / subregion Role Demand logic
United States Primary market Defense, RF and high-power electronics create premium demand.
Canada Aerospace / research Smaller specialty applications.
Mexico Electronics manufacturing Downstream assembly supports selected package demand.

Regional demand is shaped by the local concentration of customers, supplier service capability and the availability of qualified technical support. Companies that can shorten lead times, maintain local application engineering and support product changes during the customer lifecycle are better positioned to convert market growth into durable share. These factors matter most in technically demanding markets where a design change can affect validation, uptime or manufacturing yield.

EuropeESTABLISHED

What defines demand in Europe?

Europe is an established market led by automotive electrification, industrial power electronics and specialty semiconductor applications. German automotive and power-electronics customers increasingly use SiC and GaN devices that require efficient thermal packaging. European buyers emphasize thermal cycling, traceability and environmental compliance. The market is therefore attractive for high-reliability AlN substrates even though overall electronics manufacturing volume is below Asia Pacific.

PositionEstablished
Demand baseAutomotive + power
Commercial focusThermal cycling
Key hubsGermany, France, Italy
Country / subregion Role Demand logic
Germany Automotive / power EV and industrial electronics support metalized AlN demand.
France Aerospace / semiconductor High-reliability electronics create premium applications.
Italy / rest Industrial Power conversion and specialty electronics support demand.

Regional demand is shaped by the local concentration of customers, supplier service capability and the availability of qualified technical support. Companies that can shorten lead times, maintain local application engineering and support product changes during the customer lifecycle are better positioned to convert market growth into durable share. These factors matter most in technically demanding markets where a design change can affect validation, uptime or manufacturing yield.

South AmericaSMALL

What defines demand in South America?

South America is a small market for AlN packages because semiconductor and power-module manufacturing is limited. Brazil provides the largest industrial-electronics base, while other countries rely mainly on imported finished components. Direct package demand is therefore project based and sensitive to landed cost. Growth depends on whether EV, renewable-energy and advanced-electronics manufacturing expands locally over the forecast period.

PositionSmall
Demand baseIndustrial electronics
Commercial focusImport economics
Primary hubBrazil
Country / subregion Role Demand logic
Brazil Primary market Industrial and automotive electronics create selective demand.
Argentina Niche Research and industrial use remain limited.
Rest of region Small Most AlN enters in imported modules.

Regional demand is shaped by the local concentration of customers, supplier service capability and the availability of qualified technical support. Companies that can shorten lead times, maintain local application engineering and support product changes during the customer lifecycle are better positioned to convert market growth into durable share. These factors matter most in technically demanding markets where a design change can affect validation, uptime or manufacturing yield.

Middle East & AfricaEMERGING

What defines demand in Middle East & Africa?

Middle East & Africa is an emerging market where demand comes from telecom, defense, renewable energy and selected technology projects. Israel has the strongest advanced-electronics base, while Gulf states are investing in communications and energy infrastructure. Most AlN packages are imported, so supplier support and technical qualification matter more than local production scale. High-temperature environments can strengthen the value proposition for efficient thermal management.

PositionEmerging
Demand baseTelecom + defense + energy
Commercial focusThermal reliability
Key hubsIsrael, Gulf
Country / subregion Role Demand logic
Israel Technology hub Defense and semiconductor activity create specialized demand.
UAE / Saudi Arabia Infrastructure Telecom and energy projects support future opportunity.
Rest of region Selective Limited local packaging production.

Regional demand is shaped by the local concentration of customers, supplier service capability and the availability of qualified technical support. Companies that can shorten lead times, maintain local application engineering and support product changes during the customer lifecycle are better positioned to convert market growth into durable share. These factors matter most in technically demanding markets where a design change can affect validation, uptime or manufacturing yield.

Competitive Landscape

Competition in the Aluminum Nitride Ceramic Package market is shaped by technology performance, customer qualification, application engineering and continuity of supply. Leading companies use product breadth and global support to win large programs, while specialist suppliers can defend attractive niches through deeper technical performance in specific applications. As the market expands, customers increasingly evaluate total system value and lifecycle support rather than relying only on initial component price.

The leading suppliers compete through a combination of proprietary technology, manufacturing scale and customer relationships. In the Aluminum Nitride Ceramic Package market, design wins can remain in place for several product generations because switching suppliers often requires requalification, software changes or manufacturing adjustments. This creates durable revenue positions for vendors that deliver reliable performance and responsive technical support.

Regional suppliers can still gain share where local availability, cost and fast engineering response matter. Their strongest opportunities are generally in standardized or mature applications, while the highest-performance segments remain concentrated among companies with deeper intellectual property, process control and qualification histories. This creates a market structure with both global platform leaders and specialized regional competitors.

Competitive strategy is increasingly moving toward integrated solutions. Customers prefer suppliers that can combine the core product with software, interface components, testing, support or adjacent technologies because integration reduces project risk and development time. Companies able to solve a broader customer problem therefore have more pricing power than vendors competing only on a single specification.

Competitive tier Representative companies Competitive basis
Global technology leaders KYOCERA Corporation, ChaoZhou Three-circle Group, Hebei Sinopack Electronic Technology, Yixing Electronic Scale, broad product portfolios, strong R&D and global customer support.
Established specialists LEATEC Fine Ceramics, MARUWA, NGK Electronics Devices, CeramTec Application-specific engineering and strong qualification in selected segments.
Regional / emerging suppliers Rogers Corporation, Toshiba Materials Local service, competitive pricing and focused customer relationships.

Key Participants

The profiled competitive set includes KYOCERA Corporation, ChaoZhou Three-circle Group, Hebei Sinopack Electronic Technology, Yixing Electronic, LEATEC Fine Ceramics, MARUWA, NGK Electronics Devices, CeramTec, Rogers Corporation, Toshiba Materials. Supplier position depends on engineering performance, customer qualification, manufacturing continuity and the ability to support design changes over long product cycles. Larger vendors benefit from broad portfolios and application teams, while specialists can retain strong positions in narrow, technically demanding subsegments where historical qualification and process know-how create meaningful switching costs.

Production Capacity Analysis

Production capacity for Aluminum Nitride Ceramic Package is constrained by the combination of specialized equipment, qualified materials, process know-how and customer-specific validation. Nominal factory output can overstate commercial supply because a new line or material source must often demonstrate consistent performance before it can serve high-value customers. This makes qualified capacity more important than raw nameplate capacity.

Regional manufacturing and service capacity influence lead time and resilience. Customers increasingly prefer suppliers that can support major production clusters from more than one site, reducing exposure to logistics disruption and single-factory events. At the same time, duplicating specialized processes can be difficult because equipment recipes, trained engineers and quality systems must be transferred without changing product performance.

The strongest capacity investments are aligned with structural demand drivers rather than short-term cycles. Suppliers expanding around AI, advanced semiconductor manufacturing, automotive electronics or industrial automation seek to secure positions before customer volumes scale. Effective capacity therefore includes engineering resources, test capability and local technical support in addition to physical manufacturing equipment.

Capacity factor Market implication
Specialized manufacturing Determines qualified output and technical performance.
Critical materials / components Can constrain supply despite available factory floor space.
Qualification and test Controls how quickly new capacity becomes usable by customers.
Regional support Improves lead time, resilience and customer retention.

Market Dynamics

The Aluminum Nitride Ceramic Package market is driven by higher system performance, automation, digitalization and expanding use in high-value applications. Growth is moderated by development cost, qualification requirements and supply-chain concentration. The strongest opportunities occur where new architectures or applications create a clear performance advantage and where suppliers can reduce integration complexity for customers.

MARKET DRIVERS

Driver Relative impact Commercial mechanism
Structural end-market growth High Expanding deployments increase unit demand and installed-base requirements.
Technology upgrade cycle High Higher performance raises value per product and accelerates replacement.
Customer integration needs Medium-High Validated solutions reduce engineering time and project risk.
Regional capacity expansion Medium New manufacturing clusters create local supplier demand.

Structural end-market expansion

Growth in the Aluminum Nitride Ceramic Package market is supported by rising deployment across its principal applications. Customers are investing because the technology improves performance, efficiency, automation or product capability in ways that are difficult to replicate with older approaches. This expands both new-system demand and the installed base that later requires replacement, upgrades or related services.

Higher technical requirements increase value per system

New product generations demand tighter performance, greater integration and better reliability. These requirements can increase selling prices even when unit volumes grow more slowly, because customers are willing to pay for solutions that protect yield, uptime or user experience. Suppliers with stronger engineering capability therefore benefit disproportionately from technology transitions.

Regional investment broadens customer access

Manufacturing and infrastructure investment in North America, Europe and Asia is creating additional customer clusters outside traditional centers. Local engineering support and shorter supply chains help suppliers qualify products earlier in new projects, creating an opportunity to win design positions before production reaches full scale.

MARKET RESTRAINTS

Restraint Relative impact Commercial mechanism
Development and qualification cost High Raises barriers to entry and lengthens customer adoption.
Supply-chain concentration Medium-High Critical components or materials can limit output.
Price pressure Medium Customers seek lower total system cost as volumes increase.
Technology substitution Medium Alternative architectures can replace incumbent solutions in selected uses.

Qualification slows supplier switching

Customers in technical markets cannot change suppliers based only on purchase price. New products must demonstrate performance, reliability and compatibility in the actual application, which can require months of engineering work. This limits the pace at which new entrants gain share and can delay commercialization of technically promising products.

Specialized inputs can constrain supply

Advanced products depend on a limited number of qualified materials, components or manufacturing tools. Shortages or long lead times at one upstream stage can restrict finished-product output even when downstream assembly capacity is available. Suppliers therefore carry strategic inventory or qualify alternate sources, but those actions increase cost.

Customer cost pressure remains persistent

As a technology becomes more widely adopted, customers expect lower unit costs and may redesign systems to use standardized components. Suppliers must offset this pressure through better performance, lower manufacturing cost and additional software or service value. Vendors that cannot maintain differentiation can face margin erosion even in a growing market.

MARKET OPPORTUNITIES

SiC and GaN power modules

Wide-bandgap devices switch at higher voltage and power density, increasing heat flux inside traction inverters, chargers and industrial converters. AlN packages can provide both insulation and strong thermal conduction, making them attractive where conventional alumina creates excessive thermal resistance. Suppliers that pair AlN with thick copper or advanced metallization can capture premium module designs.

5G RF power packaging

Base-station power amplifiers and other RF components generate concentrated heat in compact modules. AlN can reduce junction temperature and support stable RF performance, creating opportunities in high-power communication devices. The value proposition strengthens as radios become smaller and operators seek to reduce cooling energy at sites with dense active-antenna equipment.

Thin and multilayer ceramic packages

Miniaturization creates demand for thinner ceramics with tighter flatness and shrinkage control. Suppliers that can manufacture sub-0.5 mm AlN reliably and combine it with multilayer routing can expand beyond simple substrates into higher-value packages. This requires process control but can increase customer switching costs once the package is qualified.

Localized high-reliability supply

Automotive, defense and semiconductor customers increasingly value regional supply resilience. New production or finishing capacity near North American and European customers can reduce logistics risk and support faster qualification. The opportunity is strongest in programs where component volumes are moderate but downtime or requalification costs are high.

Supply Chain Analysis

Stage 1
Specialized materials and components
Stage 2
Core product manufacturing
Stage 3
Qualification and system integration
Stage 4
End-user deployment, service and replacement

The upstream supply chain provides the specialized materials, semiconductor devices, mechanical components or substrates that determine baseline product performance. Qualified inputs are important because changes in composition or manufacturing source can alter reliability, electrical behavior or process compatibility. Suppliers therefore maintain close technical relationships with upstream partners and often approve alternate sources before a disruption occurs.

Manufacturing converts these inputs into finished products using process-specific equipment, inspection and test. Quality systems are central because customers expect lot-to-lot consistency and traceability, particularly in semiconductor, automotive and industrial applications. High-value suppliers differentiate through process control rather than simple assembly scale, and they invest heavily in metrology or validation to protect yield.

Downstream value is created when the product is integrated into the customer system and validated under real operating conditions. Application engineers support installation, software, calibration or process optimization, while service teams maintain the installed base. This lifecycle relationship creates recurring revenue through replacement, updates, refurbishment or expansion and makes customer support an important part of the market structure.

Recent Developments

2026 – AlN packaging demand rises with SiC and GaN power electronics

Wide-bandgap power devices continue moving into EV, industrial and energy systems, increasing the need for electrically insulating ceramic packages with strong thermal conductivity and thermal-cycle reliability. Source

2026 – KYOCERA continues commercial AlN substrate portfolio

KYOCERA’s current advanced-ceramic portfolio includes aluminum-nitride substrates designed for thermal management in semiconductor and electronic applications, reinforcing AlN’s role in high-power packaging. Source

2026 – High-power communications and automotive remain core demand areas

5G RF modules and EV power electronics continue to increase heat flux, supporting adoption of thinner and metalized AlN package structures where alumina cannot provide adequate thermal performance. Source

REPORT SCOPE & SEGMENTATION

Base Year 2025
Estimated Year 2026
Forecast Year 2034
2025 Market Size USD 289.7 million
2026 Market Size USD 303.1 million
2034 Market Size USD 434.4 million
CAGR 4.6% during 2026–2034
Largest Market / Leading Geography Asia Pacific
By Type Substrate Thickness ≤0.5mm; Substrate Thickness >0.5mm
By Application Automotive Electronics; Communication Devices; Aeronautics & Astronautics; High Power LED; Consumer Electronics; Others
By End-User Industry Semiconductor Industry; Electronics Manufacturing; Aerospace & Defense; Telecommunications; Others
By Package Architecture Single-Layer Ceramic Packages; Multilayer Ceramic Packages; Metalized / DBC AlN Packages

Frequently Asked Questions

What is the size of the Aluminum Nitride Ceramic Package market?

The market is estimated at USD 303.1 million in 2026 and is projected to reach USD 434.4 million by 2034, representing a 4.6% CAGR during 2026–2034.

Which type leads the market?

Substrates with thickness of 0.5 mm or less lead because miniaturized RF, LED and semiconductor packages benefit from lower package height and shorter thermal paths.

Which application is largest?

Communication devices are the largest application because high-power RF and 5G components require strong thermal dissipation and electrical isolation.

Which region leads the market?

Asia Pacific leads through major production capacity in Japan and China and strong semiconductor, telecom and automotive-electronics demand.

Why is AlN used in advanced packaging?

AlN combines high thermal conductivity with electrical insulation and thermal expansion characteristics suitable for high-power semiconductor packages.

What are the main restraints?

Higher material cost than alumina, complex metallization, process control requirements and competition from alternative thermal-management materials are the main restraints.

Research Sources & Evidence Base

View research sources used for this overview
  1. KYOCERA. Aluminum Nitride Substrates, commercial AlN substrate and thermal-management applications.
  2. CeramTec. Aluminum Nitride, material properties and industrial electronics applications.
Aluminum Nitride Ceramic Package Market, Trends, Business Strategies 2026-2034

Get Sample Report PDF for Exclusive Insights

Report Sample Includes

  • Table of Contents
  • List of Tables & Figures
  • Charts, Research Methodology, and more...

Download Sample Report PDF

Download Sample Report

Table of Content

1 Introduction to Research & Analysis Reports
1.1 Aluminum Nitride Ceramic Package Market Definition
1.2 Market Segments
1.2.1 Segment by Type
1.2.2 Segment by Application
1.3 Global Aluminum Nitride Ceramic Package Market Overview
1.4 Features & Benefits of This Report
1.5 Methodology & Sources of Information
1.5.1 Research Methodology
1.5.2 Research Process
1.5.3 Base Year
1.5.4 Report Assumptions & Caveats
2 Global Aluminum Nitride Ceramic Package Overall Market Size
2.1 Global Aluminum Nitride Ceramic Package Market Size: 2024 VS 2032
2.2 Global Aluminum Nitride Ceramic Package Market Size, Prospects & Forecasts: 2020-2032
2.3 Key Market Trends, Opportunity, Drivers and Restraints
2.3.1 Market Opportunities & Trends
2.3.2 Market Drivers
2.3.3 Market Restraints
3 Company Landscape
3.1 Top Aluminum Nitride Ceramic Package Players in Global Market
3.2 Top Global Aluminum Nitride Ceramic Package Companies Ranked by Revenue
3.3 Global Aluminum Nitride Ceramic Package Revenue by Companies
3.4 Top 3 and Top 5 Aluminum Nitride Ceramic Package Companies in Global Market, by Revenue in 2024
3.5 Global Companies Aluminum Nitride Ceramic Package Product Type
3.6 Tier 1, Tier 2, and Tier 3 Aluminum Nitride Ceramic Package Players in Global Market
3.6.1 List of Global Tier 1 Aluminum Nitride Ceramic Package Companies
3.6.2 List of Global Tier 2 and Tier 3 Aluminum Nitride Ceramic Package Companies
4 Sights by Product
4.1 Overview
4.1.1 Segmentation by Type – Global Aluminum Nitride Ceramic Package Market Size Markets, 2024 & 2032
4.1.2 Substrate Thickness ?0.5mm
4.1.3 Substrate Thickness ?0.5mm
4.2 Segmentation by Type – Global Aluminum Nitride Ceramic Package Revenue & Forecasts
4.2.1 Segmentation by Type – Global Aluminum Nitride Ceramic Package Revenue, 2020-2025
4.2.2 Segmentation by Type – Global Aluminum Nitride Ceramic Package Revenue, 2026-2032
4.2.3 Segmentation by Type – Global Aluminum Nitride Ceramic Package Revenue Market Share, 2020-2032
5 Sights by Application
5.1 Overview
5.1.1 Segmentation by Application – Global Aluminum Nitride Ceramic Package Market Size, 2024 & 2032
5.1.2 Automotive Electronics
5.1.3 Communication Devices
5.1.4 Aeronautics and Astronautics
5.1.5 High Power LED
5.1.6 Consumer Electronics
5.1.7 Others
5.2 Segmentation by Application – Global Aluminum Nitride Ceramic Package Revenue & Forecasts
5.2.1 Segmentation by Application – Global Aluminum Nitride Ceramic Package Revenue, 2020-2025
5.2.2 Segmentation by Application – Global Aluminum Nitride Ceramic Package Revenue, 2026-2032
5.2.3 Segmentation by Application – Global Aluminum Nitride Ceramic Package Revenue Market Share, 2020-2032
6 Sights by Region
6.1 By Region – Global Aluminum Nitride Ceramic Package Market Size, 2024 & 2032
6.2 By Region – Global Aluminum Nitride Ceramic Package Revenue & Forecasts
6.2.1 By Region – Global Aluminum Nitride Ceramic Package Revenue, 2020-2025
6.2.2 By Region – Global Aluminum Nitride Ceramic Package Revenue, 2026-2032
6.2.3 By Region – Global Aluminum Nitride Ceramic Package Revenue Market Share, 2020-2032
6.3 North America
6.3.1 By Country – North America Aluminum Nitride Ceramic Package Revenue, 2020-2032
6.3.2 United States Aluminum Nitride Ceramic Package Market Size, 2020-2032
6.3.3 Canada Aluminum Nitride Ceramic Package Market Size, 2020-2032
6.3.4 Mexico Aluminum Nitride Ceramic Package Market Size, 2020-2032
6.4 Europe
6.4.1 By Country – Europe Aluminum Nitride Ceramic Package Revenue, 2020-2032
6.4.2 Germany Aluminum Nitride Ceramic Package Market Size, 2020-2032
6.4.3 France Aluminum Nitride Ceramic Package Market Size, 2020-2032
6.4.4 U.K. Aluminum Nitride Ceramic Package Market Size, 2020-2032
6.4.5 Italy Aluminum Nitride Ceramic Package Market Size, 2020-2032
6.4.6 Russia Aluminum Nitride Ceramic Package Market Size, 2020-2032
6.4.7 Nordic Countries Aluminum Nitride Ceramic Package Market Size, 2020-2032
6.4.8 Benelux Aluminum Nitride Ceramic Package Market Size, 2020-2032
6.5 Asia
6.5.1 By Region – Asia Aluminum Nitride Ceramic Package Revenue, 2020-2032
6.5.2 China Aluminum Nitride Ceramic Package Market Size, 2020-2032
6.5.3 Japan Aluminum Nitride Ceramic Package Market Size, 2020-2032
6.5.4 South Korea Aluminum Nitride Ceramic Package Market Size, 2020-2032
6.5.5 Southeast Asia Aluminum Nitride Ceramic Package Market Size, 2020-2032
6.5.6 India Aluminum Nitride Ceramic Package Market Size, 2020-2032
6.6 South America
6.6.1 By Country – South America Aluminum Nitride Ceramic Package Revenue, 2020-2032
6.6.2 Brazil Aluminum Nitride Ceramic Package Market Size, 2020-2032
6.6.3 Argentina Aluminum Nitride Ceramic Package Market Size, 2020-2032
6.7 Middle East & Africa
6.7.1 By Country – Middle East & Africa Aluminum Nitride Ceramic Package Revenue, 2020-2032
6.7.2 Turkey Aluminum Nitride Ceramic Package Market Size, 2020-2032
6.7.3 Israel Aluminum Nitride Ceramic Package Market Size, 2020-2032
6.7.4 Saudi Arabia Aluminum Nitride Ceramic Package Market Size, 2020-2032
6.7.5 UAE Aluminum Nitride Ceramic Package Market Size, 2020-2032
7 Companies Profiles
7.1 KYOCERA Corporation
7.1.1 KYOCERA Corporation Corporate Summary
7.1.2 KYOCERA Corporation Business Overview
7.1.3 KYOCERA Corporation Aluminum Nitride Ceramic Package Major Product Offerings
7.1.4 KYOCERA Corporation Aluminum Nitride Ceramic Package Revenue in Global Market (2020-2025)
7.1.5 KYOCERA Corporation Key News & Latest Developments
7.2 ChaoZhou Three-circle (Group)
7.2.1 ChaoZhou Three-circle (Group) Corporate Summary
7.2.2 ChaoZhou Three-circle (Group) Business Overview
7.2.3 ChaoZhou Three-circle (Group) Aluminum Nitride Ceramic Package Major Product Offerings
7.2.4 ChaoZhou Three-circle (Group) Aluminum Nitride Ceramic Package Revenue in Global Market (2020-2025)
7.2.5 ChaoZhou Three-circle (Group) Key News & Latest Developments
7.3 Hebei Sinopack Electronic Tecnology Co.Ltd
7.3.1 Hebei Sinopack Electronic Tecnology Co.Ltd Corporate Summary
7.3.2 Hebei Sinopack Electronic Tecnology Co.Ltd Business Overview
7.3.3 Hebei Sinopack Electronic Tecnology Co.Ltd Aluminum Nitride Ceramic Package Major Product Offerings
7.3.4 Hebei Sinopack Electronic Tecnology Co.Ltd Aluminum Nitride Ceramic Package Revenue in Global Market (2020-2025)
7.3.5 Hebei Sinopack Electronic Tecnology Co.Ltd Key News & Latest Developments
7.4 Yixing Electronic
7.4.1 Yixing Electronic Corporate Summary
7.4.2 Yixing Electronic Business Overview
7.4.3 Yixing Electronic Aluminum Nitride Ceramic Package Major Product Offerings
7.4.4 Yixing Electronic Aluminum Nitride Ceramic Package Revenue in Global Market (2020-2025)
7.4.5 Yixing Electronic Key News & Latest Developments
7.5 LEATEC Fine Ceramics
7.5.1 LEATEC Fine Ceramics Corporate Summary
7.5.2 LEATEC Fine Ceramics Business Overview
7.5.3 LEATEC Fine Ceramics Aluminum Nitride Ceramic Package Major Product Offerings
7.5.4 LEATEC Fine Ceramics Aluminum Nitride Ceramic Package Revenue in Global Market (2020-2025)
7.5.5 LEATEC Fine Ceramics Key News & Latest Developments
7.6 Shengda Technology
7.6.1 Shengda Technology Corporate Summary
7.6.2 Shengda Technology Business Overview
7.6.3 Shengda Technology Aluminum Nitride Ceramic Package Major Product Offerings
7.6.4 Shengda Technology Aluminum Nitride Ceramic Package Revenue in Global Market (2020-2025)
7.6.5 Shengda Technology Key News & Latest Developments
8 Conclusion
9 Appendix
9.1 Note
9.2 Examples of Clients
9.3 DisclaimerList of Tables
Table 1. Aluminum Nitride Ceramic Package Market Opportunities & Trends in Global Market
Table 2. Aluminum Nitride Ceramic Package Market Drivers in Global Market
Table 3. Aluminum Nitride Ceramic Package Market Restraints in Global Market
Table 4. Key Players of Aluminum Nitride Ceramic Package in Global Market
Table 5. Top Aluminum Nitride Ceramic Package Players in Global Market, Ranking by Revenue (2024)
Table 6. Global Aluminum Nitride Ceramic Package Revenue by Companies, (US$, Mn), 2020-2025
Table 7. Global Aluminum Nitride Ceramic Package Revenue Share by Companies, 2020-2025
Table 8. Global Companies Aluminum Nitride Ceramic Package Product Type
Table 9. List of Global Tier 1 Aluminum Nitride Ceramic Package Companies, Revenue (US$, Mn) in 2024 and Market Share
Table 10. List of Global Tier 2 and Tier 3 Aluminum Nitride Ceramic Package Companies, Revenue (US$, Mn) in 2024 and Market Share
Table 11. Segmentation by Type – Global Aluminum Nitride Ceramic Package Revenue, (US$, Mn), 2024 & 2032
Table 12. Segmentation by Type – Global Aluminum Nitride Ceramic Package Revenue (US$, Mn), 2020-2025
Table 13. Segmentation by Type – Global Aluminum Nitride Ceramic Package Revenue (US$, Mn), 2026-2032
Table 14. Segmentation by Application– Global Aluminum Nitride Ceramic Package Revenue, (US$, Mn), 2024 & 2032
Table 15. Segmentation by Application – Global Aluminum Nitride Ceramic Package Revenue, (US$, Mn), 2020-2025
Table 16. Segmentation by Application – Global Aluminum Nitride Ceramic Package Revenue, (US$, Mn), 2026-2032
Table 17. By Region– Global Aluminum Nitride Ceramic Package Revenue, (US$, Mn), 2024 & 2032
Table 18. By Region – Global Aluminum Nitride Ceramic Package Revenue, (US$, Mn), 2020-2025
Table 19. By Region – Global Aluminum Nitride Ceramic Package Revenue, (US$, Mn), 2026-2032
Table 20. By Country – North America Aluminum Nitride Ceramic Package Revenue, (US$, Mn), 2020-2025
Table 21. By Country – North America Aluminum Nitride Ceramic Package Revenue, (US$, Mn), 2026-2032
Table 22. By Country – Europe Aluminum Nitride Ceramic Package Revenue, (US$, Mn), 2020-2025
Table 23. By Country – Europe Aluminum Nitride Ceramic Package Revenue, (US$, Mn), 2026-2032
Table 24. By Region – Asia Aluminum Nitride Ceramic Package Revenue, (US$, Mn), 2020-2025
Table 25. By Region – Asia Aluminum Nitride Ceramic Package Revenue, (US$, Mn), 2026-2032
Table 26. By Country – South America Aluminum Nitride Ceramic Package Revenue, (US$, Mn), 2020-2025
Table 27. By Country – South America Aluminum Nitride Ceramic Package Revenue, (US$, Mn), 2026-2032
Table 28. By Country – Middle East & Africa Aluminum Nitride Ceramic Package Revenue, (US$, Mn), 2020-2025
Table 29. By Country – Middle East & Africa Aluminum Nitride Ceramic Package Revenue, (US$, Mn), 2026-2032
Table 30. KYOCERA Corporation Corporate Summary
Table 31. KYOCERA Corporation Aluminum Nitride Ceramic Package Product Offerings
Table 32. KYOCERA Corporation Aluminum Nitride Ceramic Package Revenue (US$, Mn) & (2020-2025)
Table 33. KYOCERA Corporation Key News & Latest Developments
Table 34. ChaoZhou Three-circle (Group) Corporate Summary
Table 35. ChaoZhou Three-circle (Group) Aluminum Nitride Ceramic Package Product Offerings
Table 36. ChaoZhou Three-circle (Group) Aluminum Nitride Ceramic Package Revenue (US$, Mn) & (2020-2025)
Table 37. ChaoZhou Three-circle (Group) Key News & Latest Developments
Table 38. Hebei Sinopack Electronic Tecnology Co.Ltd Corporate Summary
Table 39. Hebei Sinopack Electronic Tecnology Co.Ltd Aluminum Nitride Ceramic Package Product Offerings
Table 40. Hebei Sinopack Electronic Tecnology Co.Ltd Aluminum Nitride Ceramic Package Revenue (US$, Mn) & (2020-2025)
Table 41. Hebei Sinopack Electronic Tecnology Co.Ltd Key News & Latest Developments
Table 42. Yixing Electronic Corporate Summary
Table 43. Yixing Electronic Aluminum Nitride Ceramic Package Product Offerings
Table 44. Yixing Electronic Aluminum Nitride Ceramic Package Revenue (US$, Mn) & (2020-2025)
Table 45. Yixing Electronic Key News & Latest Developments
Table 46. LEATEC Fine Ceramics Corporate Summary
Table 47. LEATEC Fine Ceramics Aluminum Nitride Ceramic Package Product Offerings
Table 48. LEATEC Fine Ceramics Aluminum Nitride Ceramic Package Revenue (US$, Mn) & (2020-2025)
Table 49. LEATEC Fine Ceramics Key News & Latest Developments
Table 50. Shengda Technology Corporate Summary
Table 51. Shengda Technology Aluminum Nitride Ceramic Package Product Offerings
Table 52. Shengda Technology Aluminum Nitride Ceramic Package Revenue (US$, Mn) & (2020-2025)
Table 53. Shengda Technology Key News & Latest Developments

List of Figures
Figure 1. Aluminum Nitride Ceramic Package Product Picture
Figure 2. Aluminum Nitride Ceramic Package Segment by Type in 2024
Figure 3. Aluminum Nitride Ceramic Package Segment by Application in 2024
Figure 4. Global Aluminum Nitride Ceramic Package Market Overview: 2024
Figure 5. Key Caveats
Figure 6. Global Aluminum Nitride Ceramic Package Market Size: 2024 VS 2032 (US$, Mn)
Figure 7. Global Aluminum Nitride Ceramic Package Revenue: 2020-2032 (US$, Mn)
Figure 8. The Top 3 and 5 Players Market Share by Aluminum Nitride Ceramic Package Revenue in 2024
Figure 9. Segmentation by Type – Global Aluminum Nitride Ceramic Package Revenue, (US$, Mn), 2024 & 2032
Figure 10. Segmentation by Type – Global Aluminum Nitride Ceramic Package Revenue Market Share, 2020-2032
Figure 11. Segmentation by Application – Global Aluminum Nitride Ceramic Package Revenue, (US$, Mn), 2024 & 2032
Figure 12. Segmentation by Application – Global Aluminum Nitride Ceramic Package Revenue Market Share, 2020-2032
Figure 13. By Region – Global Aluminum Nitride Ceramic Package Revenue Market Share, 2020-2032
Figure 14. By Country – North America Aluminum Nitride Ceramic Package Revenue Market Share, 2020-2032
Figure 15. United States Aluminum Nitride Ceramic Package Revenue, (US$, Mn), 2020-2032
Figure 16. Canada Aluminum Nitride Ceramic Package Revenue, (US$, Mn), 2020-2032
Figure 17. Mexico Aluminum Nitride Ceramic Package Revenue, (US$, Mn), 2020-2032
Figure 18. By Country – Europe Aluminum Nitride Ceramic Package Revenue Market Share, 2020-2032
Figure 19. Germany Aluminum Nitride Ceramic Package Revenue, (US$, Mn), 2020-2032
Figure 20. France Aluminum Nitride Ceramic Package Revenue, (US$, Mn), 2020-2032
Figure 21. U.K. Aluminum Nitride Ceramic Package Revenue, (US$, Mn), 2020-2032
Figure 22. Italy Aluminum Nitride Ceramic Package Revenue, (US$, Mn), 2020-2032
Figure 23. Russia Aluminum Nitride Ceramic Package Revenue, (US$, Mn), 2020-2032
Figure 24. Nordic Countries Aluminum Nitride Ceramic Package Revenue, (US$, Mn), 2020-2032
Figure 25. Benelux Aluminum Nitride Ceramic Package Revenue, (US$, Mn), 2020-2032
Figure 26. By Region – Asia Aluminum Nitride Ceramic Package Revenue Market Share, 2020-2032
Figure 27. China Aluminum Nitride Ceramic Package Revenue, (US$, Mn), 2020-2032
Figure 28. Japan Aluminum Nitride Ceramic Package Revenue, (US$, Mn), 2020-2032
Figure 29. South Korea Aluminum Nitride Ceramic Package Revenue, (US$, Mn), 2020-2032
Figure 30. Southeast Asia Aluminum Nitride Ceramic Package Revenue, (US$, Mn), 2020-2032
Figure 31. India Aluminum Nitride Ceramic Package Revenue, (US$, Mn), 2020-2032
Figure 32. By Country – South America Aluminum Nitride Ceramic Package Revenue Market Share, 2020-2032
Figure 33. Brazil Aluminum Nitride Ceramic Package Revenue, (US$, Mn), 2020-2032
Figure 34. Argentina Aluminum Nitride Ceramic Package Revenue, (US$, Mn), 2020-2032
Figure 35. By Country – Middle East & Africa Aluminum Nitride Ceramic Package Revenue Market Share, 2020-2032
Figure 36. Turkey Aluminum Nitride Ceramic Package Revenue, (US$, Mn), 2020-2032
Figure 37. Israel Aluminum Nitride Ceramic Package Revenue, (US$, Mn), 2020-2032
Figure 38. Saudi Arabia Aluminum Nitride Ceramic Package Revenue, (US$, Mn), 2020-2032
Figure 39. UAE Aluminum Nitride Ceramic Package Revenue, (US$, Mn), 2020-2032
Figure 40. KYOCERA Corporation Aluminum Nitride Ceramic Package Revenue Year Over Year Growth (US$, Mn) & (2020-2025)
Figure 41. ChaoZhou Three-circle (Group) Aluminum Nitride Ceramic Package Revenue Year Over Year Growth (US$, Mn) & (2020-2025)
Figure 42. Hebei Sinopack Electronic Tecnology Co.Ltd Aluminum Nitride Ceramic Package Revenue Year Over Year Growth (US$, Mn) & (2020-2025)
Figure 43. Yixing Electronic Aluminum Nitride Ceramic Package Revenue Year Over Year Growth (US$, Mn) & (2020-2025)
Figure 44. LEATEC Fine Ceramics Aluminum Nitride Ceramic Package Revenue Year Over Year Growth (US$, Mn) & (2020-2025)
Figure 45. Shengda Technology Aluminum Nitride Ceramic Package Revenue Year Over Year Growth (US$, Mn) & (2020-2025)