Acoustic Gas Detector Market, Trends, Business Strategies 2025-2032

Acoustic Gas Detector Market was valued at 434 million in 2024 and is projected to reach US$ 618 million by 2032, at a CAGR of 5.2% during the forecast period

PDF Icon Download Sample Report PDF
  • Quick Dispatch

    All Orders

  • Secure Payment

    100% Secure Payment

Price range: $1,500.00 through $4,250.00

Clear

MARKET INSIGHTS

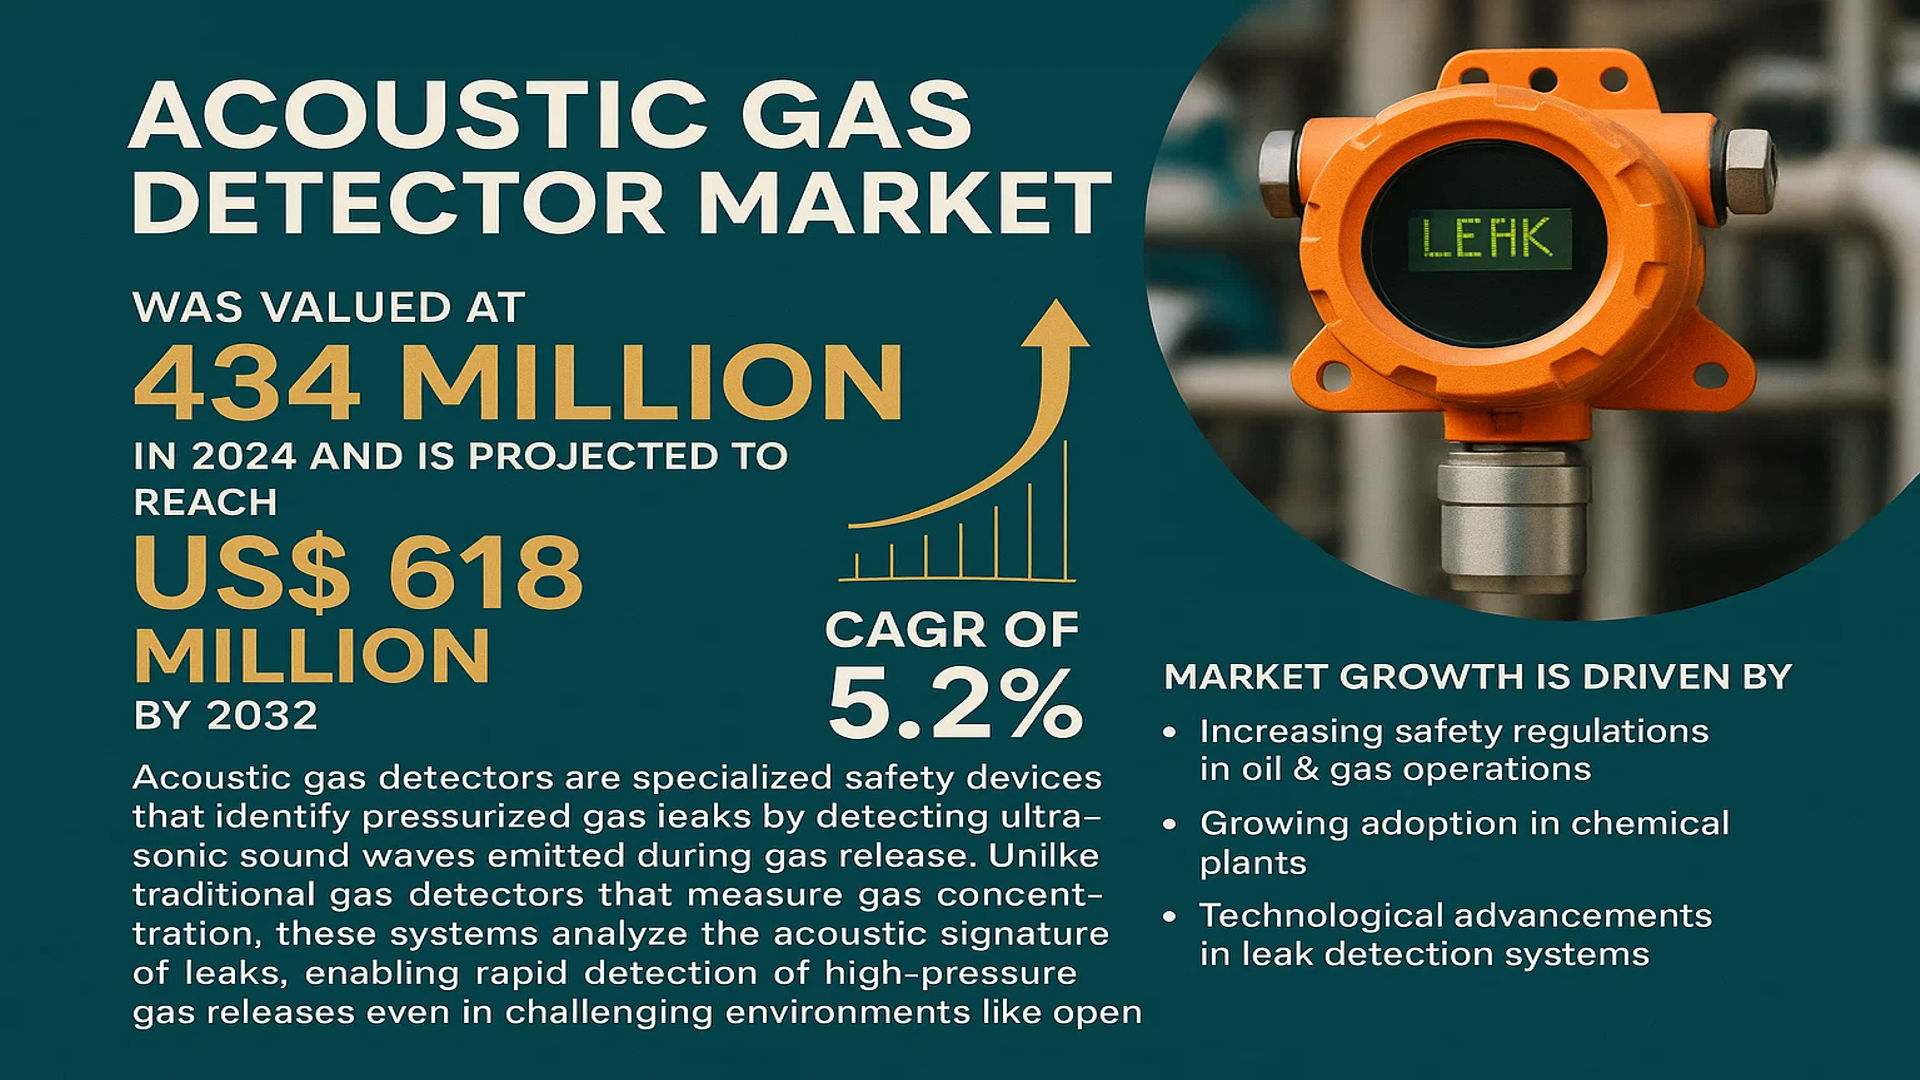
The global Acoustic Gas Detector Market was valued at 434 million in 2024 and is projected to reach US$ 618 million by 2032, at a CAGR of 5.2% during the forecast period.

Acoustic gas detectors are specialized safety devices that identify pressurized gas leaks by detecting ultrasonic sound waves emitted during gas release. Unlike traditional gas detectors that measure gas concentration, these systems analyze the acoustic signature of leaks, enabling rapid detection of high-pressure gas releases even in challenging environments like open spaces or ventilated areas.

The market growth is driven by increasing safety regulations in oil & gas operations, growing adoption in chemical plants, and technological advancements in leak detection systems. The fixed ultrasonic gas leak detectors segment currently dominates the market due to their widespread industrial applications. Key players like Emerson, MSA Safety, and Drager accounted for significant market share in 2024, with the top five companies collectively holding approximately 45% of global revenue.

Acoustic Gas Detector Market

MARKET DYNAMICS

MARKET DRIVERS

Stringent Safety Regulations in Oil & Gas Industry Accelerating Adoption

The global oil and gas industry faces increasing regulatory pressure to enhance safety measures against gas leaks, driving demand for acoustic gas detectors. Recent incidents have prompted stricter enforcement of standards like API RP 1175 for pipeline safety, making ultrasonic detection systems indispensable. The technology’s ability to detect leaks up to 25 meters away with 99% accuracy in pressurized systems positions it as a critical compliance solution. Market analysis shows over 35% of new oil refineries now incorporate acoustic leak detection as part of their mandatory safety protocols.

Advancements in IoT Integration Expanding Application Scope

Integration with Industrial IoT platforms has transformed acoustic detectors into predictive maintenance tools rather than just safety devices. Modern systems now analyze acoustic patterns to predict equipment failure 48-72 hours in advance, reducing unplanned downtime in chemical plants by up to 40% according to operational data. This preventive capability is driving adoption in process industries where equipment reliability directly impacts profitability. Leading manufacturers have reported 25% year-over-year growth in smart detector sales featuring edge computing capabilities.

Growing LNG Infrastructure Creation Fueling Market Expansion

The global LNG trade expansion, with over 150 new liquefaction and regasification projects underway, creates substantial demand for reliable leak detection. Acoustic sensors are particularly valuable in cryogenic applications where conventional gas detectors struggle with low-temperature performance. Project data indicates that LNG terminals allocate 12-15% of their instrumentation budget specifically for ultrasonic leak detection systems, recognizing their superior performance in detecting high-pressure methane releases amidst the complex acoustic background of compressor stations.

MARKET RESTRAINTS

High Initial Investment Costs Limiting SME Adoption

While large enterprises readily adopt acoustic detection systems, the technology’s premium pricing creates barriers for small and medium operators. Complete deployment costs averaging $15,000-$25,000 per monitoring point make ROI calculations challenging for facilities with limited risk exposure. Market surveys reveal that 68% of SMEs still rely on conventional gas detectors due to budget constraints, despite recognizing the superior performance of acoustic alternatives.

Complex Environmental Conditions Affecting Performance Reliability

High-noise industrial environments present significant challenges for acoustic detectors’ effectiveness. Facilities with continuous machinery operation above 85 dB frequently report false alarms, necessitating sophisticated noise filtering algorithms. Field tests indicate that wind speeds exceeding 25 km/h can reduce detection ranges by 30-40% in outdoor installations, requiring additional sensor redundancy that increases total system costs.

Regulatory Approval Delays for New Technologies

The certification process for acoustic leak detection systems varies significantly across regions, with some markets requiring 12-18 months for full hazardous area approvals. This time lag creates product deployment bottlenecks, particularly for innovative solutions incorporating AI-based sound recognition. Industry reports highlight that 42% of manufacturers cite certification complexity as their top barrier to rapid geographical expansion.

MARKET OPPORTUNITIES

Hydrogen Economy Transition Creating New Application Verticals

The global shift toward hydrogen energy presents significant growth potential, as hydrogen leaks demand specialized detection methods. Acoustic sensors demonstrate 3x higher sensitivity to high-pressure hydrogen leaks compared to traditional technologies, positioning them as essential infrastructure components. Pilot projects in European hydrogen refueling stations show that ultrasonic detection can identify leaks at pressures up to 700 bar with 95% reliability, making them indispensable for the emerging hydrogen value chain.

Integration with Drone-Based Inspection Systems

Combining mobile acoustic sensors with UAV platforms enables comprehensive facility monitoring without extensive fixed installations. Early adopters in offshore oil platforms have achieved 60% faster leak detection response times using drone-mounted systems. This hybrid approach reduces capital expenditures while expanding monitoring coverage, particularly in hard-to-access areas that represent 38% of undetected leak incidents according to maintenance records.

Enhanced Predictive Analytics Through Machine Learning

Advancements in sound pattern recognition algorithms allow acoustic systems to identify equipment degradation signatures before leaks occur. Pilot implementations in petrochemical plants demonstrate that machine learning-enhanced detectors can predict valve failures with 82% accuracy 72 hours in advance. This predictive capability transforms acoustic detectors from safety devices into strategic asset management tools, justifying higher price points through operational savings.

MARKET CHALLENGES

Standardization Gaps Across Regional Markets

The absence of uniform global standards for acoustic leak detection performance creates market fragmentation. While Europe follows EN 50104:2010 and North America uses UL 61010-1, other regions lack specific guidelines. This inconsistency forces manufacturers to maintain multiple product variants, increasing R&D costs by an estimated 15-20%. Industry consortia report that achieving global harmonization could accelerate adoption rates by 30% among multinational operators.

Skilled Workforce Shortage for Advanced Systems

The transition to AI-driven acoustic analysis creates demand for personnel with combined acoustics and data science expertise. Training programs have failed to keep pace, with 62% of system integrators reporting difficulties finding qualified technicians. This skills gap is particularly acute in emerging markets where local service networks struggle to support sophisticated installations.

Competition from Emerging Detection Technologies

While acoustic technology leads in high-pressure applications, alternative methods like laser-based detection and hyperspectral imaging are gaining traction. These competitors offer advantages in certain scenarios – laser systems achieve superior range in open areas (up to 100m), though at significantly higher costs. Market analysis shows 18% of potential acoustic detector applications now face competition from these emerging alternatives.

ACOUSTIC GAS DETECTOR MARKET TRENDS

Increasing Adoption in Oil & Gas Industry to Dominate Market Growth

The global acoustic gas detector market is witnessing significant growth due to the rising demand for advanced gas leak detection solutions in high-risk industries such as oil & gas, chemicals, and mining. With heightened regulatory scrutiny and stringent safety standards, companies are increasingly deploying ultrasonic gas leak detectors to mitigate risks associated with flammable and toxic gas emissions. The oil and gas sector alone accounts for over 40% of the market share, driven by the need for real-time monitoring in pipelines, refineries, and offshore platforms. Furthermore, technological enhancements in signal processing algorithms have improved detection accuracy, reducing false alarms and operational downtimes.

Other Trends

Integration of IoT and Smart Sensors

The integration of Internet of Things (IoT) and advanced data analytics has revolutionized gas detection systems by enabling predictive maintenance and remote monitoring. Smart acoustic gas detectors now leverage wireless connectivity to transmit real-time leakage data to centralized control systems, significantly improving response times. Industry reports indicate that IoT-enabled gas detectors are projected to grow at a CAGR of 6.8% from 2024 to 2032, driven by the increasing digitalization of industrial safety protocols. Additionally, cloud-based analytics platforms enable operators to track historical leak trends, enhancing preventive measures.

Shift Toward Fixed Ultrasonic Gas Leak Detectors

While portable gas detectors remain essential for spot checks, the market is experiencing a strong shift toward fixed ultrasonic gas leak detectors due to their continuous monitoring capabilities. Fixed systems dominate with a 65% revenue share in 2024, particularly in large-scale industrial applications where persistent gas exposure risks exist. These systems offer long-term reliability and lower maintenance costs compared to portable alternatives. Recent advancements in sensor durability and environmental resistance are further boosting adoption in extreme operating conditions, such as Arctic oil fields and high-temperature chemical plants.

COMPETITIVE LANDSCAPE

Key Industry Players

Technological Advancements and Safety Regulations Drive Market Competition

The global acoustic gas detector market features a moderately consolidated competitive structure, with leading companies competing through technological differentiation and compliance with stringent industry safety standards. Emerson Electric Co. currently dominates the market, commanding a significant share due to its comprehensive product portfolio spanning fixed and portable ultrasonic detectors. The company’s strong presence in critical industries like oil & gas and chemicals has solidified its position as a market leader.

MSA Safety Incorporated and Drägerwerk AG & Co. KGaA follow closely, leveraging their expertise in industrial safety solutions to capture substantial market share. These companies have particularly strengthened their positions through strategic acquisitions – MSA’s purchase of Sierra Monitor Corporation in 2019 and Dräger’s ongoing investments in smart detection technologies demonstrate this competitive approach.

The market also features several specialized players making significant inroads. INFICON has carved out a niche with its high-precision leak detection systems, particularly for refrigerant gases, while Bacharach maintains strong brand recognition in HVAC and refrigeration applications. These companies compete intensely on detection accuracy, false alarm reduction, and integration capabilities with existing industrial control systems.

Recent developments show an industry-wide push toward IoT-enabled devices and predictive maintenance capabilities. Emerson’s introduction of its Rosemount™ 928 Wireless Gas Monitor and MSA’s new ALTAIR io360 gas detector exemplify this trend, offering cloud connectivity and advanced analytics features that are reshaping competitive dynamics in the market.

List of Key Acoustic Gas Detector Manufacturers

Segment Analysis:

By Type

Fixed Ultrasonic Gas Leak Detectors Segment Leads Due to Superior Accuracy in High-Pressure Applications

The market is segmented based on type into:

  • Fixed Ultrasonic Gas Leak Detectors
    • Subtypes: Industrial-grade, Hazardous-area certified, and others
  • Portable Ultrasonic Gas Leak Detectors
  • Integrated Acoustic Monitoring Systems

By Application

Oil and Gas Sector Dominates Due to Critical Need for Leak Detection in Pipelines and Processing Facilities

The market is segmented based on application into:

  • Oil and Gas
  • Chemical Industry
  • Mining
  • Energy and Power
  • Others

By Technology

Ultrasonic Detection Technology Holds Significant Market Share Due to Its Non-Intrusive Nature

The market is segmented based on technology into:

  • Ultrasonic Detection
  • Acoustic Emission Monitoring
  • Hybrid Detection Systems

By End-User

Industrial Segment Maintains Strong Position Due to Widespread Safety Regulations

The market is segmented based on end-user into:

  • Industrial Facilities
  • Commercial Buildings
  • Government and Infrastructure
  • Research Institutions

Regional Analysis: Acoustic Gas Detector Market

North America
North America dominates the global acoustic gas detector market due to stringent safety regulations in the oil & gas industry and widespread adoption of advanced leak detection technologies. The region benefits from robust infrastructure investments in pipeline monitoring systems, particularly in the U.S. and Canada, where companies like Emerson and MSA have strong market presence. Environmental protection laws such as the Clean Air Act drive demand for ultrasonic gas detectors that can identify leaks before they become hazardous. The shale gas boom and growing LNG exports further reinforce market growth, though pricing pressures from Asian manufacturers present competitive challenges.

Europe
Europe’s market is characterized by strict EU directives on industrial safety and methane emissions reduction. Countries like Germany and the U.K. lead in adopting fixed ultrasonic detectors for chemical plants and offshore platforms, where Drager and INFICON hold significant market share. The region shows increasing preference for IoT-enabled detectors that integrate with plant-wide safety systems. While growth is steady, market saturation in Western Europe contrasts with emerging opportunities in Eastern Europe’s developing energy infrastructure. The REPowerEU plan’s focus on reducing gas leaks presents new growth avenues through 2030.

Asia-Pacific
As the fastest-growing regional market, Asia-Pacific benefits from China’s massive industrial expansion and India’s rising oil refining capacity. Local manufacturers compete aggressively on price, while international players establish joint ventures to access this high-volume market. The region shows strong demand in both fixed installations (for petrochemical complexes) and portable units (for mining safety). However, uneven regulatory enforcement across countries and preference for lower-cost conventional detectors in some markets temporarily slows adoption rates. Japan and South Korea remain technology leaders, with sophisticated detector deployment in LNG terminals.

Middle East & Africa
The Middle East’s vast oil and gas operations drive demand for high-performance acoustic detectors, particularly in Saudi Arabia and the UAE where spectris and other global suppliers have established service networks. The market shows unique characteristics with extreme environment-rated equipment requirements and large-scale facility deployments. Africa’s growth is concentrated in North African nations and emerging gas producers like Mozambique, though infrastructure limitations constrain wider adoption. Political instability in some regions creates supply chain challenges for detector manufacturers.

South America
Brazil and Argentina account for most regional demand, with offshore oil projects and pipeline networks requiring advanced leak detection. Market growth is tempered by economic volatility and reliance on imported detector systems. Local manufacturing remains limited, though partnerships between companies like AOIP and regional distributors are increasing service capabilities. Environmental concerns from gas flaring are gradually driving stricter regulations, which should boost detector adoption in coming years alongside refinery modernization programs.

Report Scope

This market research report provides a comprehensive analysis of the Global Acoustic Gas Detector Market, covering the forecast period 2024–2032. It offers detailed insights into market dynamics, technological advancements, competitive landscape, and key trends shaping the industry.

Key focus areas of the report include:

  • Market Size & Forecast: Historical data and future projections for revenue, unit shipments, and market value across major regions and segments. The global market was valued at USD 434 million in 2024 and is projected to reach USD 618 million by 2032, growing at a CAGR of 5.2%.
  • Segmentation Analysis: Detailed breakdown by product type (Fixed vs Portable Ultrasonic Gas Leak Detectors), application (Oil & Gas, Mining, Chemical Industry), and end-user industry to identify high-growth segments.
  • Regional Outlook: Insights into market performance across North America (U.S., Canada, Mexico), Europe (Germany, UK, France), Asia-Pacific (China, Japan, India), and other regions, including country-level analysis.
  • Competitive Landscape: Profiles of leading market participants including Emerson, MSA, Drager, INFICON, and Bacharach, covering their product portfolios, market share (top 5 players held approximately xx% share in 2024), and strategic developments.
  • Technology Trends: Assessment of emerging acoustic detection technologies, integration with IoT platforms, and advancements in ultrasonic sensing capabilities.
  • Market Drivers & Restraints: Evaluation of factors such as stringent safety regulations, increasing oil & gas infrastructure investments, along with challenges like high equipment costs.
  • Stakeholder Analysis: Strategic insights for gas detector manufacturers, industrial end-users, system integrators, and investors regarding market opportunities.

The research employs both primary and secondary methodologies, including interviews with industry experts and analysis of verified market data, to ensure accuracy and reliability.

FREQUENTLY ASKED QUESTIONS:

What is the current market size of Global Acoustic Gas Detector Market?

-> Acoustic Gas Detector Market was valued at 434 million in 2024 and is projected to reach US$ 618 million by 2032, at a CAGR of 5.2% during the forecast period.

Which key companies operate in this market?

-> Major players include Emerson, MSA Safety, Drager, INFICON, and Bacharach, with the top 5 companies holding approximately xx% market share in 2024.

What are the key growth drivers?

-> Growth is driven by stringent industrial safety regulations, increasing adoption in oil & gas sector, and technological advancements in leak detection systems.

Which region dominates the market?

-> North America currently leads the market, while Asia-Pacific is expected to witness the highest growth rate during the forecast period.

What are the emerging trends?

-> Emerging trends include integration with IoT platforms, development of wireless acoustic detectors, and increasing use in renewable energy facilities.

Acoustic Gas Detector Market, Trends, Business Strategies 2025-2032

Get Sample Report PDF for Exclusive Insights

Report Sample Includes

  • Table of Contents
  • List of Tables & Figures
  • Charts, Research Methodology, and more...
PDF Icon Download Sample Report PDF
SKU: 1a21f5099646
Category:

Download Sample Report

Table of Content

1 Introduction to Research & Analysis Reports
1.1 Acoustic Gas Detector Market Definition
1.2 Market Segments
1.2.1 Segment by Type
1.2.2 Segment by Application
1.3 Global Acoustic Gas Detector Market Overview
1.4 Features & Benefits of This Report
1.5 Methodology & Sources of Information
1.5.1 Research Methodology
1.5.2 Research Process
1.5.3 Base Year
1.5.4 Report Assumptions & Caveats
2 Global Acoustic Gas Detector Overall Market Size
2.1 Global Acoustic Gas Detector Market Size: 2024 VS 2032
2.2 Global Acoustic Gas Detector Market Size, Prospects & Forecasts: 2020-2032
2.3 Global Acoustic Gas Detector Sales: 2020-2032
3 Company Landscape
3.1 Top Acoustic Gas Detector Players in Global Market
3.2 Top Global Acoustic Gas Detector Companies Ranked by Revenue
3.3 Global Acoustic Gas Detector Revenue by Companies
3.4 Global Acoustic Gas Detector Sales by Companies
3.5 Global Acoustic Gas Detector Price by Manufacturer (2020-2025)
3.6 Top 3 and Top 5 Acoustic Gas Detector Companies in Global Market, by Revenue in 2024
3.7 Global Manufacturers Acoustic Gas Detector Product Type
3.8 Tier 1, Tier 2, and Tier 3 Acoustic Gas Detector Players in Global Market
3.8.1 List of Global Tier 1 Acoustic Gas Detector Companies
3.8.2 List of Global Tier 2 and Tier 3 Acoustic Gas Detector Companies
4 Sights by Product
4.1 Overview
4.1.1 Segment by Type – Global Acoustic Gas Detector Market Size Markets, 2024 & 2032
4.1.2 Fixed Ultrasonic Gas Leak Detectors
4.1.3 Portable Ultrasonic Gas Leak Detectors
4.2 Segment by Type – Global Acoustic Gas Detector Revenue & Forecasts
4.2.1 Segment by Type – Global Acoustic Gas Detector Revenue, 2020-2025
4.2.2 Segment by Type – Global Acoustic Gas Detector Revenue, 2026-2032
4.2.3 Segment by Type – Global Acoustic Gas Detector Revenue Market Share, 2020-2032
4.3 Segment by Type – Global Acoustic Gas Detector Sales & Forecasts
4.3.1 Segment by Type – Global Acoustic Gas Detector Sales, 2020-2025
4.3.2 Segment by Type – Global Acoustic Gas Detector Sales, 2026-2032
4.3.3 Segment by Type – Global Acoustic Gas Detector Sales Market Share, 2020-2032
4.4 Segment by Type – Global Acoustic Gas Detector Price (Manufacturers Selling Prices), 2020-2032
5 Sights by Application
5.1 Overview
5.1.1 Segment by Application – Global Acoustic Gas Detector Market Size, 2024 & 2032
5.1.2 Oil and Gas
5.1.3 Mining
5.1.4 Chemical Industry
5.1.5 Others
5.2 Segment by Application – Global Acoustic Gas Detector Revenue & Forecasts
5.2.1 Segment by Application – Global Acoustic Gas Detector Revenue, 2020-2025
5.2.2 Segment by Application – Global Acoustic Gas Detector Revenue, 2026-2032
5.2.3 Segment by Application – Global Acoustic Gas Detector Revenue Market Share, 2020-2032
5.3 Segment by Application – Global Acoustic Gas Detector Sales & Forecasts
5.3.1 Segment by Application – Global Acoustic Gas Detector Sales, 2020-2025
5.3.2 Segment by Application – Global Acoustic Gas Detector Sales, 2026-2032
5.3.3 Segment by Application – Global Acoustic Gas Detector Sales Market Share, 2020-2032
5.4 Segment by Application – Global Acoustic Gas Detector Price (Manufacturers Selling Prices), 2020-2032
6 Sights by Region
6.1 By Region – Global Acoustic Gas Detector Market Size, 2024 & 2032
6.2 By Region – Global Acoustic Gas Detector Revenue & Forecasts
6.2.1 By Region – Global Acoustic Gas Detector Revenue, 2020-2025
6.2.2 By Region – Global Acoustic Gas Detector Revenue, 2026-2032
6.2.3 By Region – Global Acoustic Gas Detector Revenue Market Share, 2020-2032
6.3 By Region – Global Acoustic Gas Detector Sales & Forecasts
6.3.1 By Region – Global Acoustic Gas Detector Sales, 2020-2025
6.3.2 By Region – Global Acoustic Gas Detector Sales, 2026-2032
6.3.3 By Region – Global Acoustic Gas Detector Sales Market Share, 2020-2032
6.4 North America
6.4.1 By Country – North America Acoustic Gas Detector Revenue, 2020-2032
6.4.2 By Country – North America Acoustic Gas Detector Sales, 2020-2032
6.4.3 United States Acoustic Gas Detector Market Size, 2020-2032
6.4.4 Canada Acoustic Gas Detector Market Size, 2020-2032
6.4.5 Mexico Acoustic Gas Detector Market Size, 2020-2032
6.5 Europe
6.5.1 By Country – Europe Acoustic Gas Detector Revenue, 2020-2032
6.5.2 By Country – Europe Acoustic Gas Detector Sales, 2020-2032
6.5.3 Germany Acoustic Gas Detector Market Size, 2020-2032
6.5.4 France Acoustic Gas Detector Market Size, 2020-2032
6.5.5 U.K. Acoustic Gas Detector Market Size, 2020-2032
6.5.6 Italy Acoustic Gas Detector Market Size, 2020-2032
6.5.7 Russia Acoustic Gas Detector Market Size, 2020-2032
6.5.8 Nordic Countries Acoustic Gas Detector Market Size, 2020-2032
6.5.9 Benelux Acoustic Gas Detector Market Size, 2020-2032
6.6 Asia
6.6.1 By Region – Asia Acoustic Gas Detector Revenue, 2020-2032
6.6.2 By Region – Asia Acoustic Gas Detector Sales, 2020-2032
6.6.3 China Acoustic Gas Detector Market Size, 2020-2032
6.6.4 Japan Acoustic Gas Detector Market Size, 2020-2032
6.6.5 South Korea Acoustic Gas Detector Market Size, 2020-2032
6.6.6 Southeast Asia Acoustic Gas Detector Market Size, 2020-2032
6.6.7 India Acoustic Gas Detector Market Size, 2020-2032
6.7 South America
6.7.1 By Country – South America Acoustic Gas Detector Revenue, 2020-2032
6.7.2 By Country – South America Acoustic Gas Detector Sales, 2020-2032
6.7.3 Brazil Acoustic Gas Detector Market Size, 2020-2032
6.7.4 Argentina Acoustic Gas Detector Market Size, 2020-2032
6.8 Middle East & Africa
6.8.1 By Country – Middle East & Africa Acoustic Gas Detector Revenue, 2020-2032
6.8.2 By Country – Middle East & Africa Acoustic Gas Detector Sales, 2020-2032
6.8.3 Turkey Acoustic Gas Detector Market Size, 2020-2032
6.8.4 Israel Acoustic Gas Detector Market Size, 2020-2032
6.8.5 Saudi Arabia Acoustic Gas Detector Market Size, 2020-2032
6.8.6 UAE Acoustic Gas Detector Market Size, 2020-2032
7 Manufacturers & Brands Profiles
7.1 Emerson
7.1.1 Emerson Company Summary
7.1.2 Emerson Business Overview
7.1.3 Emerson Acoustic Gas Detector Major Product Offerings
7.1.4 Emerson Acoustic Gas Detector Sales and Revenue in Global (2020-2025)
7.1.5 Emerson Key News & Latest Developments
7.2 MSA
7.2.1 MSA Company Summary
7.2.2 MSA Business Overview
7.2.3 MSA Acoustic Gas Detector Major Product Offerings
7.2.4 MSA Acoustic Gas Detector Sales and Revenue in Global (2020-2025)
7.2.5 MSA Key News & Latest Developments
7.3 AOIP
7.3.1 AOIP Company Summary
7.3.2 AOIP Business Overview
7.3.3 AOIP Acoustic Gas Detector Major Product Offerings
7.3.4 AOIP Acoustic Gas Detector Sales and Revenue in Global (2020-2025)
7.3.5 AOIP Key News & Latest Developments
7.4 Diatex
7.4.1 Diatex Company Summary
7.4.2 Diatex Business Overview
7.4.3 Diatex Acoustic Gas Detector Major Product Offerings
7.4.4 Diatex Acoustic Gas Detector Sales and Revenue in Global (2020-2025)
7.4.5 Diatex Key News & Latest Developments
7.5 INFICON
7.5.1 INFICON Company Summary
7.5.2 INFICON Business Overview
7.5.3 INFICON Acoustic Gas Detector Major Product Offerings
7.5.4 INFICON Acoustic Gas Detector Sales and Revenue in Global (2020-2025)
7.5.5 INFICON Key News & Latest Developments
7.6 Drager
7.6.1 Drager Company Summary
7.6.2 Drager Business Overview
7.6.3 Drager Acoustic Gas Detector Major Product Offerings
7.6.4 Drager Acoustic Gas Detector Sales and Revenue in Global (2020-2025)
7.6.5 Drager Key News & Latest Developments
7.7 Det-Tronics
7.7.1 Det-Tronics Company Summary
7.7.2 Det-Tronics Business Overview
7.7.3 Det-Tronics Acoustic Gas Detector Major Product Offerings
7.7.4 Det-Tronics Acoustic Gas Detector Sales and Revenue in Global (2020-2025)
7.7.5 Det-Tronics Key News & Latest Developments
7.8 Bacharach
7.8.1 Bacharach Company Summary
7.8.2 Bacharach Business Overview
7.8.3 Bacharach Acoustic Gas Detector Major Product Offerings
7.8.4 Bacharach Acoustic Gas Detector Sales and Revenue in Global (2020-2025)
7.8.5 Bacharach Key News & Latest Developments
7.9 Spectris
7.9.1 Spectris Company Summary
7.9.2 Spectris Business Overview
7.9.3 Spectris Acoustic Gas Detector Major Product Offerings
7.9.4 Spectris Acoustic Gas Detector Sales and Revenue in Global (2020-2025)
7.9.5 Spectris Key News & Latest Developments
7.10 Beha-Amprobe
7.10.1 Beha-Amprobe Company Summary
7.10.2 Beha-Amprobe Business Overview
7.10.3 Beha-Amprobe Acoustic Gas Detector Major Product Offerings
7.10.4 Beha-Amprobe Acoustic Gas Detector Sales and Revenue in Global (2020-2025)
7.10.5 Beha-Amprobe Key News & Latest Developments
8 Global Acoustic Gas Detector Production Capacity, Analysis
8.1 Global Acoustic Gas Detector Production Capacity, 2020-2032
8.2 Acoustic Gas Detector Production Capacity of Key Manufacturers in Global Market
8.3 Global Acoustic Gas Detector Production by Region
9 Key Market Trends, Opportunity, Drivers and Restraints
9.1 Market Opportunities & Trends
9.2 Market Drivers
9.3 Market Restraints
10 Acoustic Gas Detector Supply Chain Analysis
10.1 Acoustic Gas Detector Industry Value Chain
10.2 Acoustic Gas Detector Upstream Market
10.3 Acoustic Gas Detector Downstream and Clients
10.4 Marketing Channels Analysis
10.4.1 Marketing Channels
10.4.2 Acoustic Gas Detector Distributors and Sales Agents in Global
11 Conclusion
12 Appendix
12.1 Note
12.2 Examples of Clients
12.3 DisclaimerList of Tables
Table 1. Key Players of Acoustic Gas Detector in Global Market
Table 2. Top Acoustic Gas Detector Players in Global Market, Ranking by Revenue (2024)
Table 3. Global Acoustic Gas Detector Revenue by Companies, (US$, Mn), 2020-2025
Table 4. Global Acoustic Gas Detector Revenue Share by Companies, 2020-2025
Table 5. Global Acoustic Gas Detector Sales by Companies, (K Units), 2020-2025
Table 6. Global Acoustic Gas Detector Sales Share by Companies, 2020-2025
Table 7. Key Manufacturers Acoustic Gas Detector Price (2020-2025) & (US$/Unit)
Table 8. Global Manufacturers Acoustic Gas Detector Product Type
Table 9. List of Global Tier 1 Acoustic Gas Detector Companies, Revenue (US$, Mn) in 2024 and Market Share
Table 10. List of Global Tier 2 and Tier 3 Acoustic Gas Detector Companies, Revenue (US$, Mn) in 2024 and Market Share
Table 11. Segment by Type – Global Acoustic Gas Detector Revenue, (US$, Mn), 2024 & 2032
Table 12. Segment by Type – Global Acoustic Gas Detector Revenue (US$, Mn), 2020-2025
Table 13. Segment by Type – Global Acoustic Gas Detector Revenue (US$, Mn), 2026-2032
Table 14. Segment by Type – Global Acoustic Gas Detector Sales (K Units), 2020-2025
Table 15. Segment by Type – Global Acoustic Gas Detector Sales (K Units), 2026-2032
Table 16. Segment by Application – Global Acoustic Gas Detector Revenue, (US$, Mn), 2024 & 2032
Table 17. Segment by Application – Global Acoustic Gas Detector Revenue, (US$, Mn), 2020-2025
Table 18. Segment by Application – Global Acoustic Gas Detector Revenue, (US$, Mn), 2026-2032
Table 19. Segment by Application – Global Acoustic Gas Detector Sales, (K Units), 2020-2025
Table 20. Segment by Application – Global Acoustic Gas Detector Sales, (K Units), 2026-2032
Table 21. By Region – Global Acoustic Gas Detector Revenue, (US$, Mn), 2025-2032
Table 22. By Region – Global Acoustic Gas Detector Revenue, (US$, Mn), 2020-2025
Table 23. By Region – Global Acoustic Gas Detector Revenue, (US$, Mn), 2026-2032
Table 24. By Region – Global Acoustic Gas Detector Sales, (K Units), 2020-2025
Table 25. By Region – Global Acoustic Gas Detector Sales, (K Units), 2026-2032
Table 26. By Country – North America Acoustic Gas Detector Revenue, (US$, Mn), 2020-2025
Table 27. By Country – North America Acoustic Gas Detector Revenue, (US$, Mn), 2026-2032
Table 28. By Country – North America Acoustic Gas Detector Sales, (K Units), 2020-2025
Table 29. By Country – North America Acoustic Gas Detector Sales, (K Units), 2026-2032
Table 30. By Country – Europe Acoustic Gas Detector Revenue, (US$, Mn), 2020-2025
Table 31. By Country – Europe Acoustic Gas Detector Revenue, (US$, Mn), 2026-2032
Table 32. By Country – Europe Acoustic Gas Detector Sales, (K Units), 2020-2025
Table 33. By Country – Europe Acoustic Gas Detector Sales, (K Units), 2026-2032
Table 34. By Region – Asia Acoustic Gas Detector Revenue, (US$, Mn), 2020-2025
Table 35. By Region – Asia Acoustic Gas Detector Revenue, (US$, Mn), 2026-2032
Table 36. By Region – Asia Acoustic Gas Detector Sales, (K Units), 2020-2025
Table 37. By Region – Asia Acoustic Gas Detector Sales, (K Units), 2026-2032
Table 38. By Country – South America Acoustic Gas Detector Revenue, (US$, Mn), 2020-2025
Table 39. By Country – South America Acoustic Gas Detector Revenue, (US$, Mn), 2026-2032
Table 40. By Country – South America Acoustic Gas Detector Sales, (K Units), 2020-2025
Table 41. By Country – South America Acoustic Gas Detector Sales, (K Units), 2026-2032
Table 42. By Country – Middle East & Africa Acoustic Gas Detector Revenue, (US$, Mn), 2020-2025
Table 43. By Country – Middle East & Africa Acoustic Gas Detector Revenue, (US$, Mn), 2026-2032
Table 44. By Country – Middle East & Africa Acoustic Gas Detector Sales, (K Units), 2020-2025
Table 45. By Country – Middle East & Africa Acoustic Gas Detector Sales, (K Units), 2026-2032
Table 46. Emerson Company Summary
Table 47. Emerson Acoustic Gas Detector Product Offerings
Table 48. Emerson Acoustic Gas Detector Sales (K Units), Revenue (US$, Mn) and Average Price (US$/Unit) & (2020-2025)
Table 49. Emerson Key News & Latest Developments
Table 50. MSA Company Summary
Table 51. MSA Acoustic Gas Detector Product Offerings
Table 52. MSA Acoustic Gas Detector Sales (K Units), Revenue (US$, Mn) and Average Price (US$/Unit) & (2020-2025)
Table 53. MSA Key News & Latest Developments
Table 54. AOIP Company Summary
Table 55. AOIP Acoustic Gas Detector Product Offerings
Table 56. AOIP Acoustic Gas Detector Sales (K Units), Revenue (US$, Mn) and Average Price (US$/Unit) & (2020-2025)
Table 57. AOIP Key News & Latest Developments
Table 58. Diatex Company Summary
Table 59. Diatex Acoustic Gas Detector Product Offerings
Table 60. Diatex Acoustic Gas Detector Sales (K Units), Revenue (US$, Mn) and Average Price (US$/Unit) & (2020-2025)
Table 61. Diatex Key News & Latest Developments
Table 62. INFICON Company Summary
Table 63. INFICON Acoustic Gas Detector Product Offerings
Table 64. INFICON Acoustic Gas Detector Sales (K Units), Revenue (US$, Mn) and Average Price (US$/Unit) & (2020-2025)
Table 65. INFICON Key News & Latest Developments
Table 66. Drager Company Summary
Table 67. Drager Acoustic Gas Detector Product Offerings
Table 68. Drager Acoustic Gas Detector Sales (K Units), Revenue (US$, Mn) and Average Price (US$/Unit) & (2020-2025)
Table 69. Drager Key News & Latest Developments
Table 70. Det-Tronics Company Summary
Table 71. Det-Tronics Acoustic Gas Detector Product Offerings
Table 72. Det-Tronics Acoustic Gas Detector Sales (K Units), Revenue (US$, Mn) and Average Price (US$/Unit) & (2020-2025)
Table 73. Det-Tronics Key News & Latest Developments
Table 74. Bacharach Company Summary
Table 75. Bacharach Acoustic Gas Detector Product Offerings
Table 76. Bacharach Acoustic Gas Detector Sales (K Units), Revenue (US$, Mn) and Average Price (US$/Unit) & (2020-2025)
Table 77. Bacharach Key News & Latest Developments
Table 78. Spectris Company Summary
Table 79. Spectris Acoustic Gas Detector Product Offerings
Table 80. Spectris Acoustic Gas Detector Sales (K Units), Revenue (US$, Mn) and Average Price (US$/Unit) & (2020-2025)
Table 81. Spectris Key News & Latest Developments
Table 82. Beha-Amprobe Company Summary
Table 83. Beha-Amprobe Acoustic Gas Detector Product Offerings
Table 84. Beha-Amprobe Acoustic Gas Detector Sales (K Units), Revenue (US$, Mn) and Average Price (US$/Unit) & (2020-2025)
Table 85. Beha-Amprobe Key News & Latest Developments
Table 86. Acoustic Gas Detector Capacity of Key Manufacturers in Global Market, 2023-2025 (K Units)
Table 87. Global Acoustic Gas Detector Capacity Market Share of Key Manufacturers, 2023-2025
Table 88. Global Acoustic Gas Detector Production by Region, 2020-2025 (K Units)
Table 89. Global Acoustic Gas Detector Production by Region, 2026-2032 (K Units)
Table 90. Acoustic Gas Detector Market Opportunities & Trends in Global Market
Table 91. Acoustic Gas Detector Market Drivers in Global Market
Table 92. Acoustic Gas Detector Market Restraints in Global Market
Table 93. Acoustic Gas Detector Raw Materials
Table 94. Acoustic Gas Detector Raw Materials Suppliers in Global Market
Table 95. Typical Acoustic Gas Detector Downstream
Table 96. Acoustic Gas Detector Downstream Clients in Global Market
Table 97. Acoustic Gas Detector Distributors and Sales Agents in Global Market

List of Figures
Figure 1. Acoustic Gas Detector Product Picture
Figure 2. Acoustic Gas Detector Segment by Type in 2024
Figure 3. Acoustic Gas Detector Segment by Application in 2024
Figure 4. Global Acoustic Gas Detector Market Overview: 2024
Figure 5. Key Caveats
Figure 6. Global Acoustic Gas Detector Market Size: 2024 VS 2032 (US$, Mn)
Figure 7. Global Acoustic Gas Detector Revenue: 2020-2032 (US$, Mn)
Figure 8. Acoustic Gas Detector Sales in Global Market: 2020-2032 (K Units)
Figure 9. The Top 3 and 5 Players Market Share by Acoustic Gas Detector Revenue in 2024
Figure 10. Segment by Type – Global Acoustic Gas Detector Revenue, (US$, Mn), 2024 & 2032
Figure 11. Segment by Type – Global Acoustic Gas Detector Revenue Market Share, 2020-2032
Figure 12. Segment by Type – Global Acoustic Gas Detector Sales Market Share, 2020-2032
Figure 13. Segment by Type – Global Acoustic Gas Detector Price (US$/Unit), 2020-2032
Figure 14. Segment by Application – Global Acoustic Gas Detector Revenue, (US$, Mn), 2024 & 2032
Figure 15. Segment by Application – Global Acoustic Gas Detector Revenue Market Share, 2020-2032
Figure 16. Segment by Application – Global Acoustic Gas Detector Sales Market Share, 2020-2032
Figure 17. Segment by Application -Global Acoustic Gas Detector Price (US$/Unit), 2020-2032
Figure 18. By Region – Global Acoustic Gas Detector Revenue, (US$, Mn), 2025 & 2032
Figure 19. By Region – Global Acoustic Gas Detector Revenue Market Share, 2020 VS 2024 VS 2032
Figure 20. By Region – Global Acoustic Gas Detector Revenue Market Share, 2020-2032
Figure 21. By Region – Global Acoustic Gas Detector Sales Market Share, 2020-2032
Figure 22. By Country – North America Acoustic Gas Detector Revenue Market Share, 2020-2032
Figure 23. By Country – North America Acoustic Gas Detector Sales Market Share, 2020-2032
Figure 24. United States Acoustic Gas Detector Revenue, (US$, Mn), 2020-2032
Figure 25. Canada Acoustic Gas Detector Revenue, (US$, Mn), 2020-2032
Figure 26. Mexico Acoustic Gas Detector Revenue, (US$, Mn), 2020-2032
Figure 27. By Country – Europe Acoustic Gas Detector Revenue Market Share, 2020-2032
Figure 28. By Country – Europe Acoustic Gas Detector Sales Market Share, 2020-2032
Figure 29. Germany Acoustic Gas Detector Revenue, (US$, Mn), 2020-2032
Figure 30. France Acoustic Gas Detector Revenue, (US$, Mn), 2020-2032
Figure 31. U.K. Acoustic Gas Detector Revenue, (US$, Mn), 2020-2032
Figure 32. Italy Acoustic Gas Detector Revenue, (US$, Mn), 2020-2032
Figure 33. Russia Acoustic Gas Detector Revenue, (US$, Mn), 2020-2032
Figure 34. Nordic Countries Acoustic Gas Detector Revenue, (US$, Mn), 2020-2032
Figure 35. Benelux Acoustic Gas Detector Revenue, (US$, Mn), 2020-2032
Figure 36. By Region – Asia Acoustic Gas Detector Revenue Market Share, 2020-2032
Figure 37. By Region – Asia Acoustic Gas Detector Sales Market Share, 2020-2032
Figure 38. China Acoustic Gas Detector Revenue, (US$, Mn), 2020-2032
Figure 39. Japan Acoustic Gas Detector Revenue, (US$, Mn), 2020-2032
Figure 40. South Korea Acoustic Gas Detector Revenue, (US$, Mn), 2020-2032
Figure 41. Southeast Asia Acoustic Gas Detector Revenue, (US$, Mn), 2020-2032
Figure 42. India Acoustic Gas Detector Revenue, (US$, Mn), 2020-2032
Figure 43. By Country – South America Acoustic Gas Detector Revenue Market Share, 2020-2032
Figure 44. By Country – South America Acoustic Gas Detector Sales, Market Share, 2020-2032
Figure 45. Brazil Acoustic Gas Detector Revenue, (US$, Mn), 2020-2032
Figure 46. Argentina Acoustic Gas Detector Revenue, (US$, Mn), 2020-2032
Figure 47. By Country – Middle East & Africa Acoustic Gas Detector Revenue, Market Share, 2020-2032
Figure 48. By Country – Middle East & Africa Acoustic Gas Detector Sales, Market Share, 2020-2032
Figure 49. Turkey Acoustic Gas Detector Revenue, (US$, Mn), 2020-2032
Figure 50. Israel Acoustic Gas Detector Revenue, (US$, Mn), 2020-2032
Figure 51. Saudi Arabia Acoustic Gas Detector Revenue, (US$, Mn), 2020-2032
Figure 52. UAE Acoustic Gas Detector Revenue, (US$, Mn), 2020-2032
Figure 53. Global Acoustic Gas Detector Production Capacity (K Units), 2020-2032
Figure 54. The Percentage of Production Acoustic Gas Detector by Region, 2024 VS 2032
Figure 55. Acoustic Gas Detector Industry Value Chain
Figure 56. Marketing Channels