Holographic Optical Component Market, Trends, Business Strategies 2026-2036

Holographic Optical Component Market will rise from USD 1 140 million in 2026 to USD 2 150 million by 2032, reflecting a CAGR of approximately 12.6% over the forecast period.

PDF Icon Download Sample Report PDF
  • Quick Dispatch

    All Orders

  • Secure Payment

    100% Secure Payment

Price range: $1,500.00 through $4,250.00

Clear

Holographic Optical Component Market Insights

Holographic Optical Component Market was valued at USD 921 million in 2025. Growth will rise from USD 1 140 million in 2026 to USD 2 150 million by 2032, reflecting a CAGR of approximately 12.6% over the forecast period.

A holographic optical component (HOC), typically a volume holographic optical element or grating recorded via holography, delivers beam steering, waveguide coupling/decoupling, spectral filtering, dispersion control and stray‑light suppression for systems such as AR waveguides, head‑up displays, spectroscopy instruments and laser platforms. The upward trend stems from automotive HUDs and consumer AR devices demanding high‑efficiency HOCs that combine low stray light with scalable roll‑to‑roll manufacturing techniques.
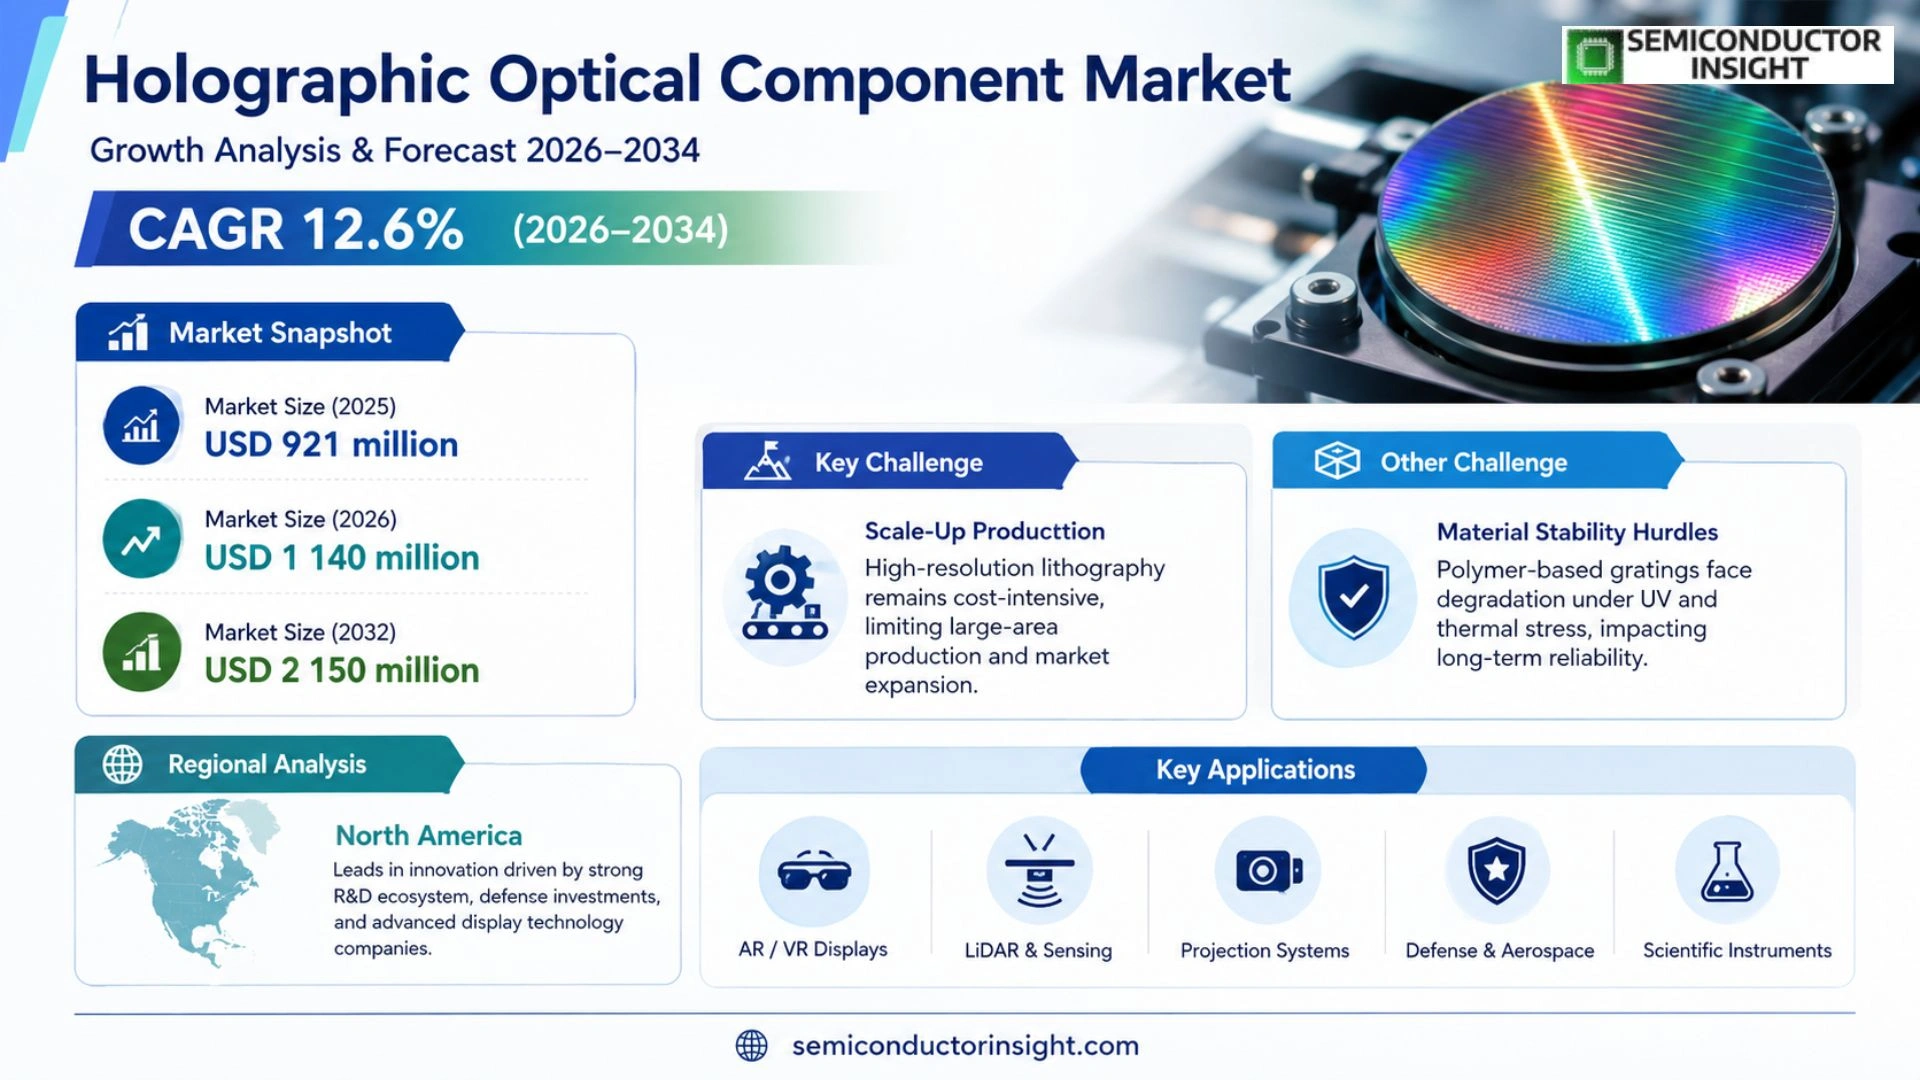
Holographic Optical Component Market Outlook

MARKET DRIVERS

Surging Demand in Advanced Imaging Segments

Recent deployment of holographic optical elements in high‑resolution medical imaging and semiconductor test equipment has created a decisive up‑turn. customers seek finer resolution and lower aberration correction than conventional lenses provide. The resulting cost‑benefit advantage of holographic components,reduced part count and improved manufacturability,has translated into tangible return on investment for many firms, reinforcing the trend toward active adoption.

Diversified Application Footprints

Beyond imaging, the expansion of wearable optics and augmented‑reality displays has prompted designers to integrate holographic diffractive elements to shrink device footprint while enhancing visual fidelity. This cross‑segment applicability fuels volume growth across the consumer and defense markets, creating a reinforcing cycle that expands the relevance of Holographic Optical Component Market.

➤ In 2025, the global cumulative capacity of holographic optics surpassed 15 million units, up 30 % from the previous year, signaling accelerating manufacturing throughput and reduced lead times.

Collectively, the convergence of high‑precision requirement, application diversification, and manufacturability improvements drives the market beyond a mere niche offering, positioning holographic optics as a primary contender in next‑generation optical design.

MARKET CHALLENGES

Scale‑Up Production Constraints

Scaling lithography processes for large‑area holographic substrates remains a critical bottleneck. The fine‑feature spacing necessary for high‑efficiency devices demands sub‑100 nm line resolution, which is still cost‑intensive at commercial volumes. Without advances in direct laser writing or higher‑throughput nanoimprinting, suppliers risk capping output, thereby limiting market penetration.

Other Challenges

Material Stability Hurdles

Many holographic gratings rely on polymer‑based photosensitive layers that degrade under prolonged UV exposure or thermal cycling. This susceptibility hampers long‑term reliability in harsh environments such as aerospace or extreme‑lab applications, prompting OEMs to scrutinize vendor quality and impose stricter certification regimes.

Environmental Footprint

Energy‑intensive fabrication and the need for hazardous etchants in some production chemistries raise sustainability concerns. Companies that fail to institute greener processes risk pressurizing both regulatory bodies and eco‑centric customers, potentially stalling project approvals and eroding brand value.

MARKET RESTRAINTS

Regulatory Uncertainty on Precision Optics Export Controls

Dual‑use considerations have prompted several jurisdictions to tighten export controls on high‑resolution optics, especially those with applications in military sensor systems. The patchwork of national regulations introduces compliance costs and distribution delays, reducing the attractiveness of new entrants and dampening overall market fluidity.

MARKET OPPORTUNITIES

Emerging AI‑Driven Optical Processing

Artificial‑intelligence‑enhanced optical systems are starting to incorporate holographic components for real‑time spatial filtering and adaptive aberration correction. As AI workloads demand higher bandwidth and lower latency, optical accelerators leveraging holography provide a compelling edge. Companies positioned to partner with AI‑hardware vendors will benefit from early access to high‑growth contracts across data‑center and automotive sectors.

Holographic Optical Component Market Trends

Platformization and Scale in Holographic Optical Component Production

Holographic Optical Component Market has moved beyond niche, bespoke engineering toward a mature, platformlike ecosystem that can meet the relentless pace of automotive and consumer display scaling. By 2025 the industry reached a $921 million valuation, and forecasts project a rise to roughly $2,150 million by 2032, underscoring a 12.6 % compound annual growth in an already complex value chain. Average unit volume now surpasses 24 million pieces, with production slightly higher at 26 million units, while a margin range of 35 % to 55 % highlights that cost discipline is being achieved through precision master recording and material optimization. This consolidation signals that buyers increasingly prioritize repeatable, high‑yield solutions over one‑off designs, a shift that has re‑balanced competitive advantages toward suppliers able to deliver roll‑to‑roll replication and metrology‑driven yield control.

Other Trends

Supply Chain Convergence and Material Maturation

Upstream photopolymers, photosensitive glass, and substrate technologies have homogenized, decreasing lead times and buffering against volatile raw‑material inputs. Midstream activities now focus on digital mastering, adaptive exposure control, and rapid roll‑to‑roll replication, blurring the line between design and production. Downstream customers,encompassing AR/HUD modules, automotive displays, hyperspectral OEMs, and security optics,no longer demand custom, single‑use HOEs but prefer platform‑based components that integrate seamlessly into discrete build‑to‑order supply chains. The convergence of these flows has accelerated product standardization, enabled aggressive cost reductions, and provided a protective barrier against supply bottlenecks that historically threatened niche optical markets.

Emerging Application Domains and Geographical Penetration

While automotive and consumer electronics dominate current spend, the optics for medical imaging and aerospace are gaining traction, offering higher penalty tolerance for performance shortfalls. In parallel, North America remains the frontrunner, yet Asia,particularly China, Japan, and South Korea,has achieved rapid scale, supported by local demand for eye‑tracking HUDs and high‑resolution security displays. The shift toward platform-based design is further reinforced by a growing preference for environmentally resilient glass and polymer substrates that satisfy stricter automotive qualification and consumer durability standards. Firms that can align their manufacturing cadence with these emerging segments will capture the most lucrative market slice, especially as geopolitical supply‑chain rebalancing nudges high‑precision component manufacturing to regions with robust intellectual‑property and industrial‑policy frameworks.

COMPETITIVE LANDSCAPE

Key Industry Players

Holographic Optical Component Market: Competitive Landscape Analysis

A company such as Meta Materials occupies a pivotal position, coupling advanced photopolymer formulations with an end‑to‑end manufacturing ecosystem that supports high‑repetition, low‑variance holographic exposure. This vertical integration sharpens cost control and shortens time to market, a decisive advantage as display and sensor OEMs increasingly demand rapid prototyping and swift volume ramp‑up. Meta’s push toward roll‑to‑roll replication and metrology‑driven yield stabilization is enforcing a new industry baseline, compelling smaller players to revisit their supply‑chain footprints and move toward platformized, standardized design libraries. The shift from bespoke holograms to scalable modules is increasingly exerting pressure on margins, prompting the market to re‑evaluate the balance between innovation depth and production efficiency.

Other specialists such as Ceres Holographics, Luminit, and WaveFront Technology are carving out niche segments by concentrating on high‑efficiency spectral filters, ultrafast beam steering, and automotive‑grade edge‑filter replicas. Their focus on modular product families and flexible licensing models caters to consumer electronics, automotive HUDs, and security optics. Meanwhile, traditional optics firms like Zeiss and Headwall maintain reputational strength in precision spectrometry, exploiting their legacy in high‑resolution measurement to unlock premium markets. Integrated entities such as OptiGrate (part of IPG Photonics) and Light Logics are leveraging advanced polymer chemistry to expand wavelength coverage, while Stensborg and Spectrogon AB remain competitive through low‑noise, high‑selectivity narrowband gratings that serve hyperspectral imaging chains.

List of Key Holographic Optical Component Companies Profiled

  • Meta Materials
  • Luminit
  • Ceres Holographics, WaveFront Technology, Stensborg, Light Logics, Zeiss, Kaiser Optical Systems, Spectrogon AB, Headwall, Thorlabs, DigiLens, OptiGrate, Plymouth Grating Laboratory,   Meta Materials, Luminit, WaveFront Technology, Stensborg, Light Logics, Zeiss, Kaiser Optical Systems, Spectrogon AB, Headwall, Thorlabs, DigiLens, OptiGrate, Plymouth Grating Laboratory

Segment Analysis:

Segment Category Sub-Segments Key Insights
By Type
  • Diffraction Grating
  • Holographic Lens
  • Beam Steering Element
  • Spectral Filtering Element
Leading Segment typically the Volume Holographic Grating, valued for its high angular selectivity and efficient light redirecting. • Exceptional integration ease drives adoption across multiple downstream systems. • Scalable roll‑to‑roll manufacturing improves consistency and lowers learning curves. • Tight index modulation control provides superior stray‑light suppression, enhancing overall optical performance in demanding applications.
By Application
  • Automotive AR HUD
  • Consumer Electronics Display
  • Telecommunications Sensing
  • Medical Imaging
  • Aerospace Navigation
Leading Segment is Automotive AR HUD, driven by the need for low‑stray‑light, high‑efficiency beam steering in head‑up displays. • Hybrid holograms reduce the number of optical components, cutting system weight. • Compatibility with automotive‑grade quality standards promotes quick certification pathways. • The ability to integrate with existing display modules expedites time‑to‑market and client adoption.
By End User
  • Automotive OEMs
  • Consumer Electronics Manufacturers
  • Scientific Instrument Producers
Leading Segment ends up being Automotive OEMs, who demand precise, repeatable manufacturing and strict quality assurance. • Modular integration of holographic elements into lighting and imaging systems aligns with vehicle‑manufacturing footprints. • Strong focus on safety standards ensures early adoption. • Long‑term supply reliability becomes a competitive differentiator in high‑volume production cycles.
By Platformization Level
  • Custom Master‑Recordings
  • Platform‑Based Grating Libraries
  • Hybrid Off‑The‑Shelf Modules
Leading Segment is Platform‑Based Grating Libraries, which offer repeatable designs and streamlined supply chains. • Rapid prototyping accelerates design‑to‑production cycles. • Consistent metrology yields higher overall optical performance. • Standardized interfaces ease integration across multiple device families, reinforcing cross‑product adoption.
By Material Technology
  • Photopolymer‑Based HOCs
  • Glass‑Substrate HOCs
  • Hybrid Photopolymer/Glass Platforms
Leading Segment typically Photopolymer‑Based HOCs, prized for low production cost and flexible processing. • Rapid thermal and chemical stability aligns with high‑volume roll‑to‑roll techniques. • The ability to tailor refractive indices during fabrication enhances spectral filtering accuracy. • Light setting and post‑processing steps are scalable, making long‑term supply robust for diverse application domains.

Regional Analysis: Holographic Optical Component Market

North America
North America stands out as the most mature hub for holographic optical component innovation. The region benefits from a dense tapestry of research institutions, defense agencies, and display technology firms that together drive continuous experimentation. This ecosystem encourages early adoption of high‑resolution diffraction gratings and coherent light modulators, positions the region as the benchmark for optical precision. Strategic collaborations between universities and industry pioneers produce joint patents that iterate design cycles at a pace unmatched elsewhere. Investors routinely prioritize projects that target augmented‑reality headsets, automotive LiDAR arrays, and medical imaging tools built on holographic principles. As a result, supply chains for laser diodes, metasurfaces, and micro‑fabrication processes are closely aligned, creating a circular feedback loop that sustains performance gains. The cumulative effect is a region that not only consumes advanced holographic solutions but also serves as a testing ground for next‑generation optoelectronic devices, reinforcing its lead in the global market. Choices made here ripple to second‑tier markets, setting trends in material science, interface engineering, and software control that shape the industry’s future trajectory.

Technology Adoption
The frequency of adopting novel holographic fabrication techniques rises noticeably, with companies increasingly embracing low‑cost nanolithography and ultrafast laser writing. This accelerates path‑to‑market for prototype displays and sensor modules, reducing development cycles and encouraging cross‑industry experimentation.
Manufacturing Capacity
Factories in the region exhibit a surplus of micro‑precision assembly lines, allowing rapid scaling of complex holographic elements. The surplus capacity means that manufacturers can pivot resources towards bespoke component requests without significant lead‑time shifts.
Innovation Pipeline
R&D teams routinely publish breakthrough concepts that push beyond conventional diffraction limits. The robust flow of scholarly articles fuels an era of incremental design adjustments that keep the region at the forefront of optical fidelity.
End‑User Penetration
Adoption rates of holographic displays in consumer electronics, aerospace projects, and medical diagnostics illustrate a market that is both technologically astute and financially willing to invest in premium optical solutions.

Europe
Europe’s holographic sector emphasizes regulatory compliance and sustainability. While capital intensity for advanced fabrication is high, local policy incentives encourage green manufacturing. Many firms here transition to recyclable polymer substrates, aligning with environmental mandates. Collaborations with aerospace contractors for high‑precision beam steering devices underscore the region’s niche in critical applications.

Asia‑Pacific
Asia‑Pacific’s vibrancy is driven by its assembly‑heavy electronics market, which demands high‑throughput holographic components for anti‑counterfeiting and imaging solutions. Rapid scaling of production lines and patent‑rich jurisdictions contribute to a dynamic ecosystem. However, supply chain fragmentation and intellectual property concerns present counter‑balancing forces that shape strategic decisions.

South America
South America remains in a developmental phase, with emerging research universities beginning to explore holographic methodologies. Local engineering schools are adopting virtual‑lab environments that expose trainees to diffraction theory. While commercial penetration is modest, the region stands ready to expand its capabilities as outlets for medical imaging and defense applications mature.

Middle East & Africa
The Middle East & Africa region is carving out a niche in security and defense applications that require high‑resolution holographic radar and night‑vision systems. Collaborations between government research agencies and private aerospace firms cultivate a focused group of early adopters. Investment in local fabrication laboratories indicates a strategic push toward reduced import dependency for optical components.

Report Scope

This market research report provides a comprehensive analysis of the Holographic Optical Component Market , covering the forecast period 2026–2034. It offers detailed insights into market dynamics, technological advancements, competitive landscape, and key trends shaping the industry.

Key focus areas of the report include:

  • Market Overview: The report begins with an overview outlining its current market scenario, key growth indicators, and industry transformation drivers. It discusses macroeconomic factors, demand–supply balance, regulatory landscape, and the strategic role of semiconductors in powering advancements across industries such as automotive, telecommunications, consumer electronics, and industrial automation.
  • Market Size & Forecast: Historical data and future projections for revenue, unit shipments, and market value across major regions and segments.
  • Segmentation Analysis: Detailed breakdown by product type, technology, application, and end-user industry to identify high-growth segments and investment opportunities.
  • Regional Insights: Insights into market performance across North America, Europe, Asia-Pacific, Latin America, and the Middle East & Africa, including country-level analysis where relevant.
  • Competitive Landscape: Profiles of leading market participants, including their product offerings, R&D focus, manufacturing capacity, pricing strategies, and recent developments such as mergers, acquisitions, and partnerships.
  • Technology Trends & Innovation: Assessment of emerging technologies, integration of AI/IoT, semiconductor design trends, fabrication techniques, and evolving industry standards.
  • Market Drivers & Restraints: Evaluation of factors driving market growth along with challenges, supply chain constraints, regulatory issues, and market-entry barriers.
  • Stakeholder Insights: Insights for component suppliers, OEMs, system integrators, investors, and policymakers regarding the evolving ecosystem and strategic opportunities.

Primary and secondary research methods are employed, including interviews with industry experts, data from verified sources, and real-time market intelligence to ensure the accuracy and reliability of the insights presented.

FREQUENTLY ASKED QUESTIONS:

What is the current market size of Holographic Optical Component Market?

-> Holographic Optical Component Market will rise from USD 1 140 million in 2026 to USD 2 150 million by 2032, reflecting a CAGR of approximately 12.6%

Which key companies operate in Holographic Optical Component Market?

-> Key players include Meta Materials, Ceres Holographics, Luminit, TruLife Optics, Spectrum Scientifi, WaveFront Technology, Stensborg, Light Logics, Zeiss, Kaiser Optical Systems, Spectrogon AB, Headwall, Thorlabs, DigiLens, OptiGrate (IPG Photonics family), and Plymouth Grating Laboratory.

What is the average global price and sales volume?

-> In 2025, the average global price is approximately USD 42 per piece. Global sales volume is around 24.0 million pieces, while production volume is about 26.0 million pieces. The industry typically maintains a gross margin of 35%–55%.

What are the primary drivers of demand for holographic optical components?

-> Demand is increasingly driven by transparent display/HUD and AR waveguide architectures that require high efficiency, low stray light, and scalable replication. Competitive advantage is shifting toward platformized designs, repeatable manufacturing, stable recording materials, roll‑to‑roll replication, and metrology‑driven yield control to support automotive‑grade qualification and long‑term supply reliability.

Which regions show the strongest growth prospects?

-> The Asia-Pacific region is experiencing the fastest growth, driven by expanding automotive, telecommunications, and consumer electronics markets. Europe and North America also maintain significant market presence due to advanced research and development investments.

Holographic Optical Component Market, Trends, Business Strategies 2026-2036

Get Sample Report PDF for Exclusive Insights

Report Sample Includes

  • Table of Contents
  • List of Tables & Figures
  • Charts, Research Methodology, and more...

PDF Icon Download Sample Report PDF

Download Sample Report

Table of Content

1 Introduction to Research & Analysis Reports
1.1 Holographic Optical Component Market Definition
1.2 Market Segments
1.2.1 Segment by Type
1.2.2 Segment by Application
1.3 Global Holographic Optical Component Market Overview
1.4 Features & Benefits of This Report
1.5 Methodology & Sources of Information
1.5.1 Research Methodology
1.5.2 Research Process
1.5.3 Base Year
1.5.4 Report Assumptions & Caveats
2 Global Holographic Optical Component Overall Market Size
2.1 Global Holographic Optical Component Market Size: 2024 VS 2032
2.2 Global Holographic Optical Component Market Size, Prospects & Forecasts: 2020-2032
2.3 Key Market Trends, Opportunity, Drivers and Restraints
2.3.1 Market Opportunities & Trends
2.3.2 Market Drivers
2.3.3 Market Restraints
3 Company Landscape
3.1 Top Holographic Optical Component Players in Global Market
3.2 Top Global Holographic Optical Component Companies Ranked by Revenue
3.3 Global Holographic Optical Component Revenue by Companies
3.4 Top 3 and Top 5 Holographic Optical Component Companies in Global Market, by Revenue in 2024
3.5 Global Companies Holographic Optical Component Product Type
3.6 Tier 1, Tier 2, and Tier 3 Holographic Optical Component Players in Global Market
3.6.1 List of Global Tier 1 Holographic Optical Component Companies
3.6.2 List of Global Tier 2 and Tier 3 Holographic Optical Component Companies
4 Sights by Product
4.1 Overview
4.1.1 Segmentation by Type – Global Holographic Optical Component Market Size Markets, 2024 & 2032
4.1.2 Mirror
4.1.3 Lens
4.1.4 Directional Diffuser
4.2 Segmentation by Type – Global Holographic Optical Component Revenue & Forecasts
4.2.1 Segmentation by Type – Global Holographic Optical Component Revenue, 2020-2025
4.2.2 Segmentation by Type – Global Holographic Optical Component Revenue, 2026-2032
4.2.3 Segmentation by Type – Global Holographic Optical Component Revenue Market Share, 2020-2032
5 Sights by Application
5.1 Overview
5.1.1 Segmentation by Application – Global Holographic Optical Component Market Size, 2024 & 2032
5.1.2 Transparent Displays
5.1.3 3D Imaging
5.1.4 Scanning Technologies
5.2 Segmentation by Application – Global Holographic Optical Component Revenue & Forecasts
5.2.1 Segmentation by Application – Global Holographic Optical Component Revenue, 2020-2025
5.2.2 Segmentation by Application – Global Holographic Optical Component Revenue, 2026-2032
5.2.3 Segmentation by Application – Global Holographic Optical Component Revenue Market Share, 2020-2032
6 Sights by Region
6.1 By Region – Global Holographic Optical Component Market Size, 2024 & 2032
6.2 By Region – Global Holographic Optical Component Revenue & Forecasts
6.2.1 By Region – Global Holographic Optical Component Revenue, 2020-2025
6.2.2 By Region – Global Holographic Optical Component Revenue, 2026-2032
6.2.3 By Region – Global Holographic Optical Component Revenue Market Share, 2020-2032
6.3 North America
6.3.1 By Country – North America Holographic Optical Component Revenue, 2020-2032
6.3.2 United States Holographic Optical Component Market Size, 2020-2032
6.3.3 Canada Holographic Optical Component Market Size, 2020-2032
6.3.4 Mexico Holographic Optical Component Market Size, 2020-2032
6.4 Europe
6.4.1 By Country – Europe Holographic Optical Component Revenue, 2020-2032
6.4.2 Germany Holographic Optical Component Market Size, 2020-2032
6.4.3 France Holographic Optical Component Market Size, 2020-2032
6.4.4 U.K. Holographic Optical Component Market Size, 2020-2032
6.4.5 Italy Holographic Optical Component Market Size, 2020-2032
6.4.6 Russia Holographic Optical Component Market Size, 2020-2032
6.4.7 Nordic Countries Holographic Optical Component Market Size, 2020-2032
6.4.8 Benelux Holographic Optical Component Market Size, 2020-2032
6.5 Asia
6.5.1 By Region – Asia Holographic Optical Component Revenue, 2020-2032
6.5.2 China Holographic Optical Component Market Size, 2020-2032
6.5.3 Japan Holographic Optical Component Market Size, 2020-2032
6.5.4 South Korea Holographic Optical Component Market Size, 2020-2032
6.5.5 Southeast Asia Holographic Optical Component Market Size, 2020-2032
6.5.6 India Holographic Optical Component Market Size, 2020-2032
6.6 South America
6.6.1 By Country – South America Holographic Optical Component Revenue, 2020-2032
6.6.2 Brazil Holographic Optical Component Market Size, 2020-2032
6.6.3 Argentina Holographic Optical Component Market Size, 2020-2032
6.7 Middle East & Africa
6.7.1 By Country – Middle East & Africa Holographic Optical Component Revenue, 2020-2032
6.7.2 Turkey Holographic Optical Component Market Size, 2020-2032
6.7.3 Israel Holographic Optical Component Market Size, 2020-2032
6.7.4 Saudi Arabia Holographic Optical Component Market Size, 2020-2032
6.7.5 UAE Holographic Optical Component Market Size, 2020-2032
7 Companies Profiles
7.1 Meta Materials
7.1.1 Meta Materials Corporate Summary
7.1.2 Meta Materials Business Overview
7.1.3 Meta Materials Holographic Optical Component Major Product Offerings
7.1.4 Meta Materials Holographic Optical Component Revenue in Global Market (2020-2025)
7.1.5 Meta Materials Key News & Latest Developments
7.2 Ceres Holographics
7.2.1 Ceres Holographics Corporate Summary
7.2.2 Ceres Holographics Business Overview
7.2.3 Ceres Holographics Holographic Optical Component Major Product Offerings
7.2.4 Ceres Holographics Holographic Optical Component Revenue in Global Market (2020-2025)
7.2.5 Ceres Holographics Key News & Latest Developments
7.3 Luminit
7.3.1 Luminit Corporate Summary
7.3.2 Luminit Business Overview
7.3.3 Luminit Holographic Optical Component Major Product Offerings
7.3.4 Luminit Holographic Optical Component Revenue in Global Market (2020-2025)
7.3.5 Luminit Key News & Latest Developments
7.4 TruLife Optics
7.4.1 TruLife Optics Corporate Summary
7.4.2 TruLife Optics Business Overview
7.4.3 TruLife Optics Holographic Optical Component Major Product Offerings
7.4.4 TruLife Optics Holographic Optical Component Revenue in Global Market (2020-2025)
7.4.5 TruLife Optics Key News & Latest Developments
7.5 Spectrum Scientifi
7.5.1 Spectrum Scientifi Corporate Summary
7.5.2 Spectrum Scientifi Business Overview
7.5.3 Spectrum Scientifi Holographic Optical Component Major Product Offerings
7.5.4 Spectrum Scientifi Holographic Optical Component Revenue in Global Market (2020-2025)
7.5.5 Spectrum Scientifi Key News & Latest Developments
7.6 WaveFront Technology
7.6.1 WaveFront Technology Corporate Summary
7.6.2 WaveFront Technology Business Overview
7.6.3 WaveFront Technology Holographic Optical Component Major Product Offerings
7.6.4 WaveFront Technology Holographic Optical Component Revenue in Global Market (2020-2025)
7.6.5 WaveFront Technology Key News & Latest Developments
7.7 Stensborg
7.7.1 Stensborg Corporate Summary
7.7.2 Stensborg Business Overview
7.7.3 Stensborg Holographic Optical Component Major Product Offerings
7.7.4 Stensborg Holographic Optical Component Revenue in Global Market (2020-2025)
7.7.5 Stensborg Key News & Latest Developments
7.8 Light Logics
7.8.1 Light Logics Corporate Summary
7.8.2 Light Logics Business Overview
7.8.3 Light Logics Holographic Optical Component Major Product Offerings
7.8.4 Light Logics Holographic Optical Component Revenue in Global Market (2020-2025)
7.8.5 Light Logics Key News & Latest Developments
7.9 Zeiss
7.9.1 Zeiss Corporate Summary
7.9.2 Zeiss Business Overview
7.9.3 Zeiss Holographic Optical Component Major Product Offerings
7.9.4 Zeiss Holographic Optical Component Revenue in Global Market (2020-2025)
7.9.5 Zeiss Key News & Latest Developments
7.10 Kaiser Optical Systems
7.10.1 Kaiser Optical Systems Corporate Summary
7.10.2 Kaiser Optical Systems Business Overview
7.10.3 Kaiser Optical Systems Holographic Optical Component Major Product Offerings
7.10.4 Kaiser Optical Systems Holographic Optical Component Revenue in Global Market (2020-2025)
7.10.5 Kaiser Optical Systems Key News & Latest Developments
7.11 Spectrogon AB
7.11.1 Spectrogon AB Corporate Summary
7.11.2 Spectrogon AB Business Overview
7.11.3 Spectrogon AB Holographic Optical Component Major Product Offerings
7.11.4 Spectrogon AB Holographic Optical Component Revenue in Global Market (2020-2025)
7.11.5 Spectrogon AB Key News & Latest Developments
7.12 Headwall
7.12.1 Headwall Corporate Summary
7.12.2 Headwall Business Overview
7.12.3 Headwall Holographic Optical Component Major Product Offerings
7.12.4 Headwall Holographic Optical Component Revenue in Global Market (2020-2025)
7.12.5 Headwall Key News & Latest Developments
7.13 Thorlabs
7.13.1 Thorlabs Corporate Summary
7.13.2 Thorlabs Business Overview
7.13.3 Thorlabs Holographic Optical Component Major Product Offerings
7.13.4 Thorlabs Holographic Optical Component Revenue in Global Market (2020-2025)
7.13.5 Thorlabs Key News & Latest Developments
8 Conclusion
9 Appendix
9.1 Note
9.2 Examples of Clients
9.3 DisclaimerList of Tables
Table 1. Holographic Optical Component Market Opportunities & Trends in Global Market
Table 2. Holographic Optical Component Market Drivers in Global Market
Table 3. Holographic Optical Component Market Restraints in Global Market
Table 4. Key Players of Holographic Optical Component in Global Market
Table 5. Top Holographic Optical Component Players in Global Market, Ranking by Revenue (2024)
Table 6. Global Holographic Optical Component Revenue by Companies, (US$, Mn), 2020-2025
Table 7. Global Holographic Optical Component Revenue Share by Companies, 2020-2025
Table 8. Global Companies Holographic Optical Component Product Type
Table 9. List of Global Tier 1 Holographic Optical Component Companies, Revenue (US$, Mn) in 2024 and Market Share
Table 10. List of Global Tier 2 and Tier 3 Holographic Optical Component Companies, Revenue (US$, Mn) in 2024 and Market Share
Table 11. Segmentation by Type – Global Holographic Optical Component Revenue, (US$, Mn), 2024 & 2032
Table 12. Segmentation by Type – Global Holographic Optical Component Revenue (US$, Mn), 2020-2025
Table 13. Segmentation by Type – Global Holographic Optical Component Revenue (US$, Mn), 2026-2032
Table 14. Segmentation by Application– Global Holographic Optical Component Revenue, (US$, Mn), 2024 & 2032
Table 15. Segmentation by Application – Global Holographic Optical Component Revenue, (US$, Mn), 2020-2025
Table 16. Segmentation by Application – Global Holographic Optical Component Revenue, (US$, Mn), 2026-2032
Table 17. By Region– Global Holographic Optical Component Revenue, (US$, Mn), 2024 & 2032
Table 18. By Region – Global Holographic Optical Component Revenue, (US$, Mn), 2020-2025
Table 19. By Region – Global Holographic Optical Component Revenue, (US$, Mn), 2026-2032
Table 20. By Country – North America Holographic Optical Component Revenue, (US$, Mn), 2020-2025
Table 21. By Country – North America Holographic Optical Component Revenue, (US$, Mn), 2026-2032
Table 22. By Country – Europe Holographic Optical Component Revenue, (US$, Mn), 2020-2025
Table 23. By Country – Europe Holographic Optical Component Revenue, (US$, Mn), 2026-2032
Table 24. By Region – Asia Holographic Optical Component Revenue, (US$, Mn), 2020-2025
Table 25. By Region – Asia Holographic Optical Component Revenue, (US$, Mn), 2026-2032
Table 26. By Country – South America Holographic Optical Component Revenue, (US$, Mn), 2020-2025
Table 27. By Country – South America Holographic Optical Component Revenue, (US$, Mn), 2026-2032
Table 28. By Country – Middle East & Africa Holographic Optical Component Revenue, (US$, Mn), 2020-2025
Table 29. By Country – Middle East & Africa Holographic Optical Component Revenue, (US$, Mn), 2026-2032
Table 30. Meta Materials Corporate Summary
Table 31. Meta Materials Holographic Optical Component Product Offerings
Table 32. Meta Materials Holographic Optical Component Revenue (US$, Mn) & (2020-2025)
Table 33. Meta Materials Key News & Latest Developments
Table 34. Ceres Holographics Corporate Summary
Table 35. Ceres Holographics Holographic Optical Component Product Offerings
Table 36. Ceres Holographics Holographic Optical Component Revenue (US$, Mn) & (2020-2025)
Table 37. Ceres Holographics Key News & Latest Developments
Table 38. Luminit Corporate Summary
Table 39. Luminit Holographic Optical Component Product Offerings
Table 40. Luminit Holographic Optical Component Revenue (US$, Mn) & (2020-2025)
Table 41. Luminit Key News & Latest Developments
Table 42. TruLife Optics Corporate Summary
Table 43. TruLife Optics Holographic Optical Component Product Offerings
Table 44. TruLife Optics Holographic Optical Component Revenue (US$, Mn) & (2020-2025)
Table 45. TruLife Optics Key News & Latest Developments
Table 46. Spectrum Scientifi Corporate Summary
Table 47. Spectrum Scientifi Holographic Optical Component Product Offerings
Table 48. Spectrum Scientifi Holographic Optical Component Revenue (US$, Mn) & (2020-2025)
Table 49. Spectrum Scientifi Key News & Latest Developments
Table 50. WaveFront Technology Corporate Summary
Table 51. WaveFront Technology Holographic Optical Component Product Offerings
Table 52. WaveFront Technology Holographic Optical Component Revenue (US$, Mn) & (2020-2025)
Table 53. WaveFront Technology Key News & Latest Developments
Table 54. Stensborg Corporate Summary
Table 55. Stensborg Holographic Optical Component Product Offerings
Table 56. Stensborg Holographic Optical Component Revenue (US$, Mn) & (2020-2025)
Table 57. Stensborg Key News & Latest Developments
Table 58. Light Logics Corporate Summary
Table 59. Light Logics Holographic Optical Component Product Offerings
Table 60. Light Logics Holographic Optical Component Revenue (US$, Mn) & (2020-2025)
Table 61. Light Logics Key News & Latest Developments
Table 62. Zeiss Corporate Summary
Table 63. Zeiss Holographic Optical Component Product Offerings
Table 64. Zeiss Holographic Optical Component Revenue (US$, Mn) & (2020-2025)
Table 65. Zeiss Key News & Latest Developments
Table 66. Kaiser Optical Systems Corporate Summary
Table 67. Kaiser Optical Systems Holographic Optical Component Product Offerings
Table 68. Kaiser Optical Systems Holographic Optical Component Revenue (US$, Mn) & (2020-2025)
Table 69. Kaiser Optical Systems Key News & Latest Developments
Table 70. Spectrogon AB Corporate Summary
Table 71. Spectrogon AB Holographic Optical Component Product Offerings
Table 72. Spectrogon AB Holographic Optical Component Revenue (US$, Mn) & (2020-2025)
Table 73. Spectrogon AB Key News & Latest Developments
Table 74. Headwall Corporate Summary
Table 75. Headwall Holographic Optical Component Product Offerings
Table 76. Headwall Holographic Optical Component Revenue (US$, Mn) & (2020-2025)
Table 77. Headwall Key News & Latest Developments
Table 78. Thorlabs Corporate Summary
Table 79. Thorlabs Holographic Optical Component Product Offerings
Table 80. Thorlabs Holographic Optical Component Revenue (US$, Mn) & (2020-2025)
Table 81. Thorlabs Key News & Latest Developments

List of Figures
Figure 1. Holographic Optical Component Product Picture
Figure 2. Holographic Optical Component Segment by Type in 2024
Figure 3. Holographic Optical Component Segment by Application in 2024
Figure 4. Global Holographic Optical Component Market Overview: 2024
Figure 5. Key Caveats
Figure 6. Global Holographic Optical Component Market Size: 2024 VS 2032 (US$, Mn)
Figure 7. Global Holographic Optical Component Revenue: 2020-2032 (US$, Mn)
Figure 8. The Top 3 and 5 Players Market Share by Holographic Optical Component Revenue in 2024
Figure 9. Segmentation by Type – Global Holographic Optical Component Revenue, (US$, Mn), 2024 & 2032
Figure 10. Segmentation by Type – Global Holographic Optical Component Revenue Market Share, 2020-2032
Figure 11. Segmentation by Application – Global Holographic Optical Component Revenue, (US$, Mn), 2024 & 2032
Figure 12. Segmentation by Application – Global Holographic Optical Component Revenue Market Share, 2020-2032
Figure 13. By Region – Global Holographic Optical Component Revenue Market Share, 2020-2032
Figure 14. By Country – North America Holographic Optical Component Revenue Market Share, 2020-2032
Figure 15. United States Holographic Optical Component Revenue, (US$, Mn), 2020-2032
Figure 16. Canada Holographic Optical Component Revenue, (US$, Mn), 2020-2032
Figure 17. Mexico Holographic Optical Component Revenue, (US$, Mn), 2020-2032
Figure 18. By Country – Europe Holographic Optical Component Revenue Market Share, 2020-2032
Figure 19. Germany Holographic Optical Component Revenue, (US$, Mn), 2020-2032
Figure 20. France Holographic Optical Component Revenue, (US$, Mn), 2020-2032
Figure 21. U.K. Holographic Optical Component Revenue, (US$, Mn), 2020-2032
Figure 22. Italy Holographic Optical Component Revenue, (US$, Mn), 2020-2032
Figure 23. Russia Holographic Optical Component Revenue, (US$, Mn), 2020-2032
Figure 24. Nordic Countries Holographic Optical Component Revenue, (US$, Mn), 2020-2032
Figure 25. Benelux Holographic Optical Component Revenue, (US$, Mn), 2020-2032
Figure 26. By Region – Asia Holographic Optical Component Revenue Market Share, 2020-2032
Figure 27. China Holographic Optical Component Revenue, (US$, Mn), 2020-2032
Figure 28. Japan Holographic Optical Component Revenue, (US$, Mn), 2020-2032
Figure 29. South Korea Holographic Optical Component Revenue, (US$, Mn), 2020-2032
Figure 30. Southeast Asia Holographic Optical Component Revenue, (US$, Mn), 2020-2032
Figure 31. India Holographic Optical Component Revenue, (US$, Mn), 2020-2032
Figure 32. By Country – South America Holographic Optical Component Revenue Market Share, 2020-2032
Figure 33. Brazil Holographic Optical Component Revenue, (US$, Mn), 2020-2032
Figure 34. Argentina Holographic Optical Component Revenue, (US$, Mn), 2020-2032
Figure 35. By Country – Middle East & Africa Holographic Optical Component Revenue Market Share, 2020-2032
Figure 36. Turkey Holographic Optical Component Revenue, (US$, Mn), 2020-2032
Figure 37. Israel Holographic Optical Component Revenue, (US$, Mn), 2020-2032
Figure 38. Saudi Arabia Holographic Optical Component Revenue, (US$, Mn), 2020-2032
Figure 39. UAE Holographic Optical Component Revenue, (US$, Mn), 2020-2032
Figure 40. Meta Materials Holographic Optical Component Revenue Year Over Year Growth (US$, Mn) & (2020-2025)
Figure 41. Ceres Holographics Holographic Optical Component Revenue Year Over Year Growth (US$, Mn) & (2020-2025)
Figure 42. Luminit Holographic Optical Component Revenue Year Over Year Growth (US$, Mn) & (2020-2025)
Figure 43. TruLife Optics Holographic Optical Component Revenue Year Over Year Growth (US$, Mn) & (2020-2025)
Figure 44. Spectrum Scientifi Holographic Optical Component Revenue Year Over Year Growth (US$, Mn) & (2020-2025)
Figure 45. WaveFront Technology Holographic Optical Component Revenue Year Over Year Growth (US$, Mn) & (2020-2025)
Figure 46. Stensborg Holographic Optical Component Revenue Year Over Year Growth (US$, Mn) & (2020-2025)
Figure 47. Light Logics Holographic Optical Component Revenue Year Over Year Growth (US$, Mn) & (2020-2025)
Figure 48. Zeiss Holographic Optical Component Revenue Year Over Year Growth (US$, Mn) & (2020-2025)
Figure 49. Kaiser Optical Systems Holographic Optical Component Revenue Year Over Year Growth (US$, Mn) & (2020-2025)
Figure 50. Spectrogon AB Holographic Optical Component Revenue Year Over Year Growth (US$, Mn) & (2020-2025)
Figure 51. Headwall Holographic Optical Component Revenue Year Over Year Growth (US$, Mn) & (2020-2025)
Figure 52. Thorlabs Holographic Optical Component Revenue Year Over Year Growth (US$, Mn) & (2020-2025)