3D Visualization Market Insights
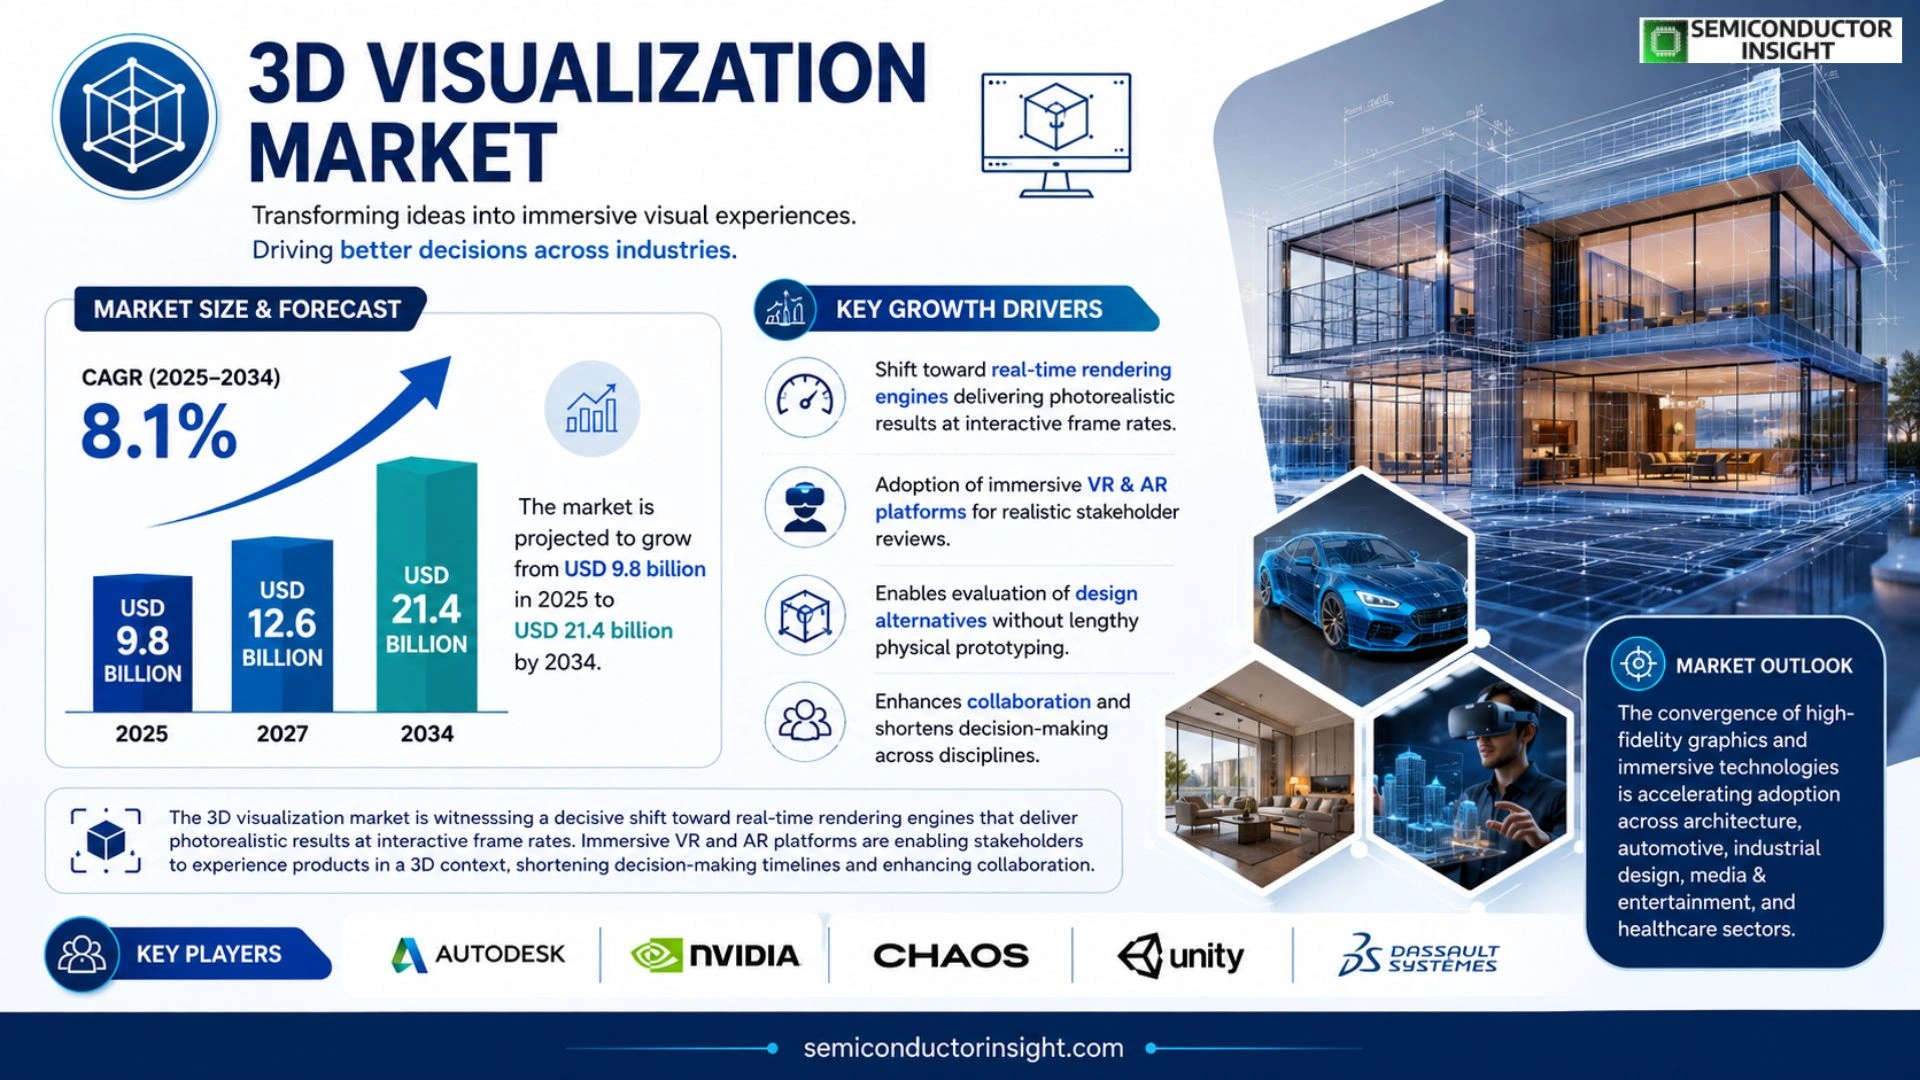
3D Visualization Market size was valued at USD 9.2 billion in 2025. The market is projected to grow from USD 9.8 billion in 2025 to USD 21.4 billion by 2034, exhibiting a CAGR of 8.1% during the forecast period.
3D visualization refers to the process of creating interactive three‑dimensional representations of objects or environments using computer graphics software. It enables stakeholders across architecture, automotive design, gaming, and industrial manufacturing to explore complex geometries and spatial relationships virtually. Key technologies include real‑time rendering engines, photorealistic shading, and immersive VR/AR interfaces.
The market is experiencing rapid growth because enterprises are investing heavily in digital twins and immersive experiences. Furthermore, advances in cloud‑based rendering reduce hardware barriers, while rising demand for AR/VR applications fuels adoption. However, high computational costs remain a challenge. Key players such as Autodesk, Unity Technologies, Epic Games, and Siemens are expanding their portfolios through strategic partnerships and AI‑driven rendering solutions.
MARKET DRIVERS
Increasing Adoption Across Industries
3D visualization market is expanding as architecture, automotive, and media companies integrate immersive rendering into design workflows. In 2024, more than 60% of major architectural firms reported using photorealistic 3D models to shorten client approval cycles, driving revenue growth of roughly 12% year‑on‑year.
Advancements in Real‑Time Rendering
GPU manufacturers have released hardware that cuts rendering latency by half, enabling real‑time visualization in virtual showrooms and training simulators. This technical progress lowers project costs and attracts mid‑size enterprises that previously considered the technology prohibitively expensive.
➤ Real‑time ray tracing can reduce processing time by up to 40% compared with legacy offline pipelines.
Combined, these drivers create a virtuous cycle: faster tools improve project turn‑around, which in turn raises demand for more sophisticated visual content, propelling 3D visualization market forward.
MARKET CHALLENGES
High Computational Requirements
Despite hardware gains, rendering complex scenes still demands substantial processing power and memory bandwidth. Companies that rely on legacy workstations often face bottlenecks that extend delivery timelines and erode profit margins.
Other Challenges
Talent Shortage
The industry reports a shortfall of skilled 3D artists and technical directors, with vacancy rates approaching 25% in major hubs. This scarcity drives salary inflation and hampers the ability of firms to scale projects quickly.
MARKET RESTRAINTS
Cost Sensitivity in Emerging Regions
Small and medium enterprises in emerging economies cite high software licensing fees as a primary barrier to entry, limiting market penetration despite growing interest in visual storytelling.
Moreover, the need for continual hardware upgrades creates a recurring capital expense that many firms deem unsustainable in volatile economic climates.
Regulatory scrutiny over data privacy in cloud‑based rendering services adds another layer of complexity, often requiring additional compliance investments.
MARKET OPPORTUNITIES
Growth of Cloud‑Native Rendering Platforms
Cloud providers are launching pay‑as‑you‑go rendering services that lower upfront costs and democratize access to high‑end GPUs. This model is expected to unlock a 15% CAGR in the next five years as more firms adopt subscription‑based workflows.
Additionally, the convergence of 3D visualization with augmented reality (AR) and mixed reality (MR) opens new revenue streams in retail and education, where interactive 3D experiences can boost engagement and conversion rates.
Strategic partnerships between software vendors and hardware manufacturers are accelerating the rollout of optimized pipelines, creating a favorable ecosystem for rapid market expansion.
3D Visualization Market Trends
Rise of Real‑Time Rendering and Immersive Interfaces
3D visualization market is witnessing a decisive shift toward real‑time rendering engines that deliver photorealistic results at interactive frame rates. Architects, automotive designers, and industrial engineers are increasingly using these engines to evaluate spatial relationships and design alternatives without lengthy physical prototyping cycles. Simultaneously, immersive virtual‑reality (VR) and augmented‑reality (AR) platforms are being integrated into stakeholder reviews, enabling clients to experience products in a three‑dimensional context that mirrors real‑world interactions. This convergence of high‑fidelity graphics and immersive media shortens decision‑making timelines and enhances cross‑disciplinary collaboration, positioning the market for sustained adoption across core verticals.
Other Trends
Adoption of Cloud‑Based Rendering Services
Enterprises are turning to cloud‑based rendering to lower the barrier of entry associated with on‑premise hardware investments. By outsourcing compute‑intensive tasks to scalable data‑center resources, firms can access the latest GPU capabilities on a pay‑as‑you‑go basis, which accelerates project turnover and reduces capital expenditure. This model also facilitates collaborative workflows, as designers in disparate locations can share and update visual assets in real time. The shift to cloud infrastructure is further reinforced by improved network bandwidth and the emergence of subscription‑level licensing, which together democratize access to advanced visualization tools for midsize companies.
Strategic Partnerships and AI‑Enhanced Workflows
Leading vendors are forming strategic alliances to embed artificial‑intelligence (AI) algorithms directly into the rendering pipeline. AI‑driven denoising, material generation, and automated scene composition are streamlining the creation of complex visualizations, allowing artists to focus on creative direction rather than manual detail work. Partnerships between software providers and hardware manufacturers are also expanding the ecosystem of compatible devices, ensuring seamless integration of high‑performance GPUs, ray‑tracing accelerators, and edge‑computing solutions. These collaborations not only broaden the functional scope of 3D visualization market but also accelerate the rollout of next‑generation features such as dynamic lighting adaptation and context‑aware asset placement, reinforcing the market’s trajectory toward smarter, faster, and more accessible visualization capabilities.
COMPETITIVE LANDSCAPE
Key Industry Players
3D Visualization Market Competitive Overview
3D visualization market is anchored by a handful of globally integrated platforms that command the majority of revenue and ecosystem adoption. Autodesk leads with its Fusion 360 and Revit suites, offering end‑to‑end design, simulation, and rendering capabilities that serve architecture, engineering, and construction (AEC) as well as product design. Unity Technologies and Epic Games dominate the real‑time rendering space, leveraging their game‑engine roots to power immersive VR/AR experiences and digital twins across automotive, manufacturing, and entertainment sectors. Siemens extends its industrial portfolio through the Siemens Teamcenter and NX platforms, embedding photorealistic rendering in PLM workflows. Dassault Systèmes, with its SOLIDWORKS and CATIA solutions, provides high‑fidelity visualizations for aerospace and complex engineering. These leaders benefit from deep developer ecosystems, strategic AI‑driven rendering tools, and extensive partner networks, creating a market structure where scale and integration drive competitive advantage.
Beyond the tier‑one giants, a diverse set of niche and technology‑focused firms enriches the competitive landscape. NVIDIA’s RTX‑accelerated cloud rendering services enable on‑demand photorealism for smaller studios. PTC’s Vuforia platform couples 3D visualization with augmented reality for field service and industrial training. Trimble offers specialized visualization for construction site planning, while Ansys provides simulation‑linked visual outputs for scientific and engineering analysis. Adobe expands the market through Substance suite, delivering texture‑driven visual content for gaming and product marketing. Emerging players such as Apple’s RealityKit and open‑source initiatives like Blender also contribute innovative workflows, ensuring continuous fragmentation and specialization within the broader market.
List of Key 3D Visualization Companies Profiled
- Autodesk
- Unity Technologies
- Epic Games
- Siemens
- Dassault Systèmes
- NVIDIA
- PTC
- Trimble
- Ansys
- Adobe
- Apple
- Blender Foundation
- Autodesk
- Vuforia (PTC)
Segment Analysis:
| Segment Category | Sub-Segments | Key Insights |
| By Type |
|
Real‑time Rendering
|
| By Application |
|
Architecture & Construction
|
| By End User |
|
Design Studios
|
| By Technology Adoption |
|
Cloud‑Based Rendering
|
| By Market Driver |
|
Digital Twin Development
|
Regional Analysis: North America
United States
The automotive and aerospace industries are heavily reliant on 3D visualization for rapid prototyping and design iteration, leading to enhanced efficiency and reduced costs.
3D visualization plays a crucial role in medical imaging, allowing for detailed anatomical analysis, surgical planning, and patient education, improving diagnostic accuracy and treatment outcomes.
The entertainment industry leverages 3D visualization for creating immersive experiences in film, gaming, and virtual worlds, enhancing audience engagement and visual storytelling.
Architects and construction professionals utilize 3D visualization for creating realistic building models, facilitating design reviews, and improving project communication, leading to enhanced collaboration and reduced errors.
Europe
The European 3D Visualization Market is characterized by a strong emphasis on innovation and a growing adoption of advanced technologies. Driven by the robust manufacturing sector and increasing investments in research, particularly within Germany, the UK, and France, the market is poised for continued expansion. The automotive and aerospace industries in Europe are significant consumers of 3D visualization solutions, utilizing them for design optimization, simulation, and quality control. Furthermore, the burgeoning VR/AR sector is fueling demand for realistic 3D models and immersive experiences. European companies are increasingly adopting cloud-based 3D visualization platforms to enhance collaboration and scalability. The focus on sustainability and efficiency is also driving the use of 3D visualization in product design and industrial processes. The overall market is fragmented, with a mix of large multinational corporations and specialized regional players. This regional market is demonstrating a strong inclination toward user-friendly 3D software and integrated design workflows.
Asia-Pacific
The Asia-Pacific region presents a significant growth opportunity for 3D visualization market, driven by rapid industrialization, increasing disposable incomes, and a growing demand for sophisticated design and engineering solutions. China, Japan, and South Korea are key markets within the region, with substantial investments in manufacturing, automotive, and entertainment industries. The adoption of 3D visualization is accelerating in sectors like electronics, consumer goods, and infrastructure development. The increasing penetration of digital technologies and the growing popularity of VR/AR are further boosting market growth. The region is witnessing a rise in local 3D visualization software developers, catering to the specific needs of Asian industries. The focus is shifting towards affordable and user-friendly solutions. However, challenges remain in terms of standardization and the need for skilled professionals.
South America
3D visualization market in South America is showing steady growth, fueled primarily by the expanding manufacturing and construction sectors. Brazil and Argentina are the dominant markets in the region, with increasing adoption of 3D visualization in automotive, aerospace, and energy industries. The demand for 3D modeling and rendering is growing in architecture and urban planning projects. Despite economic fluctuations, the region is witnessing increasing investments in digital infrastructure, contributing to the adoption of 3D visualization solutions. The market is relatively nascent compared to North America and Europe, but it holds significant potential for future growth. Local software vendors and service providers are emerging to meet the specific requirements of the South American market.
Middle East & Africa
The Middle East & Africa region represents a promising, albeit relatively smaller, market for 3D Visualization. The rapid development in infrastructure, oil & gas, and construction sectors is driving demand for 3D modeling and simulation. Countries like Saudi Arabia, UAE, and South Africa are witnessing increasing adoption of 3D visualization in architectural design, urban planning, and industrial projects. The oil and gas industry is a major driver, utilizing 3D visualization for reservoir modeling and pipeline design. The region is experiencing a surge in investments in smart city initiatives, boosting the demand for 3D visualization for urban planning and visualization. The market is still in its early stages of development, with a growing need for skilled professionals and localized solutions.
Report Scope
This market research report provides a comprehensive analysis of the 3D Visualization Market , covering the forecast period 2026–2034. It offers detailed insights into market dynamics, technological advancements, competitive landscape, and key trends shaping the industry.
Key focus areas of the report include:
- Market Overview: The report begins with an overview outlining its current market scenario, key growth indicators, and industry transformation drivers. It discusses macroeconomic factors, demand–supply balance, regulatory landscape, and the strategic role of semiconductors in powering advancements across industries such as automotive, telecommunications, consumer electronics, and industrial automation.
- Market Size & Forecast: Historical data and future projections for revenue, unit shipments, and market value across major regions and segments.
- Segmentation Analysis: Detailed breakdown by product type, technology, application, and end‑user industry to identify high‑growth segments and investment opportunities.
- Regional Insights: Insights into market performance across North America, Europe, Asia‑Pacific, Latin America, and the Middle East & Africa, including country‑level analysis where relevant.
- Competitive Landscape: Profiles of leading market participants, including their product offerings, R&D focus, manufacturing capacity, pricing strategies, and recent developments such as mergers, acquisitions, and partnerships.
- Technology Trends & Innovation: Assessment of emerging technologies, integration of AI/IoT, semiconductor design trends, fabrication techniques, and evolving industry standards.
- Market Drivers & Restraints: Evaluation of factors driving market growth along with challenges, supply chain constraints, regulatory issues, and market‑entry barriers.
- Stakeholder Insights: Insights for component suppliers, OEMs, system integrators, investors, and policymakers regarding the evolving ecosystem and strategic opportunities.
Primary and secondary research methods are employed, including interviews with industry experts, data from verified sources, and real‑time market intelligence to ensure the accuracy and reliability of the insights presented.
FREQUENTLY ASKED QUESTIONS:
What is the current market size of 3D Visualization Market?
-> 3D visualization market was valued at USD 9.2 billion in 2025 and is expected to reach USD 21.4 billion by 2034 with a CAGR of 8.1% during the forecast period.
Which key companies operate 3D visualization market?
-> Key players include Autodesk, Unity Technologies, Epic Games, and Siemens, among others.
What are the key growth drivers?
-> Key growth drivers include investment in digital twins, immersive AR/VR experiences, and cloud‑based rendering solutions.
Which region dominates the market?
-> Asia‑Pacific is the fastest‑growing region, while Europe remains a dominant market.
What are the emerging trends?
-> Emerging trends include AI‑driven rendering, real‑time ray tracing, and integration of immersive VR/AR interfaces.

Get Sample Report PDF for Exclusive Insights
Report Sample Includes
- Table of Contents
- List of Tables & Figures
- Charts, Research Methodology, and more...